3328
Assessment of acinar destruction in idiopathic pulmonary fibrosis with hyperpolarised 3He gas diffusion-weighted MRI: reproducibility of ADC metrics and correlation with physiological parameters of disease severity.1Academic Unit of Radiology, University of Sheffield, Sheffield, United Kingdom, 2Academic Directorate of Respiratory Medicine, Sheffield Teaching Hospitals, Sheffield, United Kingdom, 3Infection, Immunity and Cardiovascular Disease, University of Sheffield, Sheffield, United Kingdom
Synopsis
Outcome metrics from diffusion-weighted MRI (DW-MRI) were evaluated for reproducibility and clinical correlation in a cohort of patients with idiopathic pulmonary fibrosis (IPF). It was hypothesized that fibrotic lung tissue in IPF undergoes changes that increase the rate of intra-acinar Brownian diffusion.
Apparent diffusion coefficient (ADC) mean, median and histogram metrics are highly reproducible and correlate both quantitatively with regional fibrosis on CT and qualitatively with carbon monoxide transfer coefficient (KCO) from pulmonary function tests. DW-MRI imaging metrics may provide novel insights into microstructural disease severity in IPF and may prove to be a useful non-ionising imaging biomarker of disease.
Purpose
Diffusion-weighted magnetic resonance imaging (DW-MRI) of the lung assessed using hyperpolarised noble gases has become a useful clinical tool in the assessment of micro-structural changes in lung disease, in particular emphysema associated with chronic obstructive pulmonary disease (COPD). 1 Mean apparent diffusion coefficient (ADC) is used as a quantitative marker of acinar micro-structural changes.
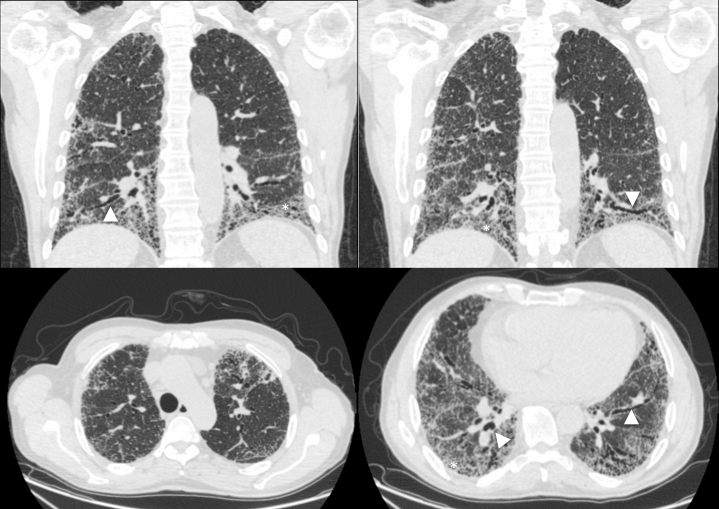
Idiopathic pulmonary fibrosis (IPF) is a rapidly progressive and usually fatal disease of older age, characterised by lung fibrosis extending from basal and peripheral lung tissue, evident on computed tomography (CT) imaging (figure 1). A recent study examined explanted lung tissue of patients with COPD in the assessment of ex-vivo DW-MRI metrics, using IPF lungs as control specimens. 2 However, it appeared that IPF lungs might also demonstrate different patterns of acinar airspace enlargement on DW-MRI. These findings contrast with 3He ADC findings from rat models instilled with bleomycin, 3 a commonly utilised animal model of IPF. In this work we investigate (i) if mean ADC and other metrics from ADC histogram analysis demonstrate in vivo acinar airspace enlargement in patients with IPF, (ii) whether these metrics are reproducible, and (iii) how these metrics correlate with the currently accepted standards of clinical evaluation of IPF.
Methods
13 participants with IPF underwent DW-MRI with hyperpolarised 3He gas. 10 underwent a second identical scan on the same day for assessment of scan-scan repeatability, 4 then returned for a 3rd scan six months after their first scan. Pulmonary function tests (PFTs) utilised clinically for IPF assessment were performed on the same day, including forced vital capacity (FVC), single-breath carbon monoxide transfer factor (TLCO) and coefficient (KCO) measurements.
300mL of 3He (~25% polarisation) was mixed with nitrogen (N2) to balance 1L in a Tedlar bag. Participants were coached to achieve functional residual capacity (FRC) and practiced inhaling 1L of room air from a Tedlar bag prior to imaging. Images were acquired during a 15 second breath-hold manoeuvre following inhalation of the gas mix from FRC.
All imaging was performed on a 1.5T GE HDx scanner, using a 3D SPGR, multiple b-value DW-MRI sequence with compressed sensing. 4 ADC was calculated for each voxel and metrics taken included mean and median. Histograms of ADC for each scan were analysed for skew and kurtosis.
Reproducibility was assessed with Fleiss intraclass correlation. Non-parametric analysis (Spearman’s rho) determined correlation values. Two tailed p-values < 0.05 determined statistical significance.
Results
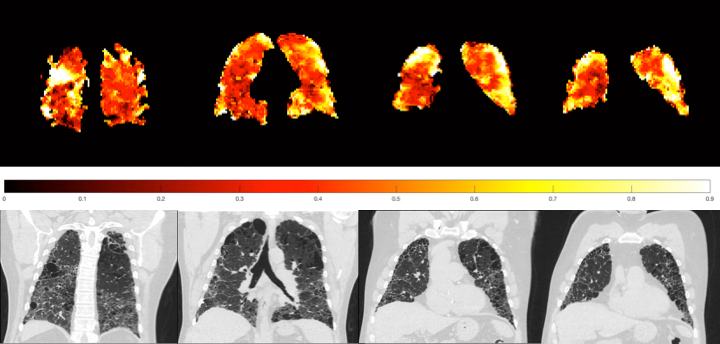
The mean ADC of our participant cohort was 0.318 cm2s-1, which is substantially higher than that observed in cohorts of healthy subjects, even adjusting for the apparent increase in ADC with advancing age. 5, 6 Regions of high ADC appear qualitatively related to fibrotic changes on accompanying CT imaging (figure 2).
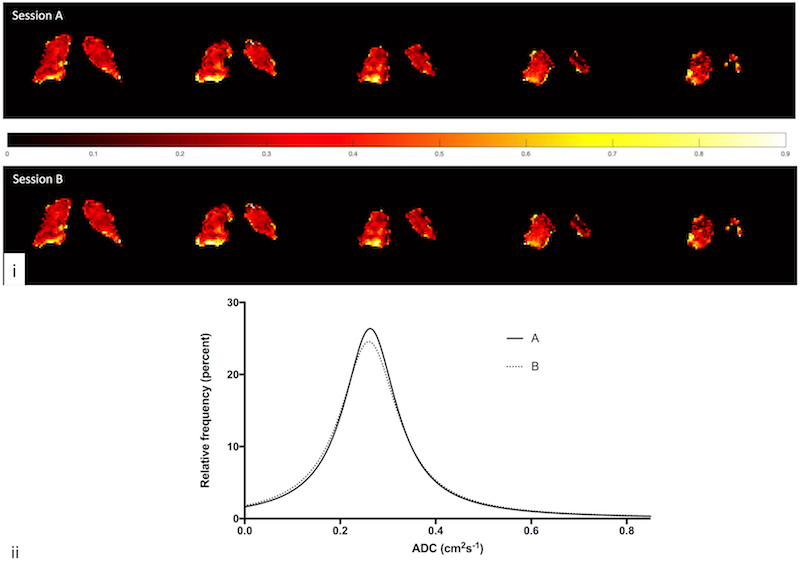
Same day intra-participant scan metrics were highly reproducible, including mean ADC (0.962), median ADC (0.950), histogram skewness (0.863) and kurtosis (0.948) (p < 0.001 for all). Example coronal slices and ADC histograms from two same day imaging sessions from the same participant are shown (figure 3).
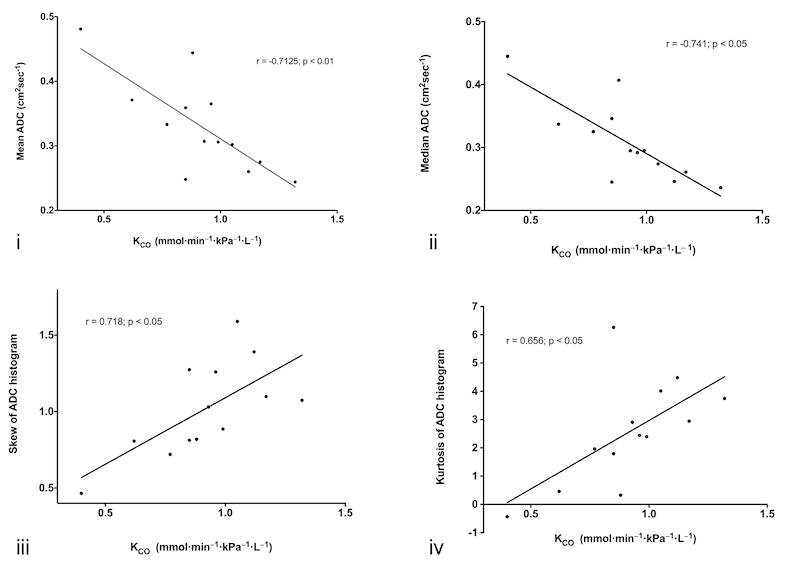
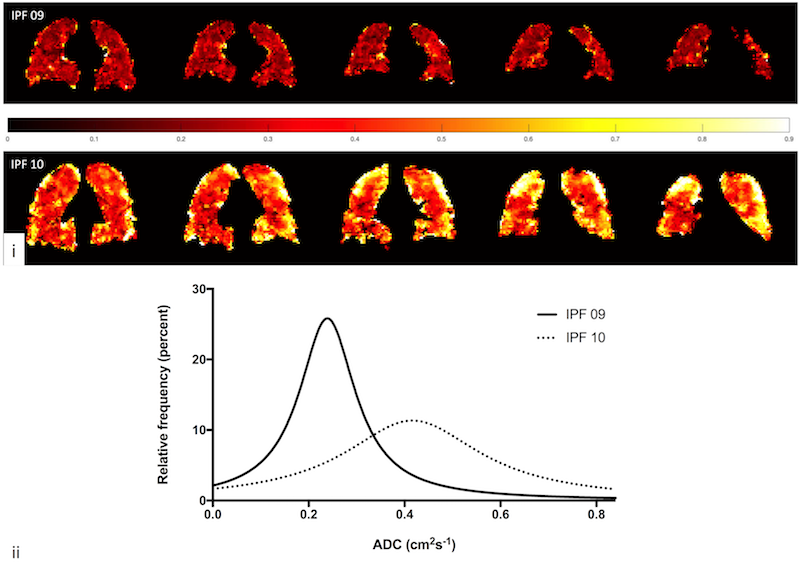
KCO correlated with all measures of ADC analytics: mean ADC (-0.713), median ADC (-0.735), skewness (0.718) and kurtosis (0.657), with p < 0.05 for all (figure 4). Example ADC coronal map and histograms for two patients with varying disease severity are shown (figure 5).
In three participants without signs of clinical disease progression, six-month mean and median ADC was highly reproducible (0.959 and 0.971, respectively with p < 0.001).
Discussion
ADC mean and median values are elevated in IPF, and increase with worsening gas diffusion as measured by KCO. The histogram peak shifts to the right reflecting heterogeneity in lung microstructure at the acinar length scale; presumably as healthy lung tissue is replaced by fibrosis.
All ADC metrics had excellent same day reproducibility and early longitudinal data suggests they are also reproducible at six months in clinically stable patients with IPF. Microstructural change, identified by increased Brownian motion of 3He gas accompanies increased disease severity measured by PFTs, suggesting that DW-MRI may be a useful non-ionising imaging technique in the assessment of microstructural changes accompanying fibrotic disease.
Whether the observed changes relate pathologically to bronchiolisation of the terminal airways with honeycombing formation, traction bronchiectasis, or another pathological element of IPF remains to be seen and further work is needed to assess the prognostic ability of this novel imaging modality.
Conclusion
3He DW-MRI metrics demonstrate same day reproducibility and correlate with functional IPF features at baseline and following disease deterioration. ADC histogram analytics and summary metrics may be useful non-ionising non-invasive regional markers of disease.Acknowledgements
No acknowledgement found.References
1. Swift, A.J., Wild, J.M., Fichele, S., et al., Emphysematous changes and normal variation in smokers and COPD patients using diffusion 3He MRI. European Journal of Radiology, 2005. 54(3):p.352-8.
2. Thomen, R.P., Quirk, J.D., Roach, D., et al., Direct comparison of (129) Xe diffusion measurements with quantitative histology in human lungs. Magnetic Resonance in Medicine, 2016:p.17.
3. Stephen, M.J., Emami, K., Woodburn, J.M., et al., Quantitative assessment of lung ventilation and microstructure in an animal model of idiopathic pulmonary fibrosis using hyperpolarized gas MRI. Academic Radiology, 2010. 17(11):p.1433-43.
4. Chan, H.-F., Stewart, N.J., Parra-Robles, J., et al., Whole lung morphometry with 3D multiple b-value hyperpolarized gas MRI and compressed sensing. Magnetic Resonance in Medicine, 2016:p.doi:10.1002/mrm.26279.[Epub ahead of print].
5. Kirby, M., Ouriadov, A., Svenningsen, S., et al., Hyperpolarized (3)He and (129)Xe magnetic resonance imaging apparent diffusion coefficients: physiological relevance in older never- and ex-smokers. Physiological Reports, 2014. 2(7):p.e12068.
6. Fain, S.B., Altes, T.A., Panth, S.R., et al., Detection of Age-Dependent Changes in Healthy Adult Lungs With Diffusion-Weighted 3He MRI. Academic Radiology, 2005. 12(11):p.1385-1393.
Figures