3326
A spatial comparison of CT-based surrogates of ventilation with hyperpolarized Helium-3 & Xenon-129 MRIBilal Tahir1,2, Paul Hughes2, Helen Marshall2, Neil Stewart1, Felix Horn2, Guilhem Collier2, Graham Norquay2, Kerry Hart1, James Swinscoe1, Matthew Hatton1, Jim Wild2, and Rob Ireland1
1Academic Unit of Clinical Oncology, University of Sheffield, Sheffield, United Kingdom, 2Academic Radiology, University of Sheffield, Sheffield, United Kingdom
Synopsis
Synopsis: Image registration of lung CT images acquired at different inflation levels has been proposed as a surrogate method to map lung ‘ventilation’. However, this technique requires validation against established ventilation modalities such as hyperpolarised gas MRI. Here, we develop an image acquisition and analysis strategy to facilitate direct spatial correlation of ventilation CT with both hyperpolarised 3He & 129Xe MRI and apply our method to a cohort of lung cancer patients.
Introduction
Image registration of inspiratory and expiratory CT is a potential method of mapping regional ventilation assuming lung expansion & density changes of corresponding parenchymal voxels equate to ventilation [1]. However, its physiological accuracy has yet to be validated against a direct ventilation modality such as hyperpolarised gas (HP) MRI. Previous Ventilation CT vs HP Gas MRI work by Mathew et al [2] had compared the spatial overlap of binary thresholded images from both modalities by the dice overlap coefficient. Such overlap measures provide a more global comparison and thus region of interest (ROI) analysis may improve the comparison by assessing the correlation of the intensity distribution of corresponding regions within the binary segmentations.Methods
5 patients underwent expiratory and inspiratory breath-hold CT. 129Xe and 1H MRI were also acquired at the same inflation state as inspiratory CT. This was followed immediately by acquisition of 3He & 1H MRI in the same breath and at the same inflation state as inspiratory CT. Expiration CT was deformably registered to inspiration CT for calculation of ventilation CT from voxel-wise differences in Hounsfield units. Inspiration CT and the 129Xe MRI’s corresponding anatomical 1H MRI were registered to 3He MRI via the same-breath anatomical 1H MRI [3]. Spatial correlation was assessed by computing the voxel-wise Spearman correlation coefficients between each ventilation CT image and its corresponding 3He/129Xe MR image and for the median values in corresponding regions of interest (ROIs), ranging from finer to coarser in-plane dimensions of 5 by 5, 10 by 10, 15 by 15 and 20 by 20, located within the lungs as defined by the same-breath 1H MRI lung mask. As a secondary analysis in order to establish scan-to-scan similarity between 3He and 129Xe MRI, Spearman coefficients were assessed at the voxel-level and for the same ROIs detailed above.Results
Figure 2 shows corresponding coronal slices of CT, 3He and 129Xe MRI for an example patient after image registration. The voxel-wise Spearman’s coefficients and for a range of corresponding ROIs of ventilation CT, 3He and 129Xe MRI for all patients are displayed in Table 1 and shown graphically as a box plot in Figure 3.Discussion
Several interesting trends can be observed from the data; the spatial correlations between ventilation CT, 3He and 129Xe begin to increase with more coarsely defined ROIs and start to reach a plateau for ROIs of 15 by 15 voxels. Furthermore, a marked increase in Spearman correlation was observed for 3He and 129Xe MRI in contrast to when ventilation CT was compared with either 3He and 129Xe MRI. Changes in lung HU density related to non-ventilatory mechanisms such as changes in perfusion due to inflation state may account for some of the marked differences seen for this patient cohort. The CT ventilation method is a measure of local lung expansion and assumes constant blood volume between inspiration and expiration where volume changes are only due to the influx of air.Conclusion
This work demonstrates direct spatial comparison of ventilation from CT & hyperpolarized gas MRI (3He & 129Xe MRI). Initial results exhibit moderate correlation between ventilation CT & hyperpolarized gas MRI, which improves for coarser regions. Discrepancies could be attributable to a number of factors including non-ventilatory effects due to blood volume changes between inflation states which are not accounted for in the model, the inherent noise in CT intensity, and registration errors at the voxel-level. Thus, it may be more beneficial to quantify ventilation at a more regional level.Acknowledgements
University of Sheffield James Morrison Fund, Sheffield Hospitals Charity, Weston Park Hospital Cancer Charity, National Institute of Health Research and Medical Research Council.References
References: [1] Int J Radiat Oncol Biol Phys 2005;62:630-634, [2] Acad Radiol 2012;19:1546-1553, [3] Phys Med Biol 2014;59:7267-77Figures
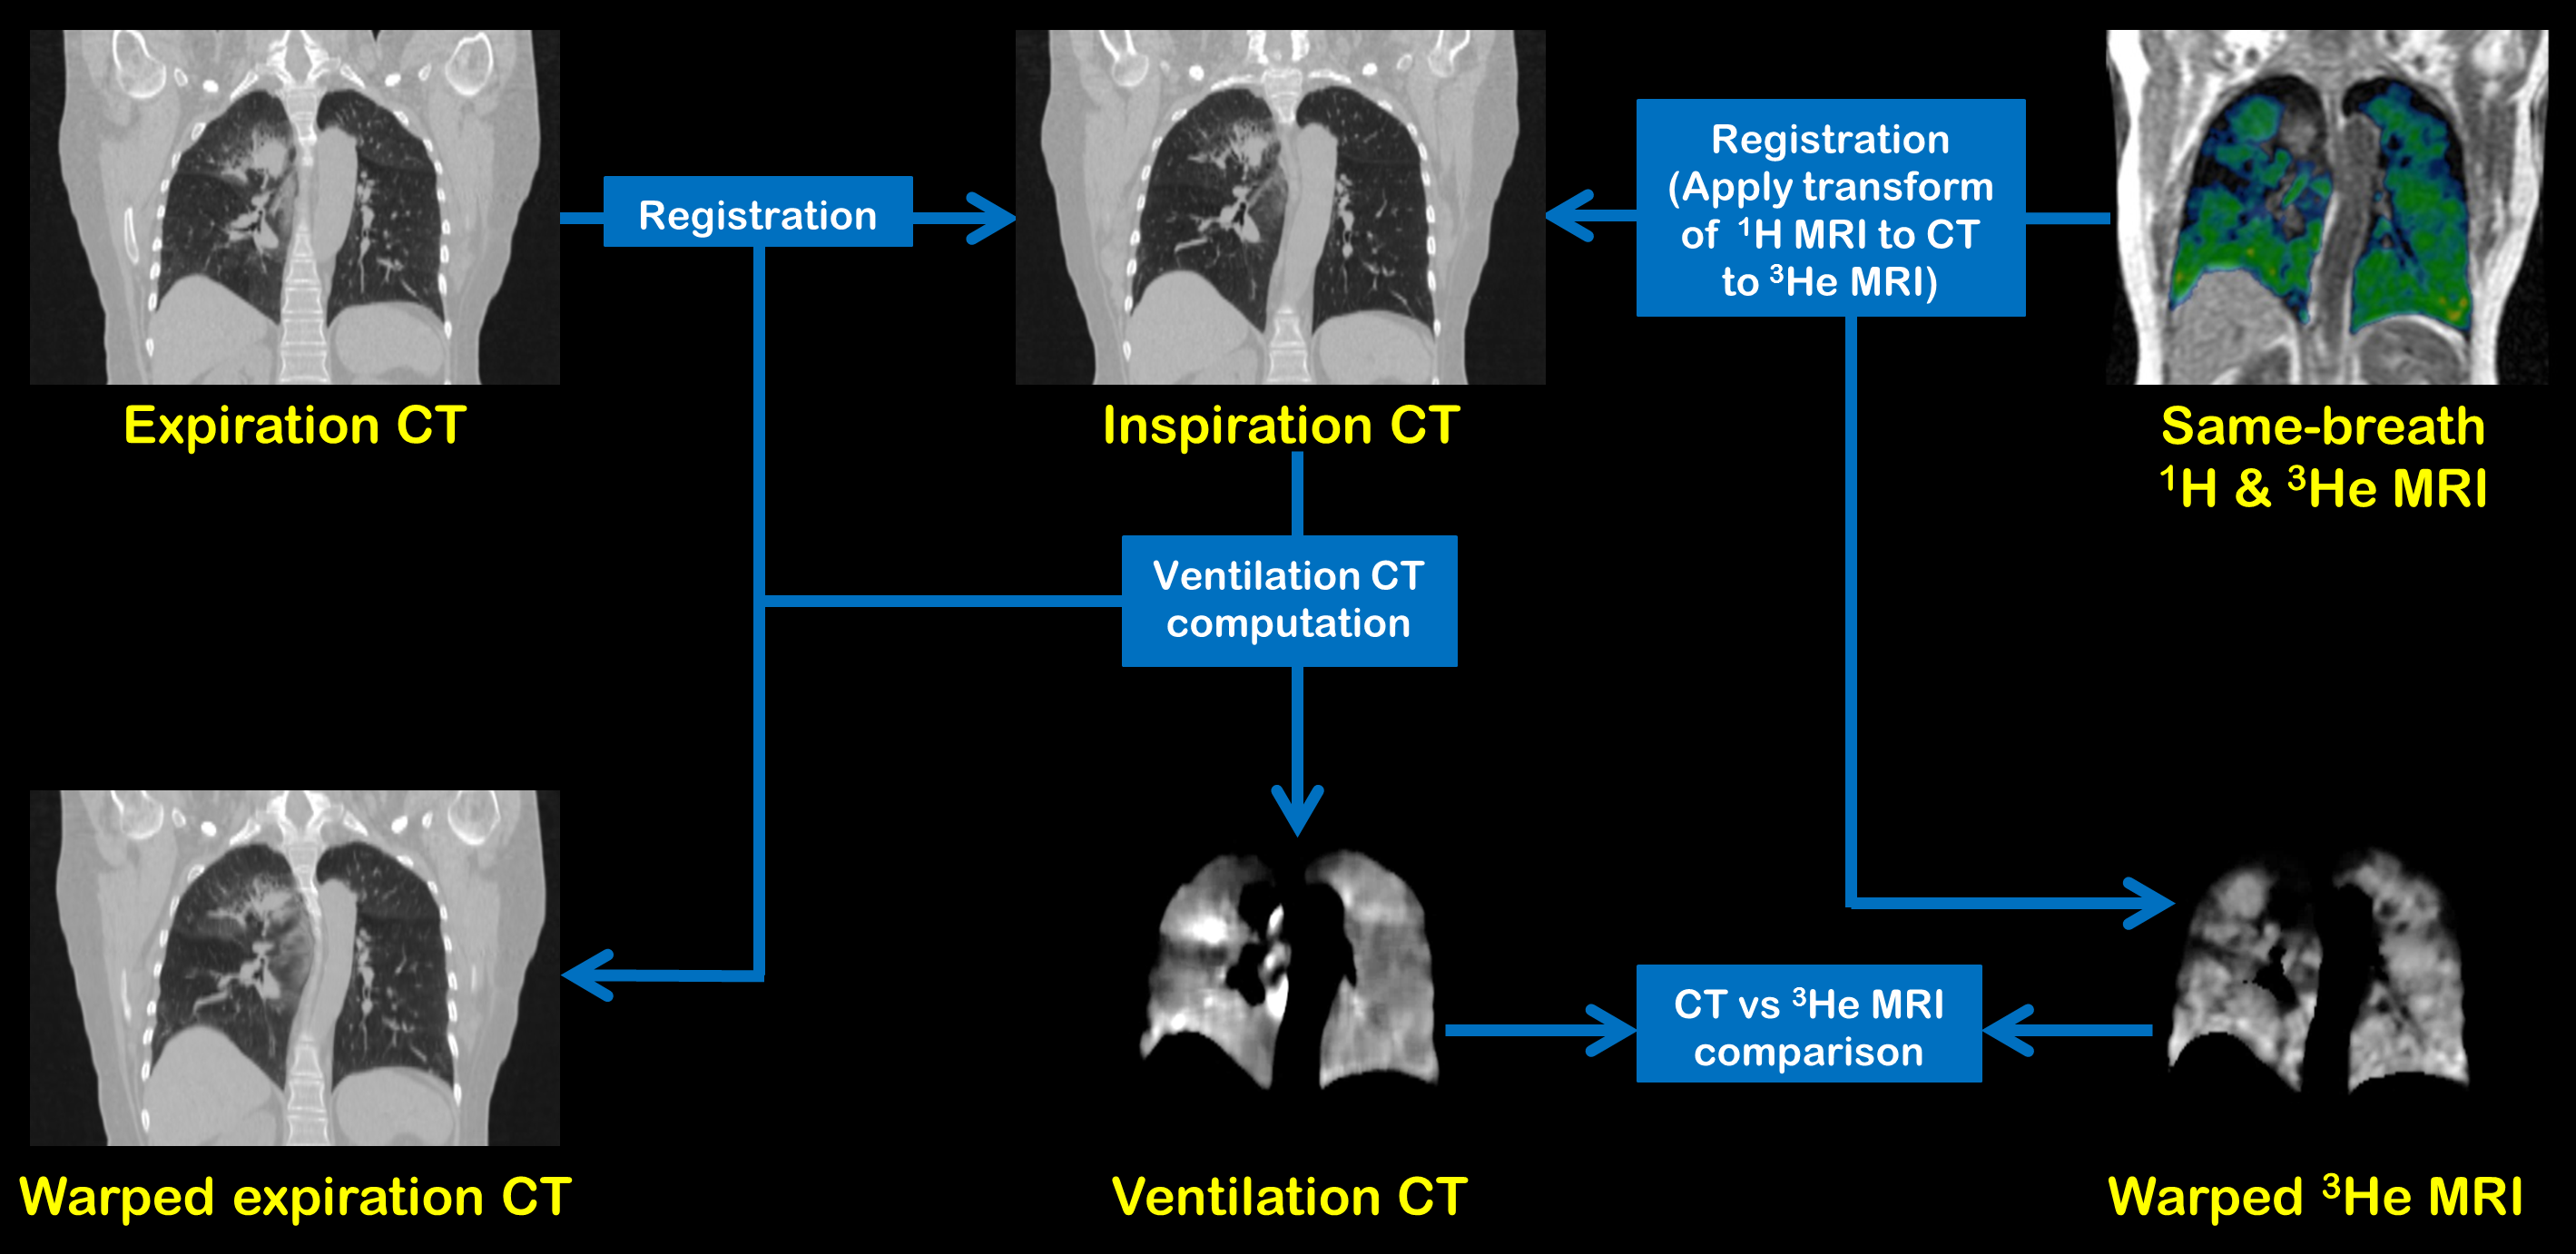
Figure 1. Workflow of proposed comparison method
of ventilation CT and HP MRI (3He and 129Xe MRI).
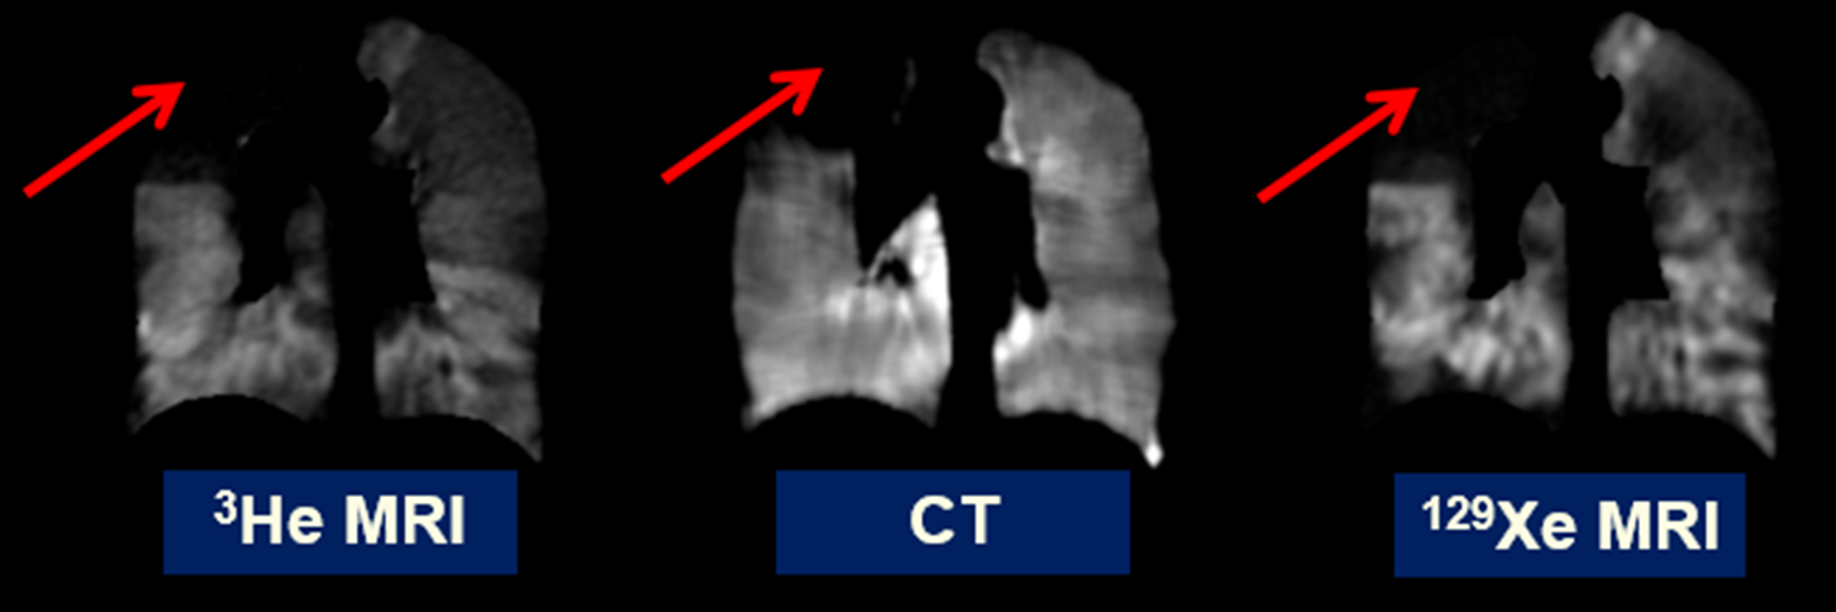
Figure 2. Coronal views of CT, 3He and 129Xe MRI
after image registration for an example patient. A similar ventilation defect
is observed in all three images in the right upper lobe with varying spatial
extent (red arrow).
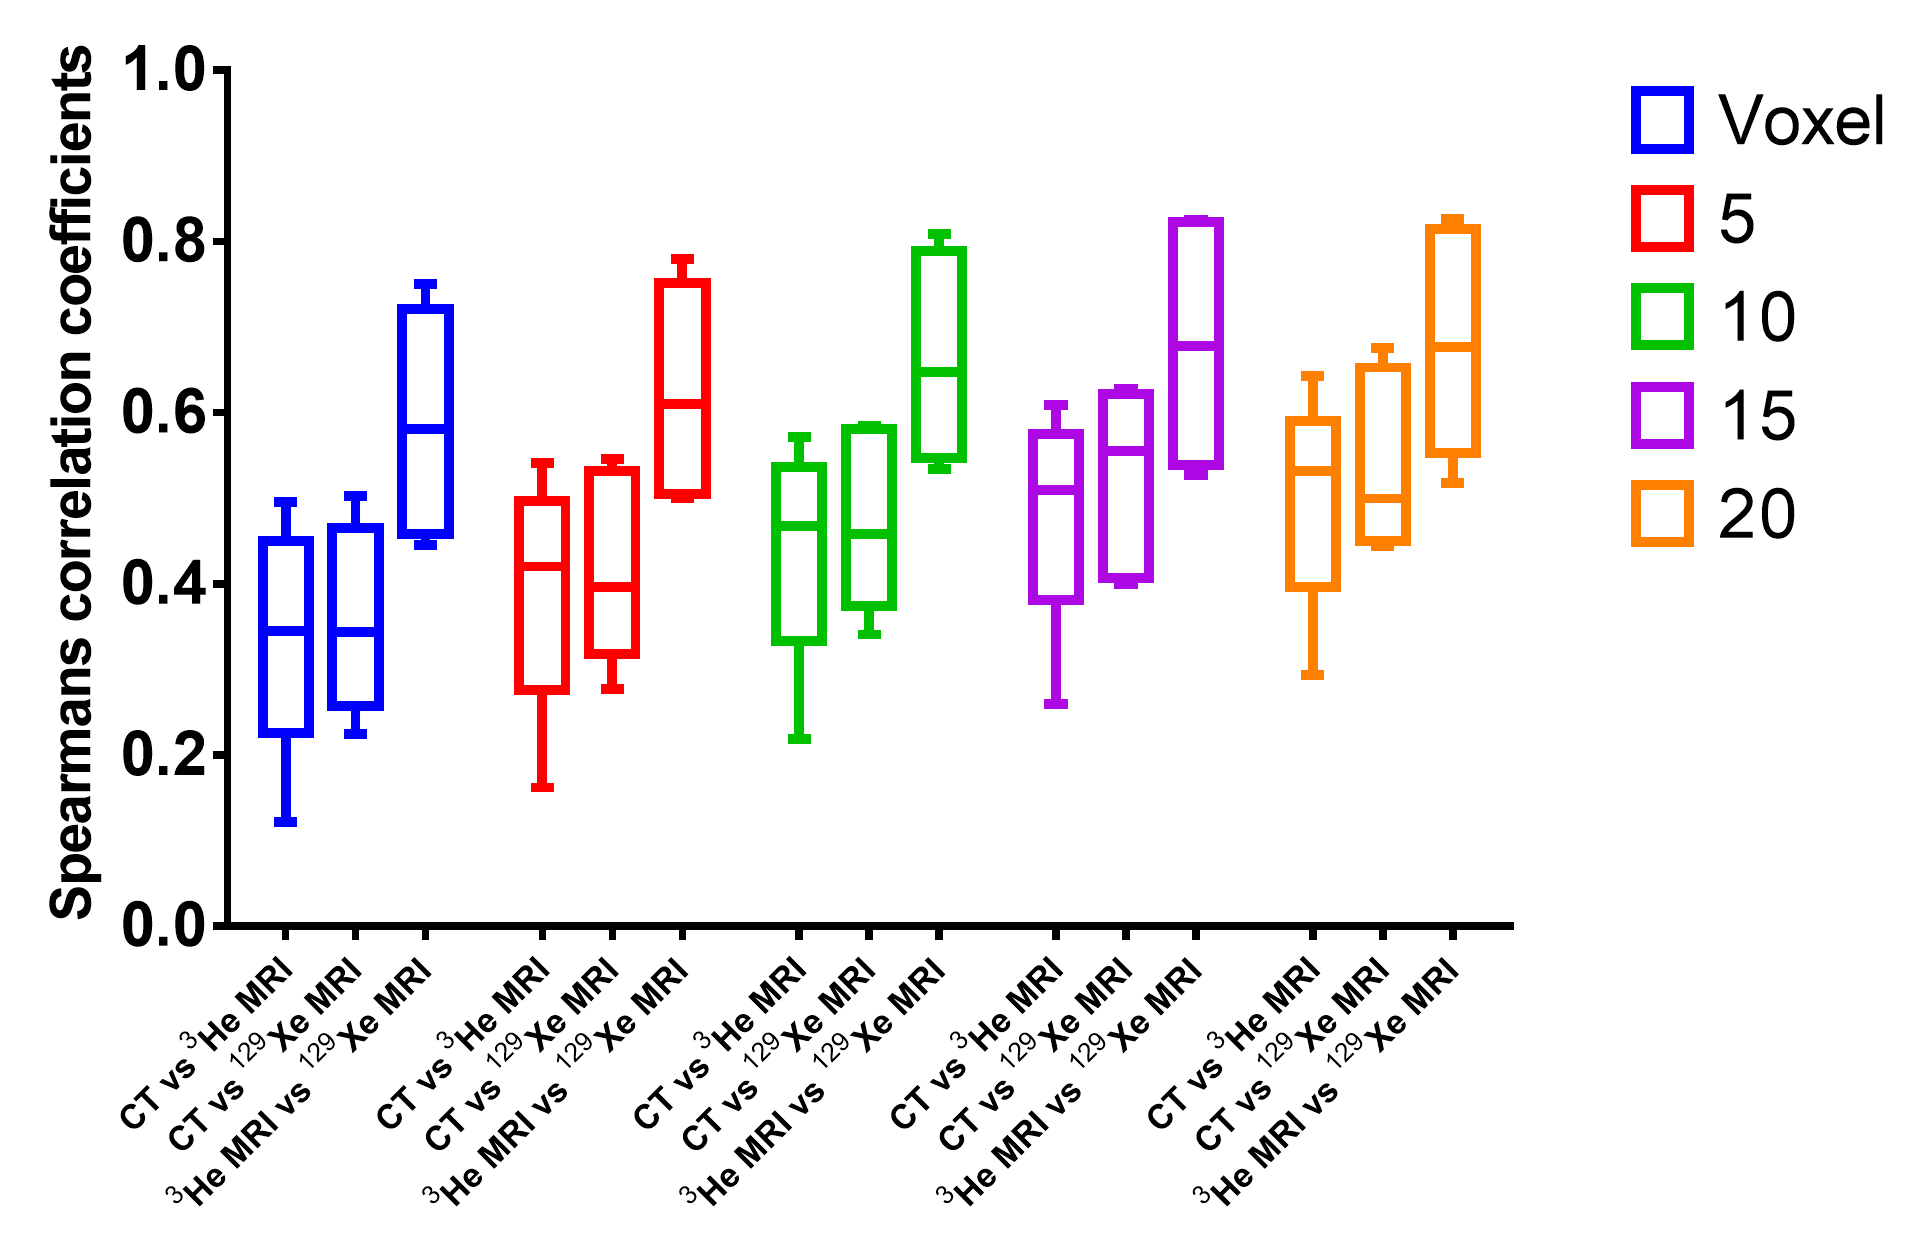
Figure 3. Box plot of Spearman correlation
coefficients for Ventilation CT and Hyperpolarised gas MRI (3He and 129Xe
MRI) at the voxel-level and for a range of ROIs. The central mark of each box
represents the median, with its edges the 25th and 75th percentiles.
The whiskers extend to the minimum and maximum values.
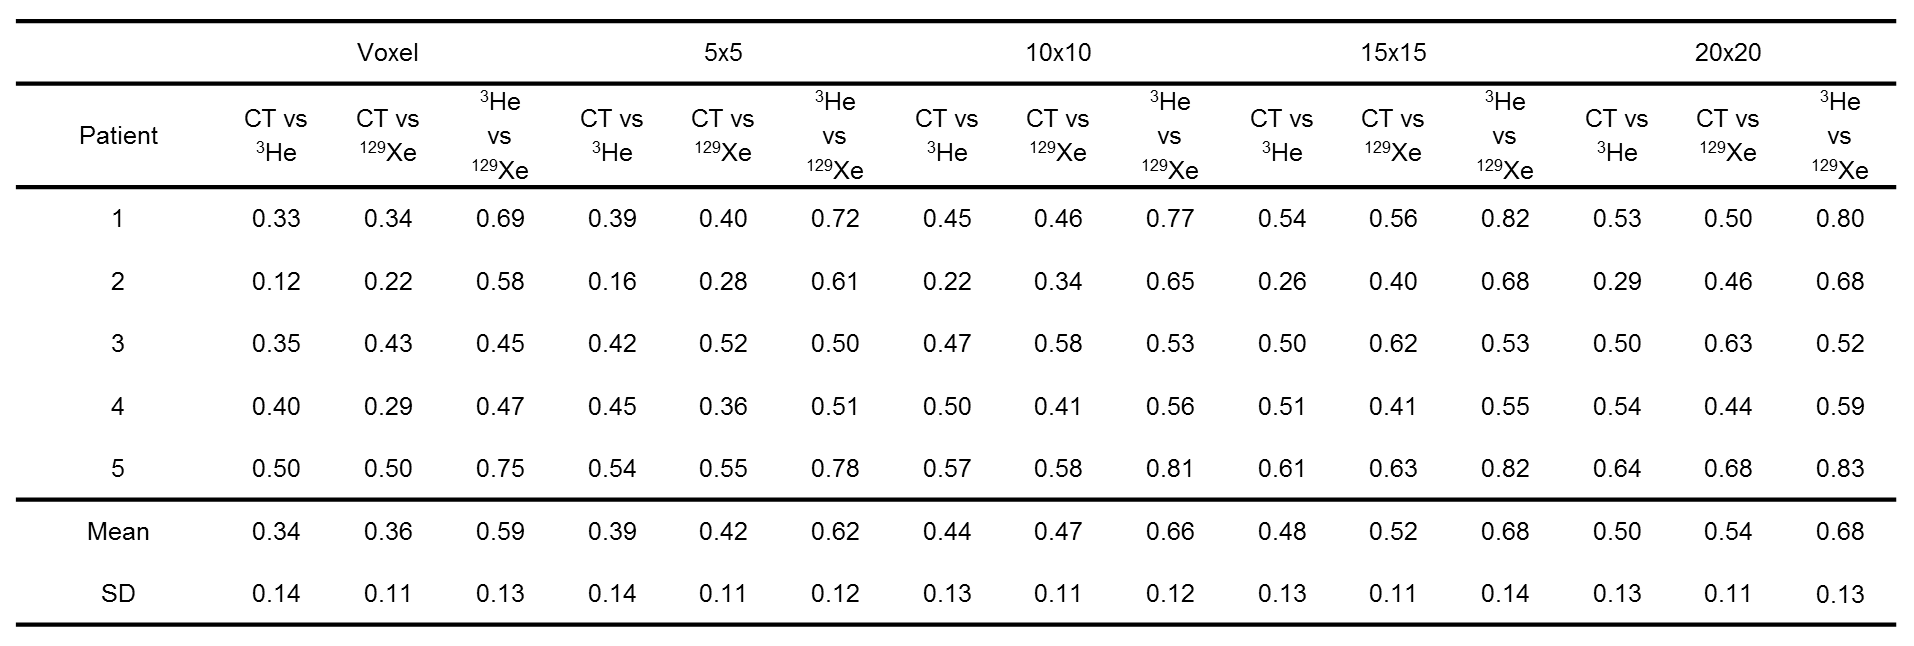
Table 1. Spearman correlation coefficients for Ventilation CT and
Hyperpolarised gas MRI (3He and 129Xe MRI) for a range of
ROIs.