3325
Quantify Pulmonary Gas-Exchange Function with Hyperpolarized 129Xe CEST MRI1Key Laboratory of Magnetic Resonance in Biological Systems, State Key Laboratory of Magnetic Resonance and Atomic and Molecular Physics, National Center for Magnetic Resonance in Wuhan, Wuhan Institute of Physics and Mathematics, Chinese Academy of Sciences, Wuhan, People's Republic of China
Synopsis
In this study, the pulmonary gas-exchange function was quantitatively evaluated globally and regionally by hyperpolarized 129Xe MRI using the method of chemical exchange saturation transfer (CEST). A new parameter, named as pulmonary gas consumption time constant (Toc), was proposed to characterize the gas exchange function. The parameter showed significant difference between the COPD and healthy rats, and we believe it will be a useful parameter in evaluating the pulmonary function.
Purpose
To quantitatively evaluate the pulmonary gas-exchange function globally and regionally by hyperpolarized 129Xe MRI using the method of chemical exchange saturation transfer (CEST).Methods
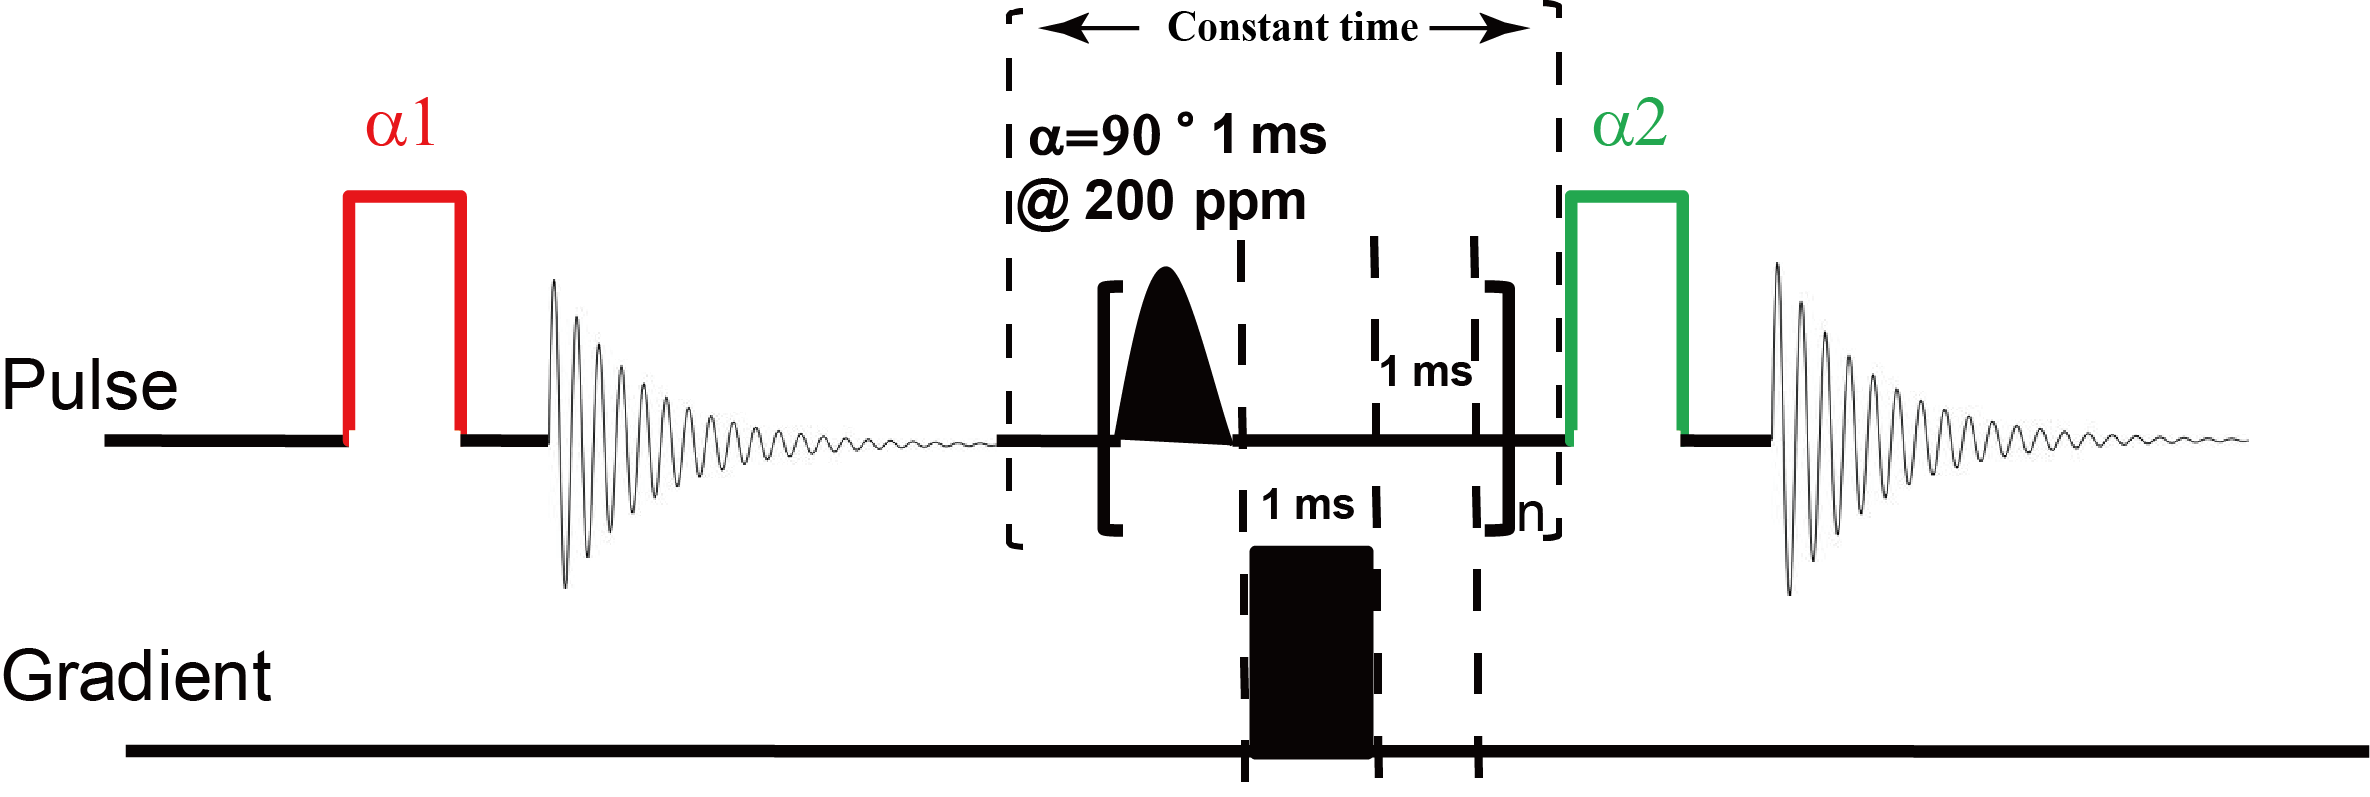
All the experiments were performed on a Bruker Biospec 4.7T MRI scanner. 129Xe gas was polarized by a homebuilt polarizer, and the available spin polarization is about 15%. 12 SD rats weighted about 250g were used, including 6 healthy and 6 tobacco-induced COPD rats. The pulse sequence for measuring dissolved xenon dynamics of lung was shown in the Fig.1. The first excitation RF pulse with flip angle of α1 (less than 10 degree) was intended to calibrate the xenon signal, and the second excitation pulse with flip angle of 90 degree was for generating xenon signal. Between the two excitation pulses, a series of saturation pulses centered at 200 ppm (relative to the gas phase) with duration of 1 ms were applied, in order to saturate dissolved xenon signal. Following each saturation pulse, a spoiler gradient pulse with duration of 1 ms was applied to destroy the residual transversal magnetism. Because of the scanner’s limitation, a delay of 1 ms was added. To achieve hyperpolarized 129Xe signal in the lung varied with the saturation time, the number of the saturation pulses varied from 50 to 1000. The interval time between the first saturation pulse and the second excitation pulse was set to a constant, which was 3000 ms in this study, to avoid the relaxation influence in different acquisition with varied saturation time. A new parameter, named as the global pulmonary gas consumption time constant (Toc) was defined to quantify the speed of gas in the alveoli diffusing into the alveolar tissue. It could be extracted by fitting the data to the function S(t)=S0*e(-t*n/Toc). Imaging experiments utilized a fast low angle shot pulse sequence (FLASH), and the sequence was shown in the Fig.2. The excitation RF pulses for the imaging sequence were centered on the gas-phase resonance. Before the data acquisition, 100 RF saturation pulses (Gauss-shaped, 1 ms duration, 90 degrees flip angle) were applied, with a 1 ms spoiler gradient pulse and a delay of 1 ms following each pulse. These saturation pulses were centered at either 200 ppm (CEST experiment) or at -200 ppm (control experiment). The pulse sequence parameters for imaging included: TR/TE, 10 ms/4 ms; flip angle, 7 degrees; FOV, 5 cm X 5 cm; matrix, 96X96; no slice selection.Result and discussion
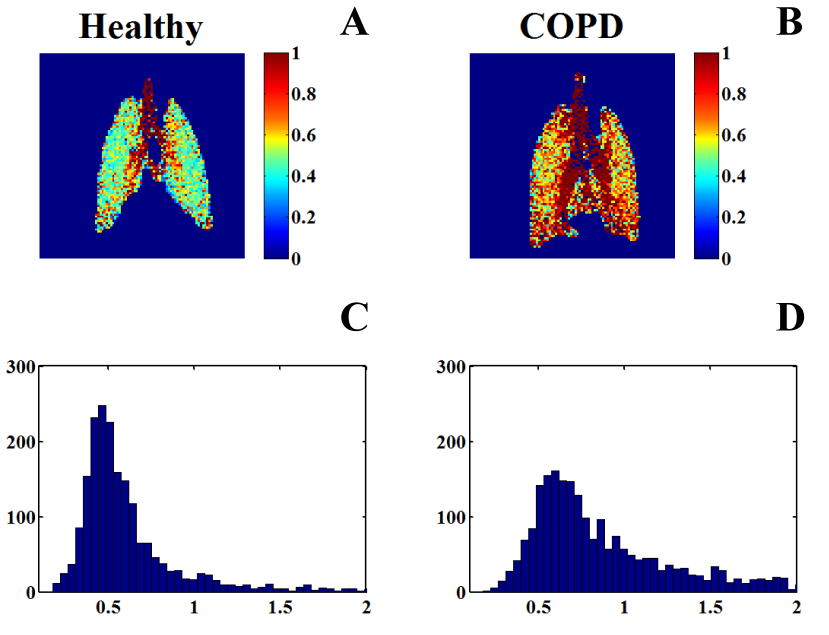
The mean consumption time constant (Toc) in COPD and healthy rats was 0.95 ± 0.16 s and 0.63 ± 0.06 s, respectively. The consumption time constant significantly increased (P = 0.004) in the COPD rats. The typical consumption time constant distribution images acquired from healthy rat and COPD rat were shown in the Fig. 3, (A) and (B) respectively. The consumption time in the trachea was obviously higher than in the tissue in both healthy and COPD rats, and this is most possible reason was that almost no gas exchange occurs in the region of the trachea. Compared with the healthy rat, the consumption time distribution increased in COPD rat lung parenchyma significantly. Furthermore, the consumption time constant distribution in COPD rat (D) shifted toward higher values compared to that in the healthy one (C). This is mostly because the smoking exposure changed the thickness and the diffusion capacity of alveolar barrier in tobacco-induced COPD rats.Conclusion
In this study, the pulmonary gas-exchange function was quantitatively evaluated globally and regionally using chemical exchange saturation transfer (CEST), and a new parameter, named as pulmonary gas consumption time constant (Toc), was proposed to characterize the gas exchange function. The parameter showed significant difference between the COPD and healthy rats, and we believe it will be a useful parameter in evaluating the pulmonary function.Acknowledgements
We acknowledge the support by the National Natural Science Foundation of China (81227902, 81625011, 81601491) and National Program for Support of Eminent Professionals (National Program for Support of Top-notch Young Professionals).References
1.Li H, Zhang Z, Zhao X, et al. Quantitative Evaluation of Radiation-Induced Lung Injury with Hyperpolarized Xenon Magnetic Resonance. Magnet Reson Med, 2016, Vol 76(2), 408-416.
2.Zhang Z, Guan Y, Li H, et al. Quantitative Comparison of Lung Physiological Parameters in Single and Multiple Breathhold with Hyperpolarized Xenon Magnetic Resonance. Biomedical Physics & Engineering Express, 2016, Vol 2(5), 055013.
Figures