3322
T2* Quantification of the Lung Using 3D Ultrashort Echo Time Cones Sequences1The University California, San Diego, San Diego, CA, United States, 22GE Healthcare, San Diego, San Diego, CA, United States, 3Radiology Service, VA San Diego Healthcare System, San Diego, CA, United States
Synopsis
Imaging of the lungs without a contrast agent is a challenging task due to the low SNR. The main challenge stems from the air in the lungs, which causes low proton density and high magnetic susceptibility at interfaces with tissue. Ultra short echo time (UTE) techniques have the potential to acquire high signal-to-noise ratio (SNR) images due to their short achievable TEs, much less than 1ms. The lung imaging based on 3D radial UTE sequences were previously reported. In this work, we applied three-dimensional UTE with Cones trajectories (3D UTE-Cones) to quantify lungs’ tissue.
Introduction
The majority of the lung tissue consists of air leading to a very low proton density (PD), which is about 1/10th of the rest of tissues in the body [1]. Air in the lung also causes strong magnetic susceptibility at interfaces with tissue, which greatly reduces the transverse relaxation time (T2 or T2*) [1]. Gas-enhanced MRI techniques are usually used to image the lungs. Ultrashort Echo Time (UTE) imaging can provide very short TEs much less than 1ms, which allows for imaging of short T2 tissues with rapid signal decay. The UTE sequences can provide reduced T2 blurring, high signal-to-noise ratio (SNR), and improved acquisition efficiency [2]. UTE techniques also have the potential to eliminate the necessity of using gas enhanced MRI to increase SNR in the lung. In recent years, UTE sequences based on 3D radial trajectory have been used to image the lung [2-4]. In this study, we report an agent-free method for imaging the lung by employing three-dimensional UTE with Cones trajectory (3D UTE-Cones) along with respiratory triggering to quantify the lung tissue in vivo at 3T.Method
The 3D UTE-Cones sequence employing a short pulse excitation followed by 3D spiral sampling with conical view ordering was implemented on a 3T GE HDxt scanner. The sequence has a minimal TE of 32 µs and allows anisotropic field of view and spatial resolution for fast volumetric imaging of the lung. Three healthy male volunteers (33 ± 2.1 years, mean age ± standard deviation) were scanned by using the GE torso phased-array coil. Respiratory triggering was also used along with 3D UTE-Cones data acquisitions. The following scan parameters were used: TR = 10ms, five TEs (0.032, 0.2, 0.4, and 0.8, 2.2ms), BW = 250 kHz, FOV = 480 x480mm2, slice thickness = 10mm, 10 slices, matrix size= 128×128, flip angle = 9°, acquired voxel size = 3.75×3.75×10mm3, and scan time = 27 seconds for each dataset. T2* was quantified with a single-component decay fitting of 3D UTE-Cones images.Results
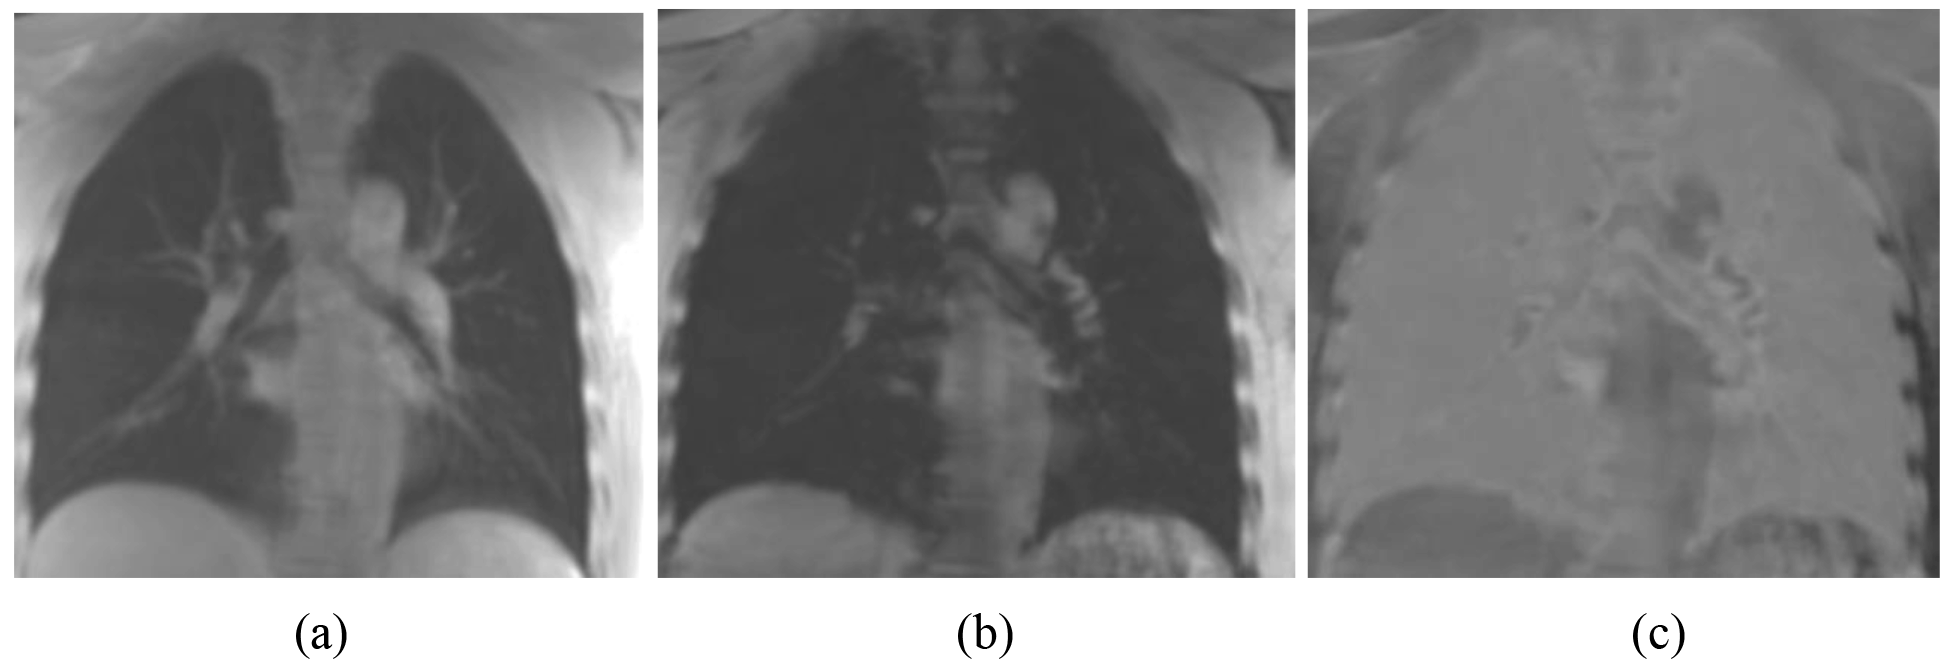
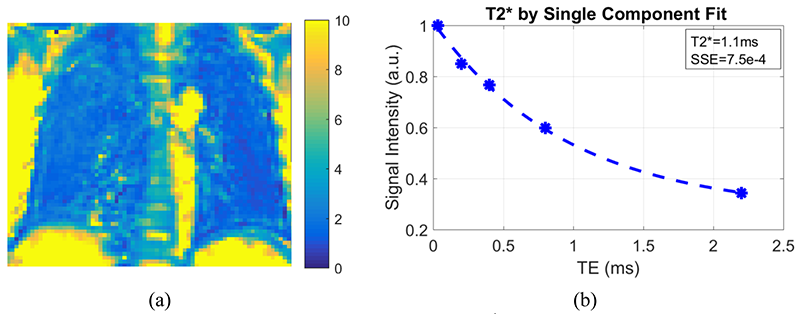
Figure 1 shows a representative slice of the lungs of a 31-year-old healthy man, imaged with the 3D UTE-Cones sequence. In Figure 1, the images at short TE (TE=0.032ms), long TE (TE=4.4ms), and the subtraction image (TE=0.032ms-TE=4.4ms) are shown. The lung tissue is depicted with good image contrast in the subtracted image. T2* mapping was performed as shown in Figure 2. High contrast was achieved for the lung with T2* typically less than 4 ms. A representative ROI was drawn in the lung, and single-component curve fitting was conducted for T2* analysis. Excellent single component decay was observed, demonstrating a short T2* of 0.96 ms for lung parenchyma. The T2* values for the lung tissue in the ROI for the three healthy volunteers were 1.15 ± 0.68, 1.13 ± 0.60, and 1.18 ± 0.43ms, respectively.Discussion and Conclusion
Preliminary results from this study show that T2* can be reliably estimated via single-component fitting of 3D UTE-Cones acquisitions with a series of TEs. Further optimization of the imaging protocol, including in-plane resolution, slice thickness and scan time will be performed in future studies. The 3D UTE-Cones sequence can potentially evaluate the lung tissue. This technique may provide more comprehensive evaluation of lung quality, and thus more accurate prediction of lung diseases.Acknowledgements
The authors acknowledge grant funding from the VA Clinical Science R&D Service (Merit Award I01CX001388) and the NIH (1R01 AR062581-01A1, 1 R01 AR068987-01).References
[1] Wild J, Marshall H, Bock M, Schad L, Jakob P, Puderbach M, Molinari F, Van Beek E, Biederer J. MRI of the lung (1/3): methods. Insights Imaging 2012; 3: 345–353.
[2] Johnson, K. M., Fain, S. B., Schiebler, M. L. and Nagle, S., Optimized 3D ultrashort echo time pulmonary MRI. Magn. Reson. Med. 2013; 70: 1241–1250.
[3] Leung D.A., McKinnon G.C., Davis C.P., Pfammatter T., Krestin G.P., Debatin J.F., Breath-hold, contrast-enhanced, three-dimensional MR angiography. Radiology1996; 200(2):569–571
[4] Gai, N. D., Malayeri, A., Agarwal, H., Evers, R. and Bluemke, D., Evaluation of optimized breath-hold and free-breathing 3D ultrashort echo time contrast agent-free MRI of the human lung. J. Magn. Reson. Imaging 2016, 43: 1230–1238.
Figures