3318
Steady-state Free Precession for Improved Signal to Noise in Lung Ventilation Imaging with 19F Perfluoropropane at 1.5 T1Unit of Academic Radiology, University of Sheffield, Sheffield, United Kingdom, 2GE Healthcare Inc., Aurora, OH, United States
Synopsis
Fluorinated gas MRI is a promising method for pulmonary ventilation imaging that does not require additional polarization equipment. To date, short echo time spoiled gradient echo sequences with long repetition times relative to T1 have been employed for lung ventilation imaging in humans. Here, we present an optimization of steady state free precession sequences for imaging of C3F8 gas in lungs, and demonstrate that image signal-to-noise ratio may be improved by exploiting the short T1, and relatively long T2.
Background
MRI with inhaled inert gases has a proven sensitivity for assessment of lung ventilation and diagnosis and monitoring of obstructive airways disease. Efforts to improve the image quality achievable using fluorinated gases (such as SF6, C2F6 and C3F8) to rival those of hyperpolarized gases (129Xe or 3He) have been ongoing1. However, previous strategies have focused on the use of low TE spoiled gradient echo sequences with relatively high TR2, because of the constraints imposed by the relatively short T2* of fluorinated gases in the lungs, and also by SAR at 3T. Perfluoropropane (PFP) when mixed with 21% O2 has a T2 comparable to T1 (~16ms3) and >>T2* (~3ms), hence we hypothesize that improved signal to noise (SNR) may be achieved with the use of steady state free precession (SSFP) sequences, since the magnetization recovers rapidly with short T1 and the decay of transverse magnetization is limited to T2.Purpose
In this study we demonstrate the potential of SSFP sequences to improve 19F lung ventilation imaging with PFP gas. Simulations of the achievable SSFP signal were performed and compared with using a spoiled gradient echo (SPGR) acquisition with similar imaging parameters. Experiments were performed in PFP phantoms over a range of flip angles (FA) and in-vivo with optimized FAs, in order to validate the theoretical predictions.Methods
Simulations: PFP steady state transverse magnetization was simulated for SSFP4 and for SPGR5 sequences. Values of T1 and T2 of PFP gas mixed with 21% O2 were taken to be 16ms3. The value of T2* in the PFP phantom was 3.4ms from previous experimental measurements. T2 of PFP likely reduces in a similar manner to T1, as molecular collisions are the predominant relaxation mechanism3,6. Global specific absorption rate (SAR) was calculated conservatively as the input power to the coil being completely deposited into a 70kg patient, while local SAR was approximated as 15 times higher than global SAR, a ratio similar to that presented for transceive arrays7.
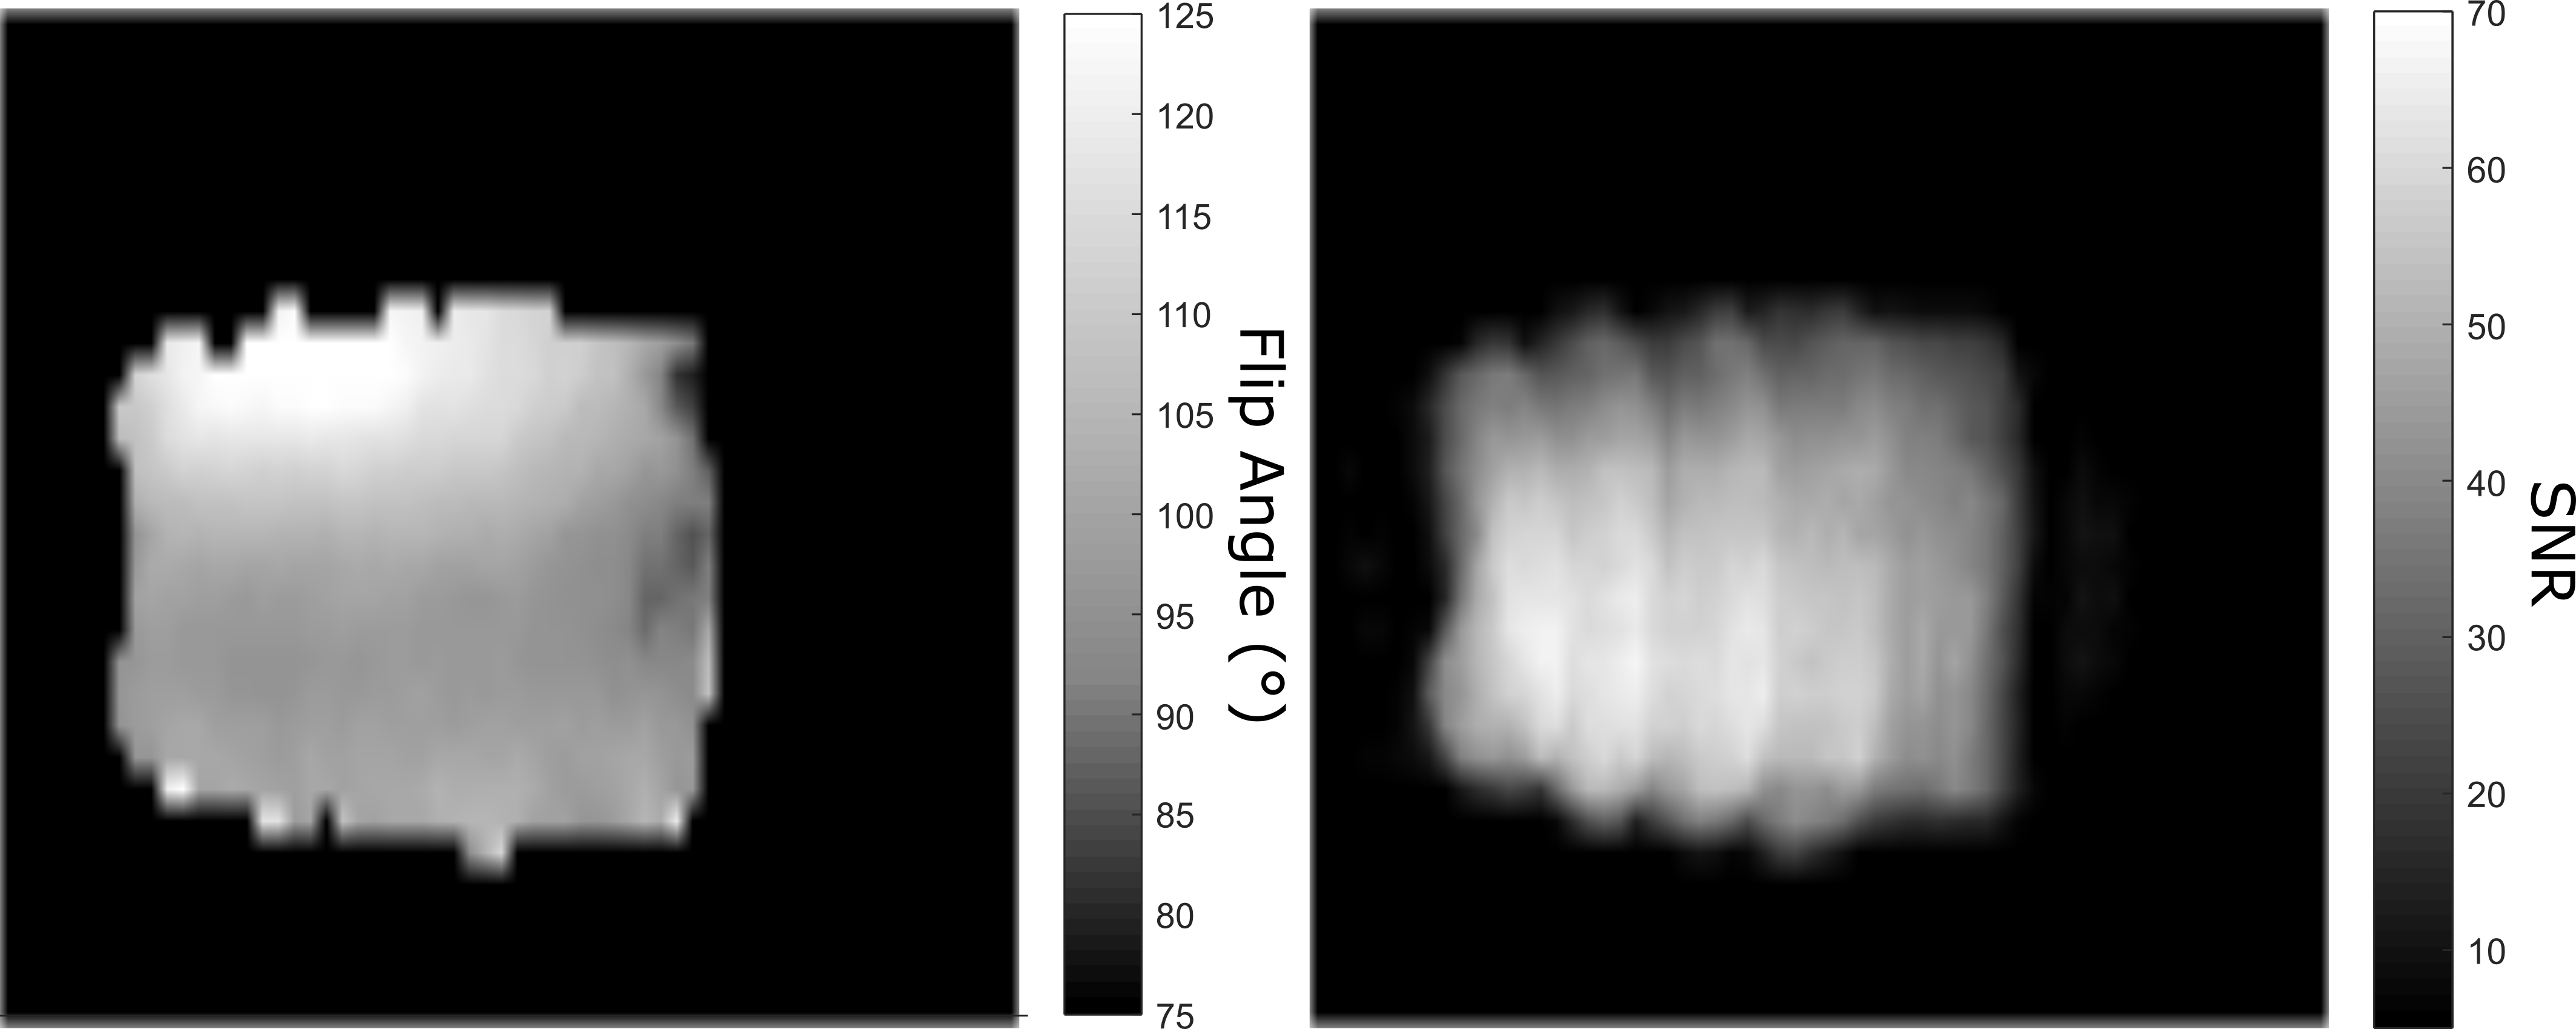
Experiments: An in-house 4-element fixed phase/amplitude vest transceiver coil8 was used for imaging of 19F nuclei on a 1.5T GE Signa HDx scanner. The phantom consisted of an outer container (30ℓ) filled with 3.6g/ℓ NaCl and 1.96g/ℓ CuSO4⋅5H2O solution and inner container (8ℓ) filled with C3F8 gas. FA maps in Figure 1 were calculated by fitting signal according to a sinusoidal relation with increasing input power using a gradient echo sequence. SPGR and SSFP sequence performance was evaluated using 3D sequences with the following parameters: matrix=64×32×24, bandwidth=20kHz, FOV=40cm, slice thickness=10mm and 16 averages. For SPGR; hard pulse width (PW)=312µs, TR=2.4ms and TE=0.7ms, while for SSFP; PW=608µs, TR=3ms and TE=1.1ms. For in-vivo comparison of the two sequences, 6 averages were acquired for a 14s breath-hold and 60° FA was used for SSFP. The SPGR sequence was modified for a similar breath-hold time and near SNR-optimal FA (TR=2.8ms, TE=1ms and PW=258µs, FA=25°).
Results
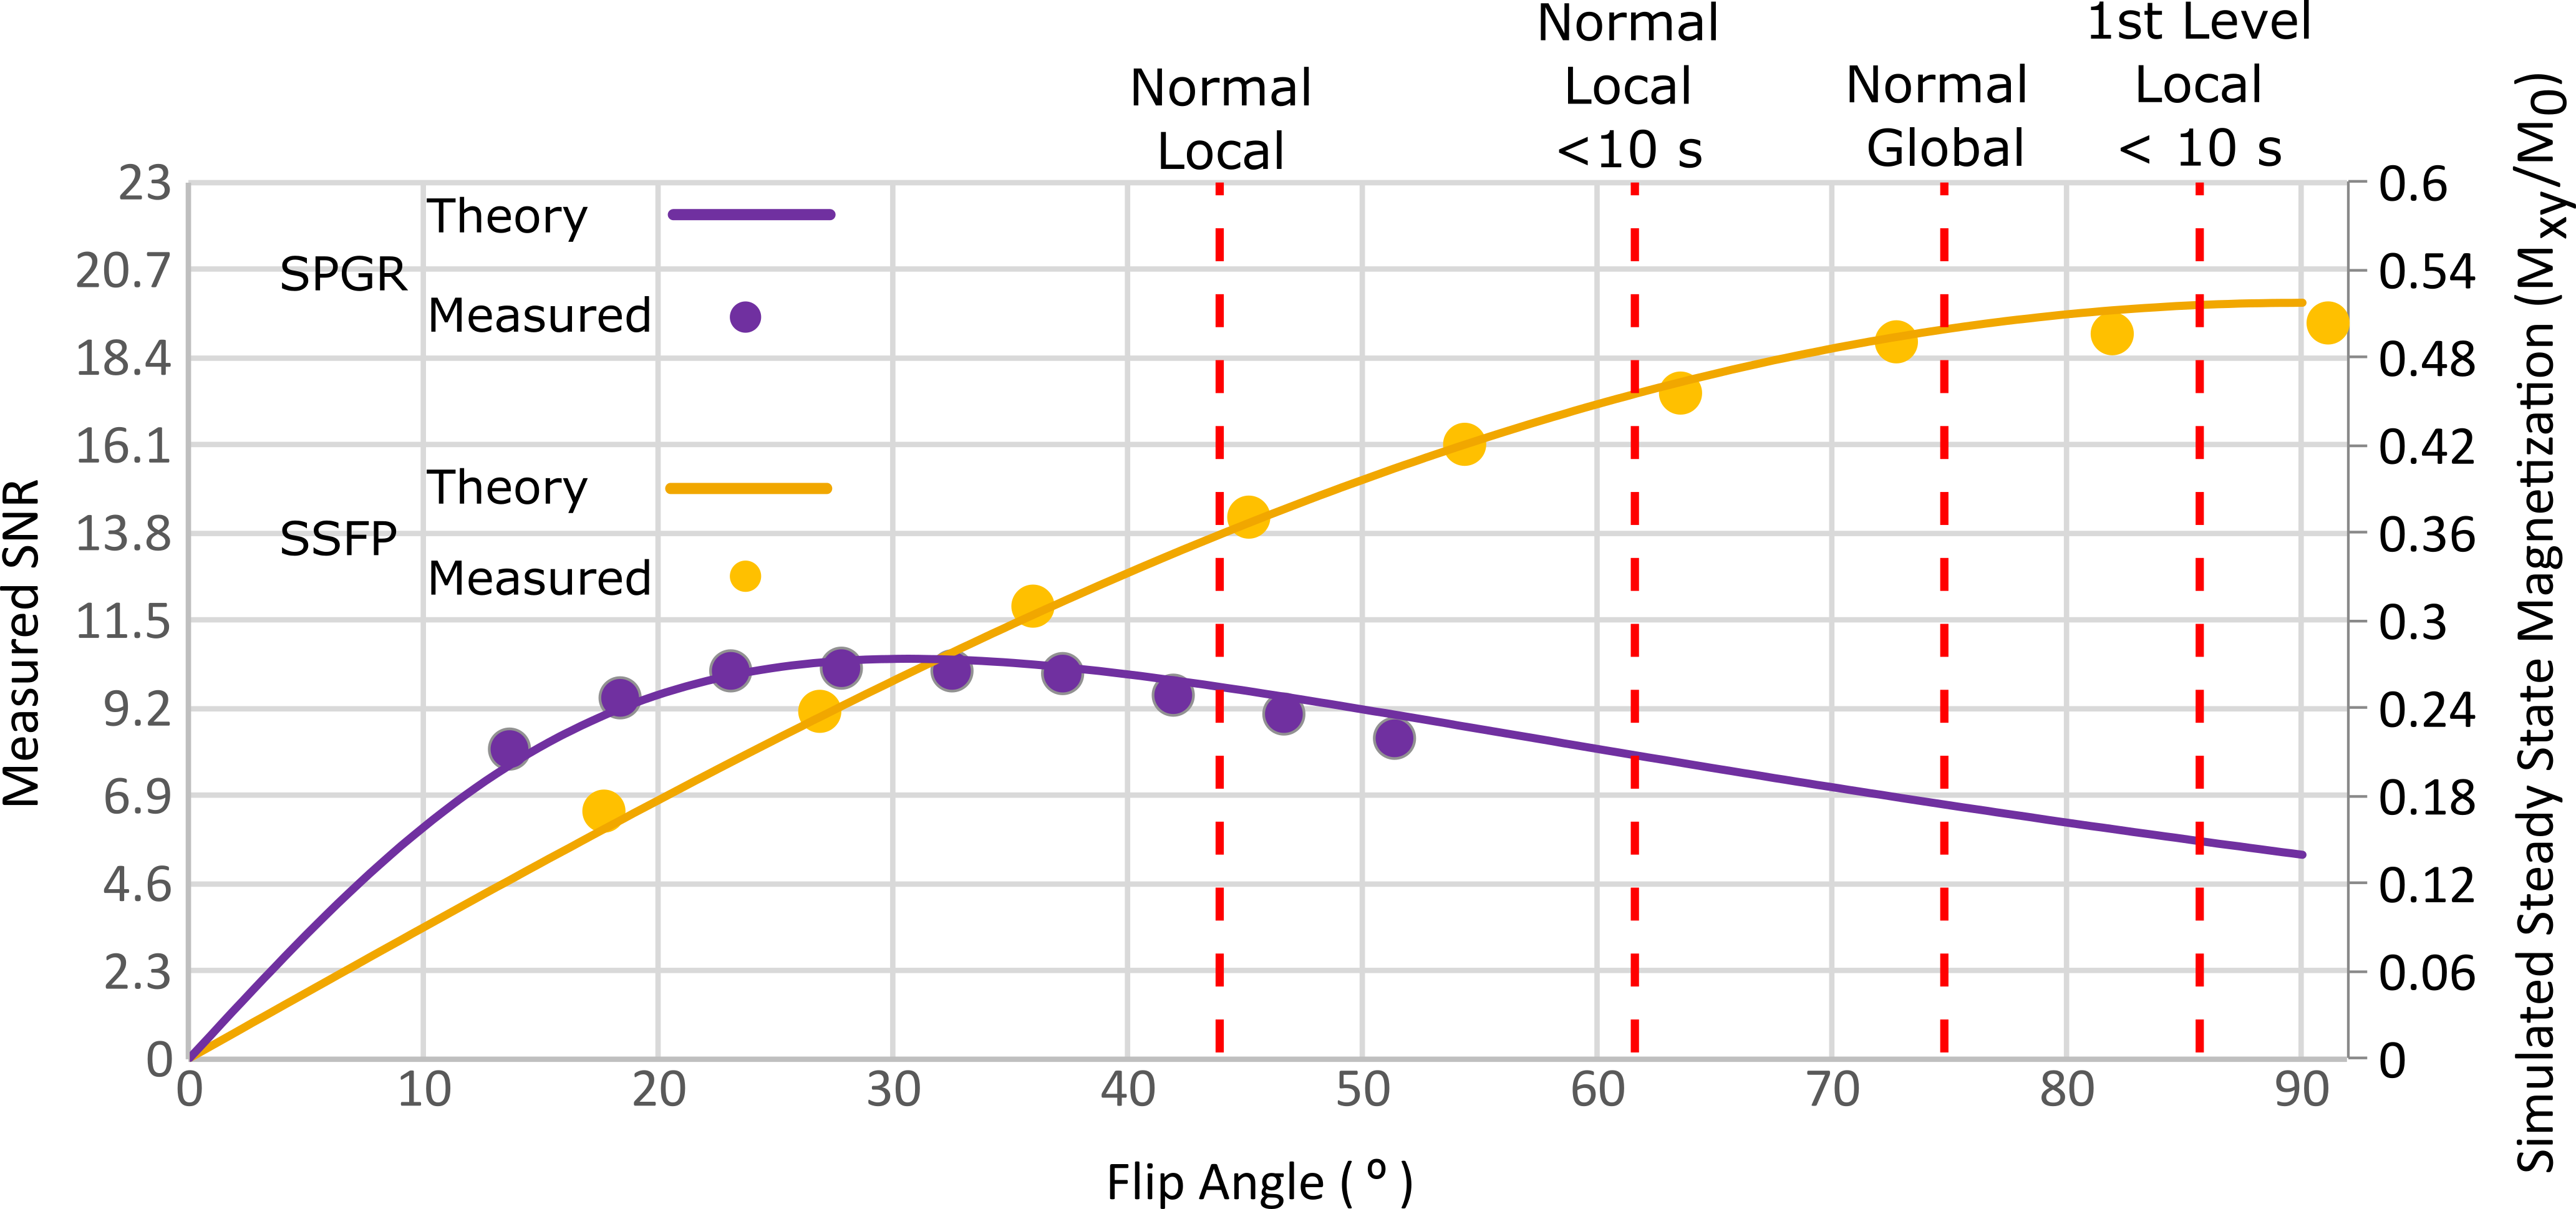
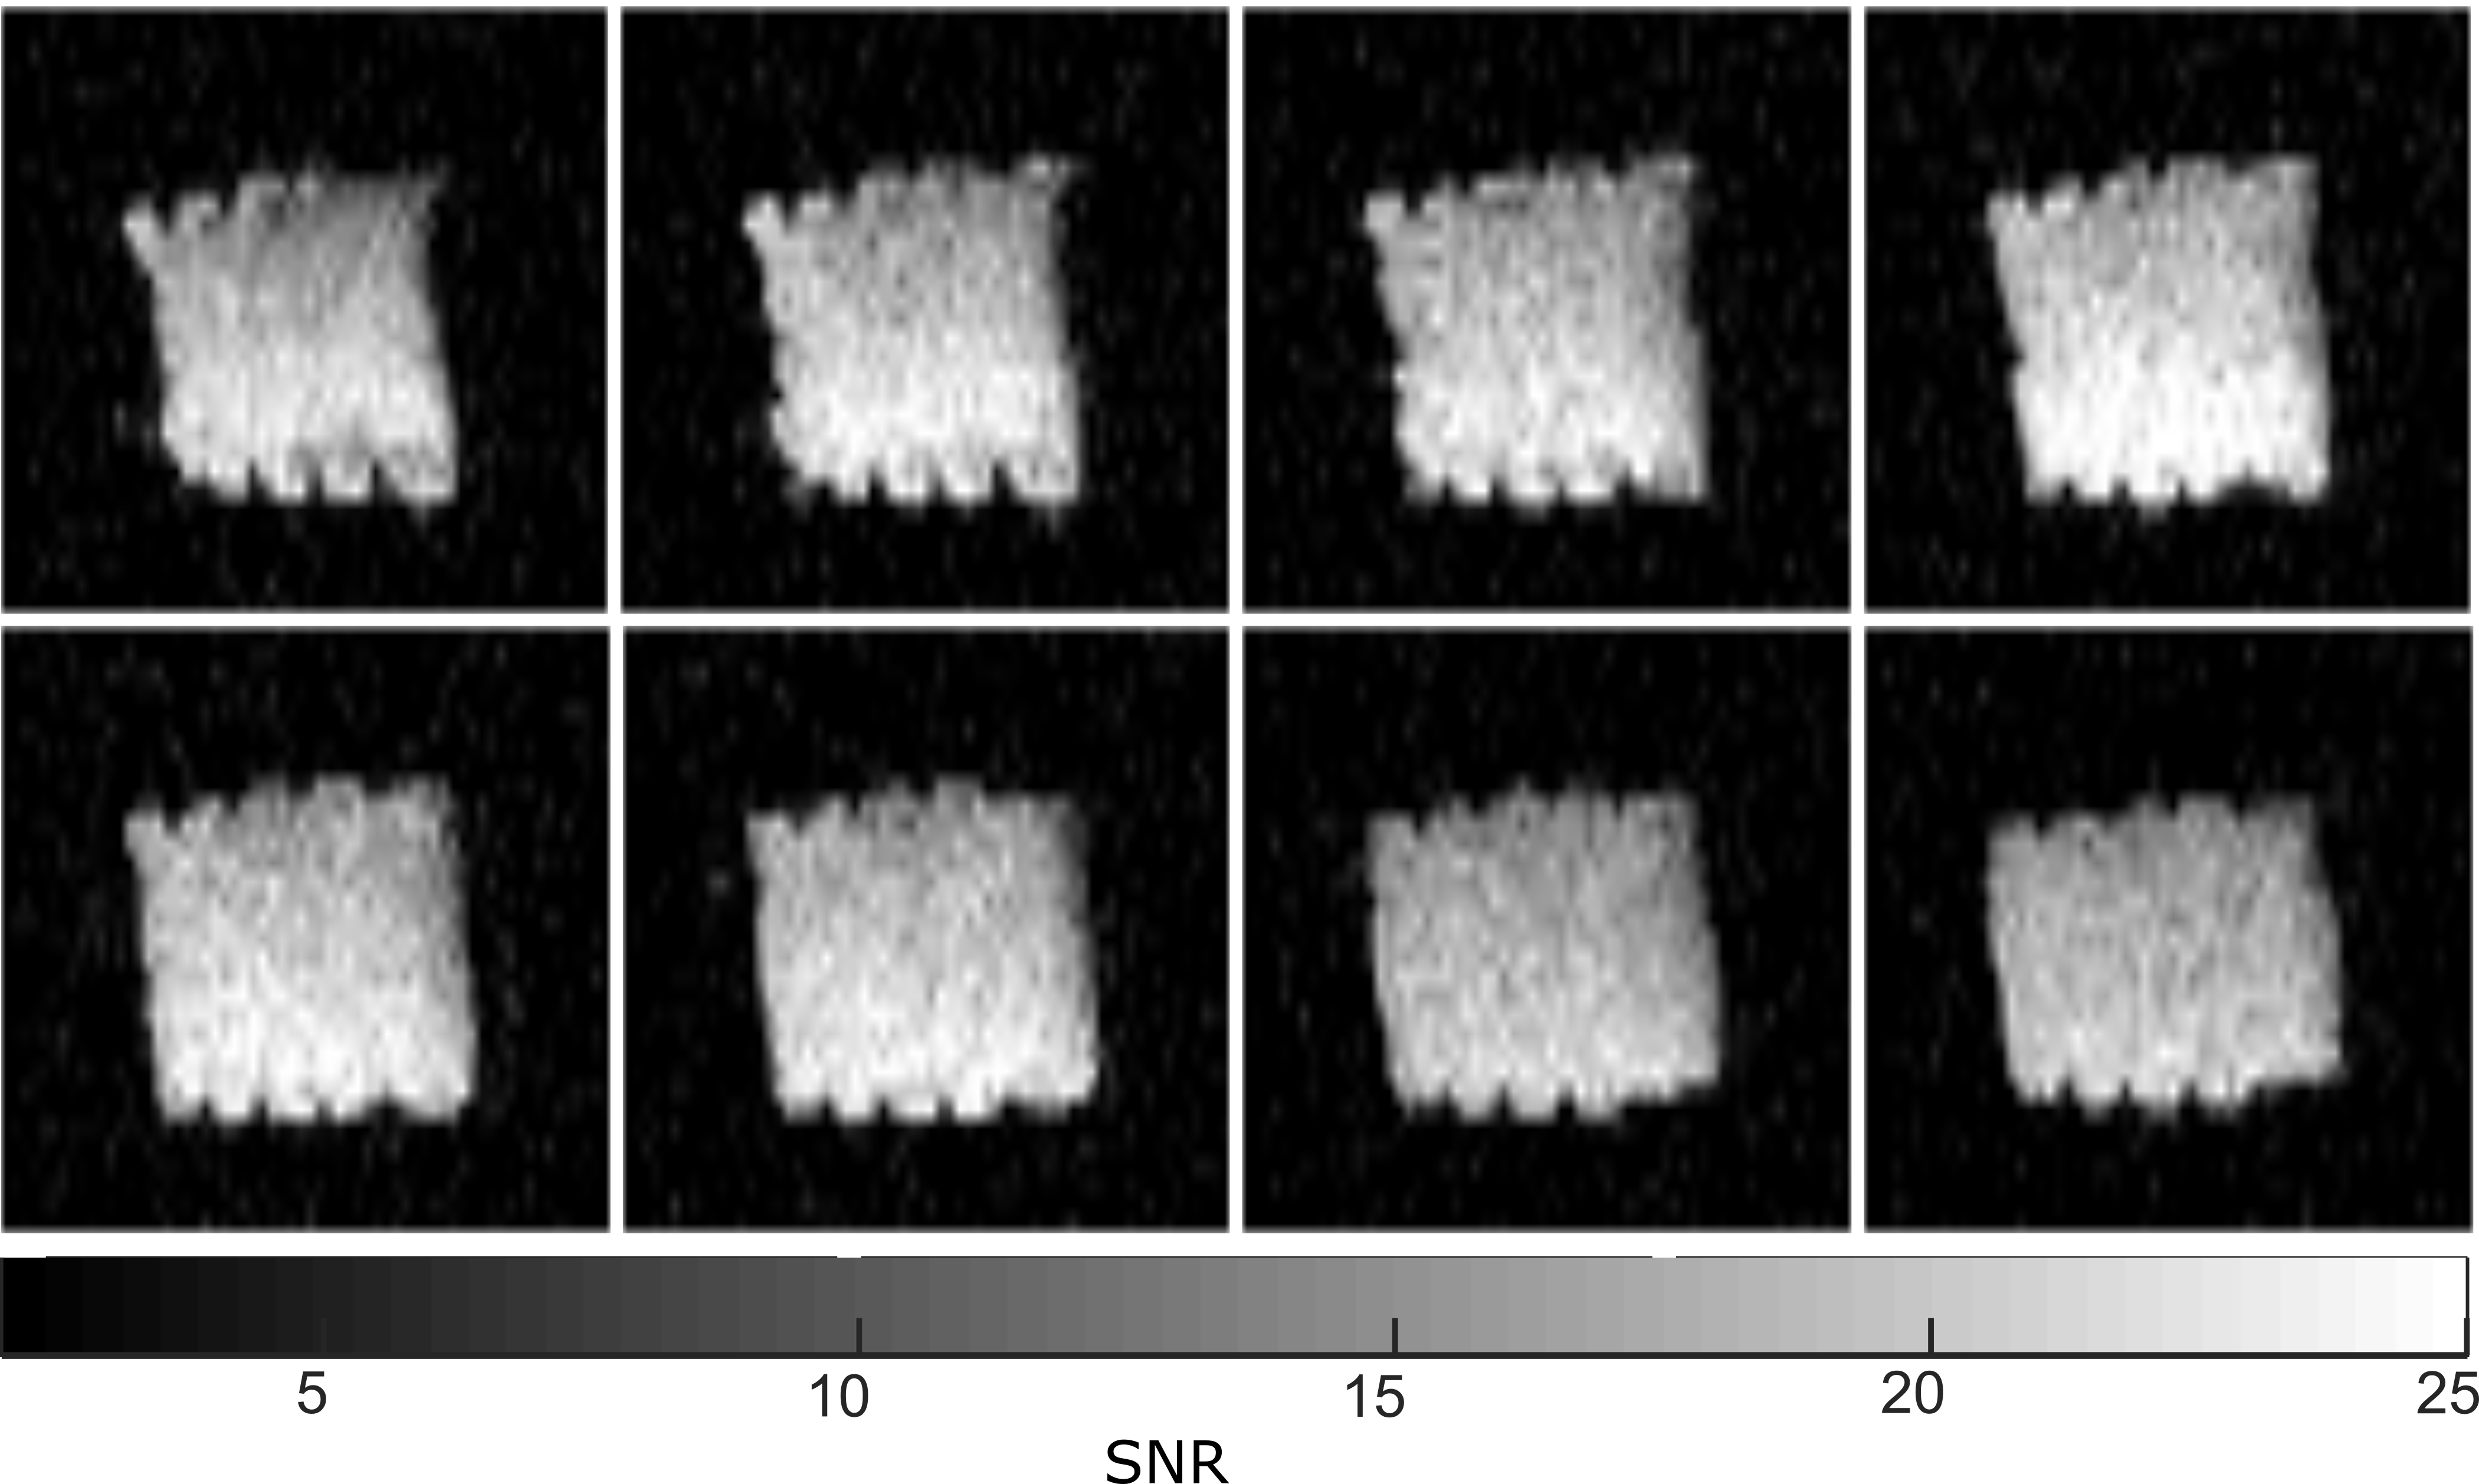
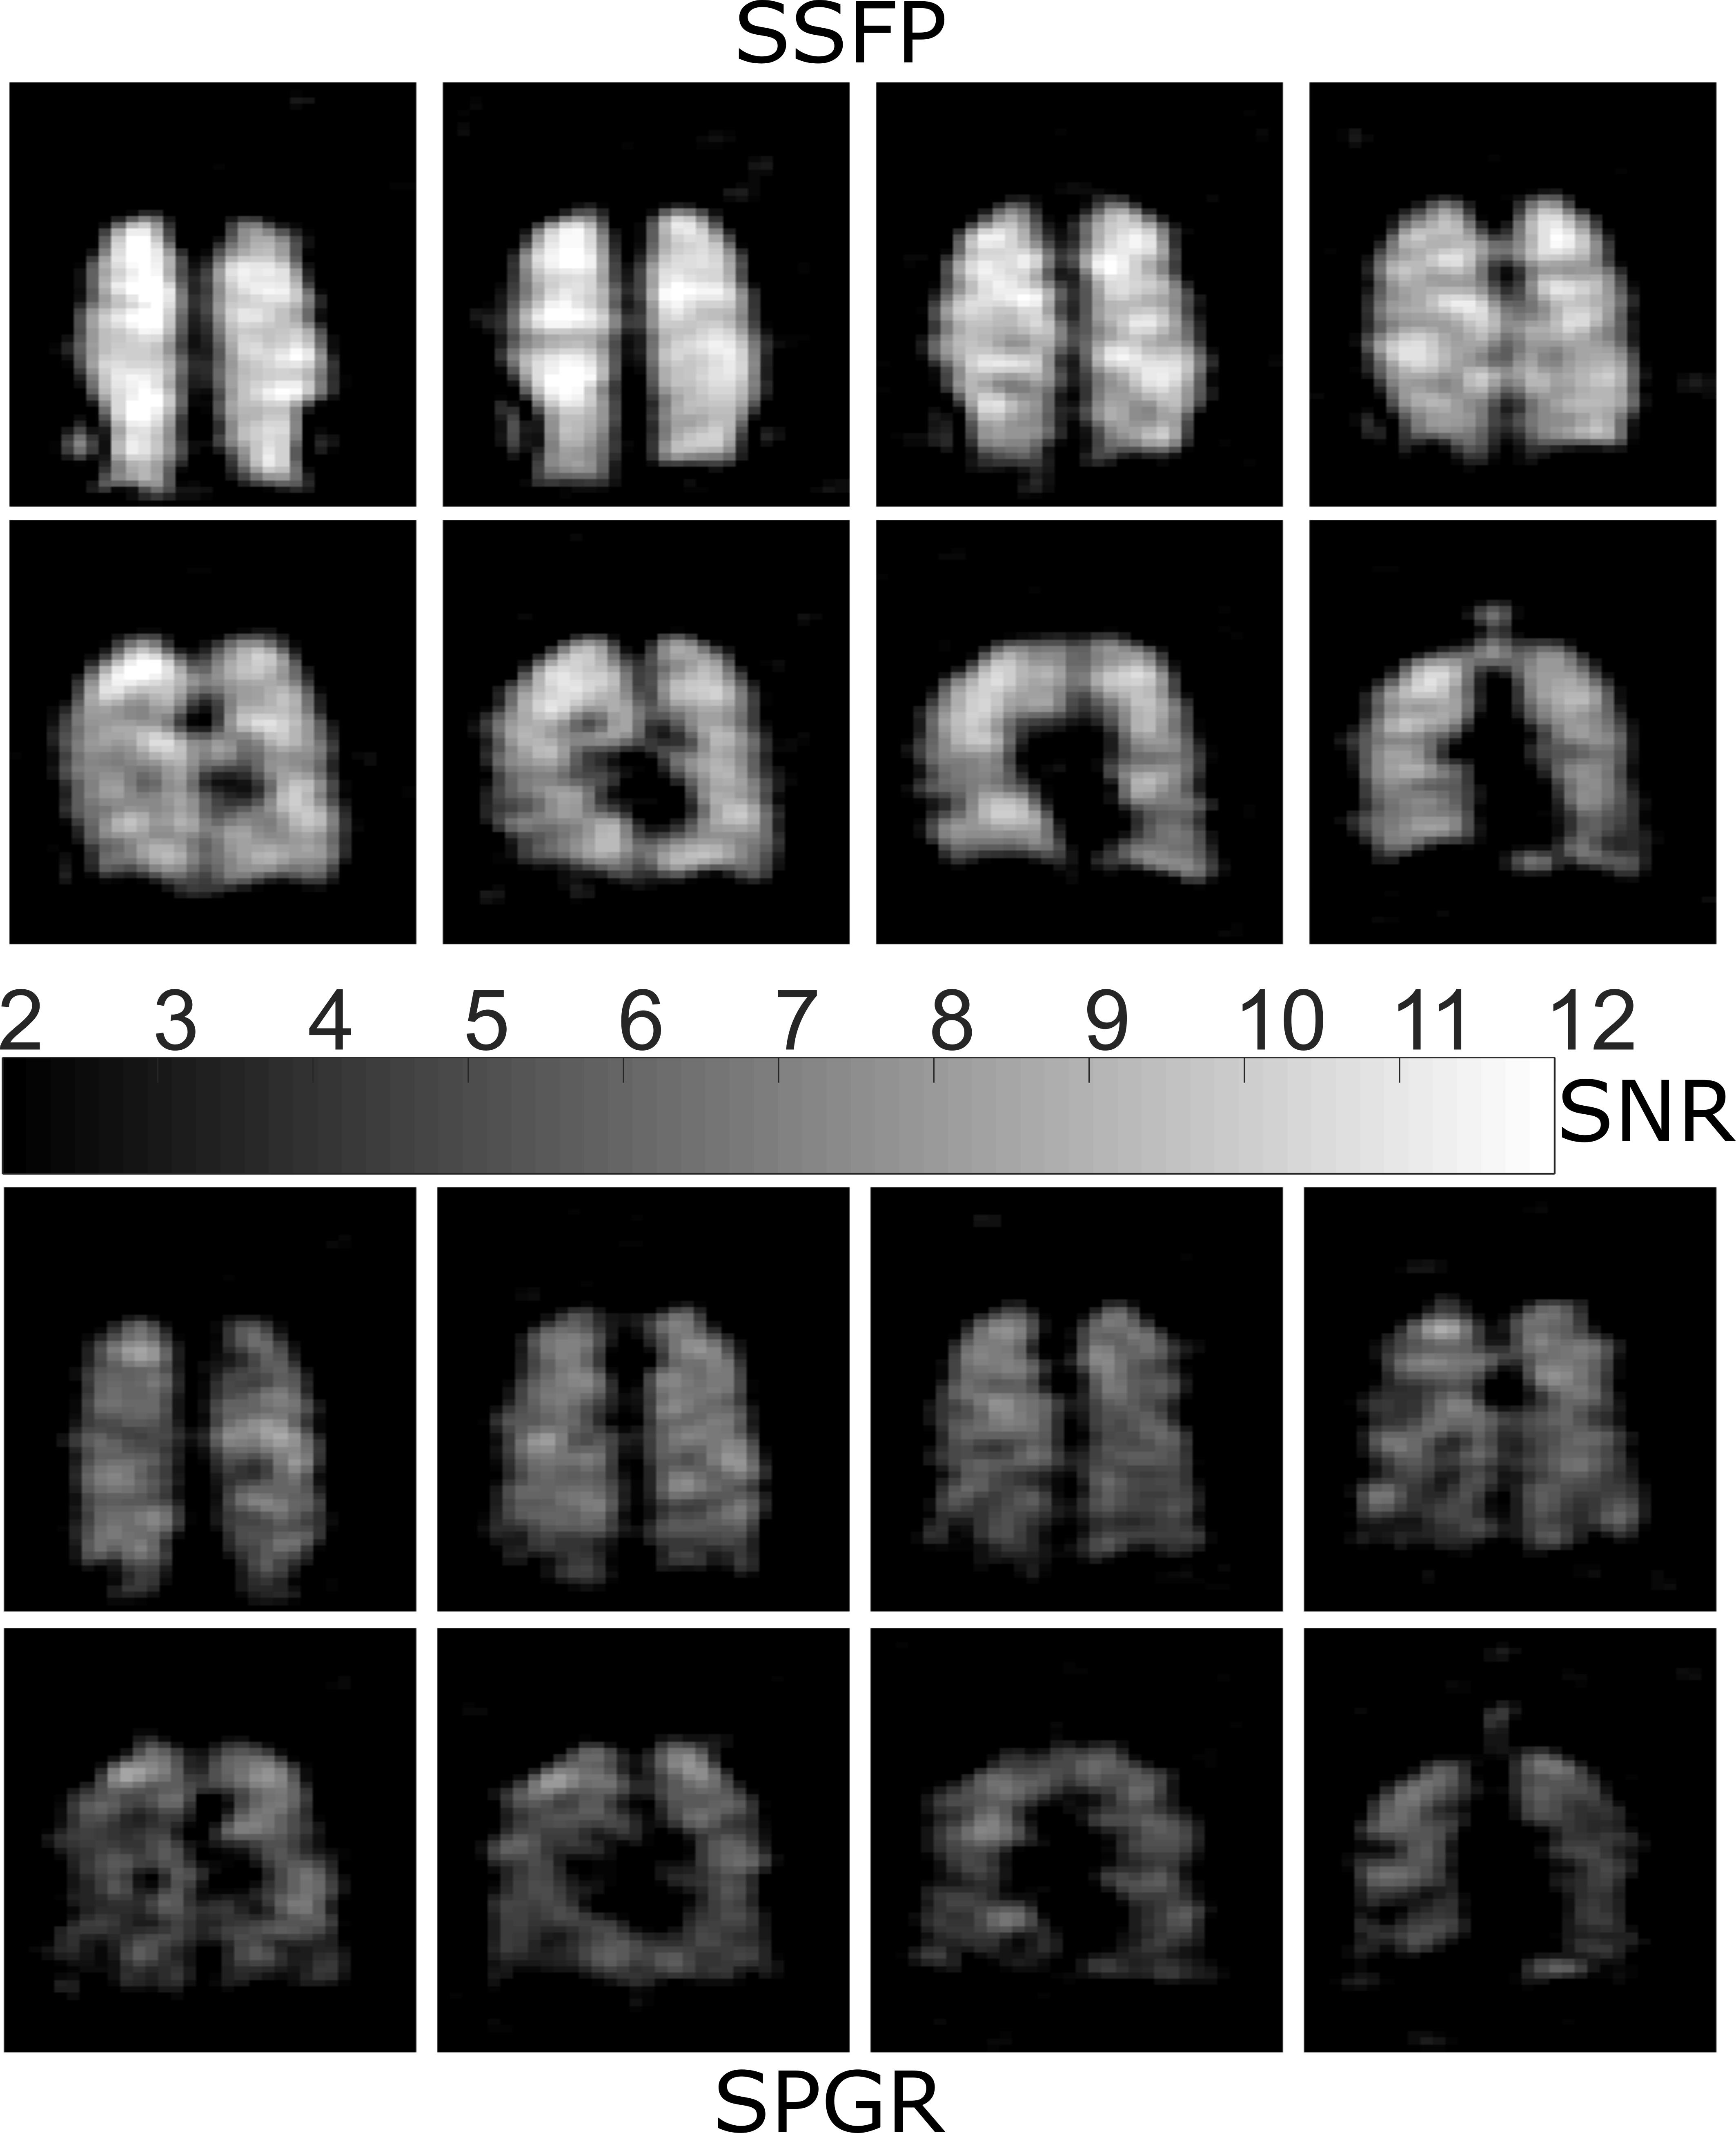
The relative SNR differences between 3D SPGR and SSFP sequences as a function of FA for the PFP phantom are shown in Figure 2, along with the simulated transverse magnetization. PFP phantom images obtained with the 3D SSFP sequence using an average FA of 91° are shown in Figure 3. The resulting SNR maps from in-vivo imaging using both SPGR and SSFP sequences are shown in Figure 4. A mean SNR increase factor of 1.68 (10.5 vs. 6.25) was found using SSFP vs. SPGR in-vivo, which is in good agreement with the factor of 1.65 found for phantom imaging and simulations.Discussion and Conclusion
The close agreement between predicted transverse magnetization and measured signal indicate the expected MR parameters for the phantom are valid. Additionally, the in-vivo improvement with SSFP over SPGR closely matches that predicted using phantom measurements. In the lungs a reduction of T1 to 12.4ms and of T2* to 2.2ms has been reported2; the simulated steady-state magnetization was found to change minimally using either set of parameters. We have shown enhanced image quality than previously achieved at 1.5 T for 19F using optimized SSFP sequences, with comparable imaging times9-11. Although, in principle close to twice the SNR was predicted for optimized SSFP vs. SPGR, the FA for in-vivo imaging was restricted to 63º because of self-imposed conservative SAR constraints12. SAR constraints are greater at 3T so the advantages of SSFP may be less. The relatively long T2 of PFP and the rapid recovery of longitudinal magnetization indicate that this gas is likely the best choice for future 19F imaging studies. In future work we will assess the effects of banding and off-resonance with SSFP 19F in human lungs.Acknowledgements
Doctoral program funding for Adam Maunder was partially provided by support from GE Healthcare Inc. and scholarships from the Natural Sciences and Engineering Research Council of Canada (NSERC) and University of Sheffield. This work was funded by the National Institute for health research (NIHR), Medical Research Council (MRC) and University of Sheffield Hyperpolarised Imaging Group - POLARIS. The views expressed in this abstract are those of the author and not necessarily those of NHS, NIHR, MRC or the Department of Health.References
1. S. J. Kruger, S. K. Nagle, M. J. Couch, Y. Ohno, M. Albert, and S. B. Fain, "Functional imaging of the lungs with gas agents," Journal of Magnetic Resonance Imaging, 2015;43:295-315
2. M. J. Couch, I. K. Ball, T. Li, M. S. Fox, S. L. Littlefield, B. Biman, et al., "Pulmonary ultrashort echo time 19F MR imaging with inhaled fluorinated gas mixtures in healthy volunteers: feasibility," Radiology, 2013;269:903-909
3. Y. V. Chang and M. S. Conradi, "Relaxation and diffusion of perfluorocarbon gas mixtures with oxygen for lung MRI," Journal of Magnetic Resonance, 2006;181:191-198
4. B. A. Hargreaves, S. S. Vasanawala, J. M. Pauly, and D. G. Nishimura, "Characterization and reduction of the transient response in steady-state MR imaging," Magnetic Resonance in Medicine, 2001;46:149-158
5. S. C. L. Deoni, "High-resolution T1 mapping of the brain at 3T with driven equilibrium single pulse observation of T1 with high-speed incorporation of RF field inhomogeneities (DESPOT1-HIFI)," Journal of Magnetic Resonance Imaging, 2007;26:1106-1111
6. N. L. Adolphi and D. O. Kuethe, "Quantitative mapping of ventilation-perfusion ratios in lungs by 19F MR imaging of T1 of inert fluorinated gases," Magnetic Resonance in Medicine, 2008;59:739-46
7. B. Guérin, M. Gebhardt, P. Serano, E. Adalsteinsson, M. Hamm, J. Pfeuffer, et al., "Comparison of simulated parallel transmit body arrays at 3 T using excitation uniformity, global SAR, local SAR, and power efficiency metrics," Magnetic Resonance in Medicine, 2015;73:1137-1150
8. A. Maunder, M. Rao, F. Robb, and J. Wild, "RF coil design for multi-nuclear lung MRI of 19F fluorinated gases and 1H using MEMS," Proc. Intl. Soc. Mag. Reson. Med., 2016;24:3504
9. U. Wolf, A. Scholz, C. P. Heussel, K. Markstaller, and W. G. Schreiber, "Subsecond fluorine-19 MRI of the lung," Magnetic Resonance in Medicine, 2006;55:948-951
10. R. E. Jacob, Y. V. Chang, C. K. Choong, A. Bierhals, D. Zheng Hu, J. Zheng, et al., "19F MR imaging of ventilation and diffusion in excised lungs," Magnetic Resonance in Medicine, 2005;54:577-585
11. U. Wolf, A. Scholz, M. Terekhov, K. Muennemann, K. Kreitner, C. Werner, et al., "Fluorine-19 MRI of the lung: first human experiment " Proc. Intl. Soc. Mag. Reson. Med., 2008;16:3207
12. 60601-2-33, "Particular requirements for the basic safety and essential performance of magnetic resonance equipment for medical diagnosis," in Medical electrical equipment - Part 2-33, ed, 2015.
Figures