3315
Exploring Lung Inflation Mechanisms with 3D 3He and 129Xe Whole Lung Morphometry Mapping1Academic Unit of Radiology, University of Sheffield, Sheffield, United Kingdom, 2Department of Bioengeering, Universidad Carlos III de Madrid, Madrid, Spain
Synopsis
Alveolar dimensions change with lung inflation, however, there is currently no consensus on whether this change is primarily due to expansion and if alveolar recruitment plays a role. Here, multiple b-value DW-MRI was used to investigate lung inflation mechanisms in-vivo, and 3D 3He and 129Xe whole lung morphometry (LmD) maps were acquired in five healthy volunteers at lung inflation states of FRC+1L and TLC. Decreases in the anterior to posterior gravitational gradient were observed between FRC+1L and TLC with both nuclei. Smaller than predicted LmD values at TLC suggests that both alveolar expansion and recruitment may occur during lung inflation.
Purpose
Alveolar dimensions change with lung inflation, and this has been demonstrated with mapping of the apparent diffusion coefficient (ADC) from hyperpolarised (HP) gas diffusion-weighted (DW) MRI. 1,2 However, there is currently no consensus on whether these changes are primarily due to expansion and if alveolar recruitment also plays a significant role. In-vivo lung morphometry models using multiple b-value DW-MRI have been used to explore these inflation mechanisms, 3 but that study used low resolution 3He DW-MRI and did not have whole lung coverage. With 3D 3He and 129Xe DW-MRI sequences 4,5 available, high resolution whole lung morphometry maps (LmD) can now be obtained with both nuclei. This work aims to compare LmD from 3D multiple b-value DW-MRI at different lung inflation states with 3He and 129Xe.Methods
Five healthy volunteers were recruited and underwent 3D multiple b-value DW-MRI with both HP 3He and 129Xe at two different lung inflation states (functional residual capacity + 1L (FRC+1L) and total lung capacity (TLC)). For the FRC+1L inflation state, volunteers inhaled a 1L mixture of HP gas and N2 at FRC. For the TLC inflation state, they performed the same manoeuvre and continued inhaling room air until TLC. All imaging acquisitions were performed on a 1.5T GE HDx scanner with 3D SPGR 3He and 129Xe DW-MRI sequences using compressed sensing. 4,5 ADC and LmD 6 values were calculated for each DW-MRI acquisition. Each healthy volunteer was also assessed with plethysmography to determine their FRC and TLC lung volumes.Results and Discussion
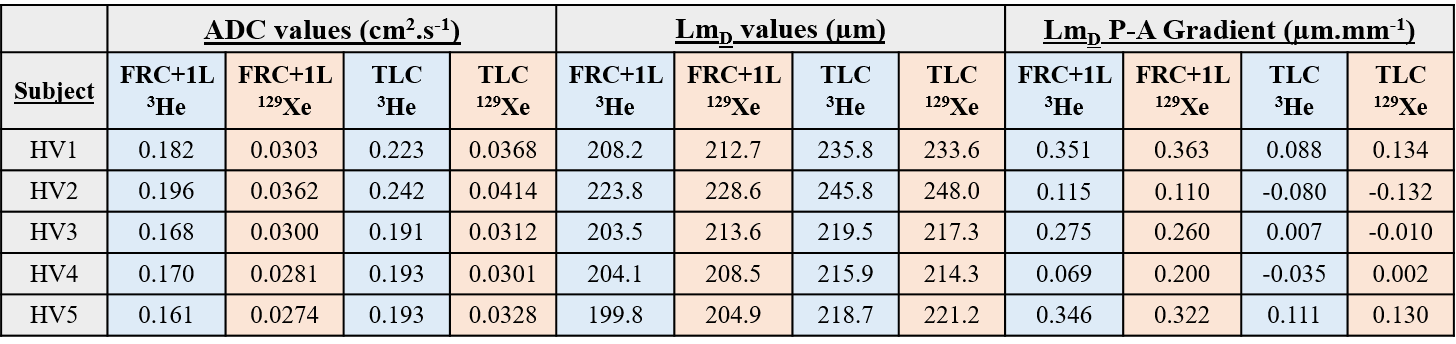
For each volunteer, an increase in both mean whole lung ADC and LmD values was observed between FRC+1L and TLC with both 3He and 129Xe (Table 1). This increase in both DW imaging metrics with lung inflation matches previous studies. 1-3 For the FRC+1L inflation state, a mean difference of ~6 µm was observed between 3He and 129Xe LmD values; while a smaller difference of ~2 µm was detected at TLC. This improved matching may in part be explained by the fact that TLC is a more reproducible lung inflation state.
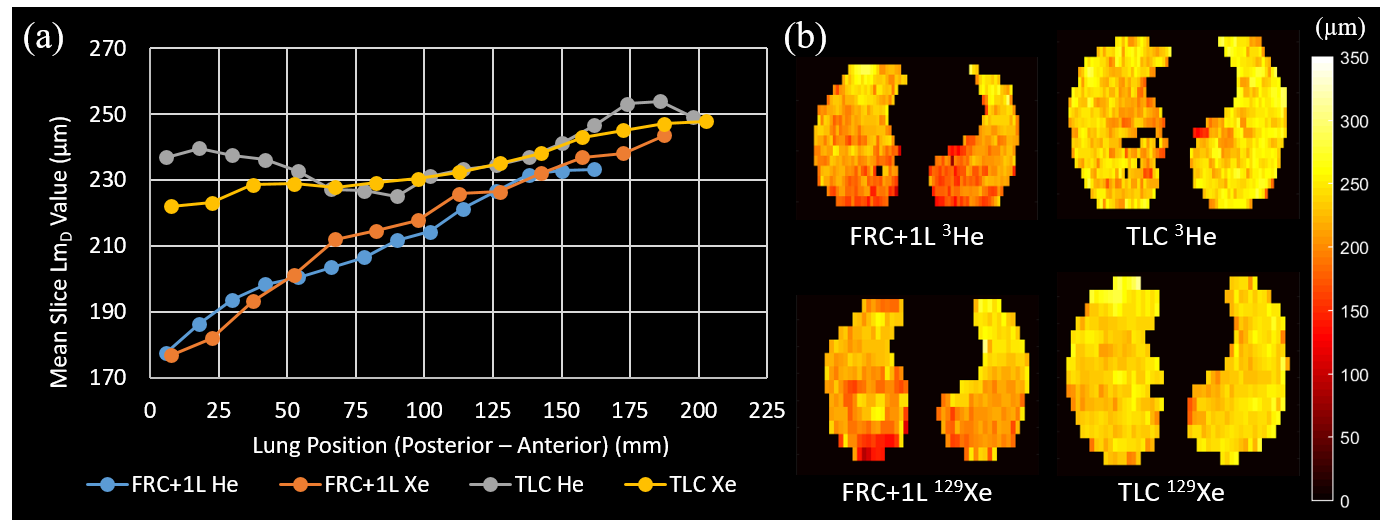
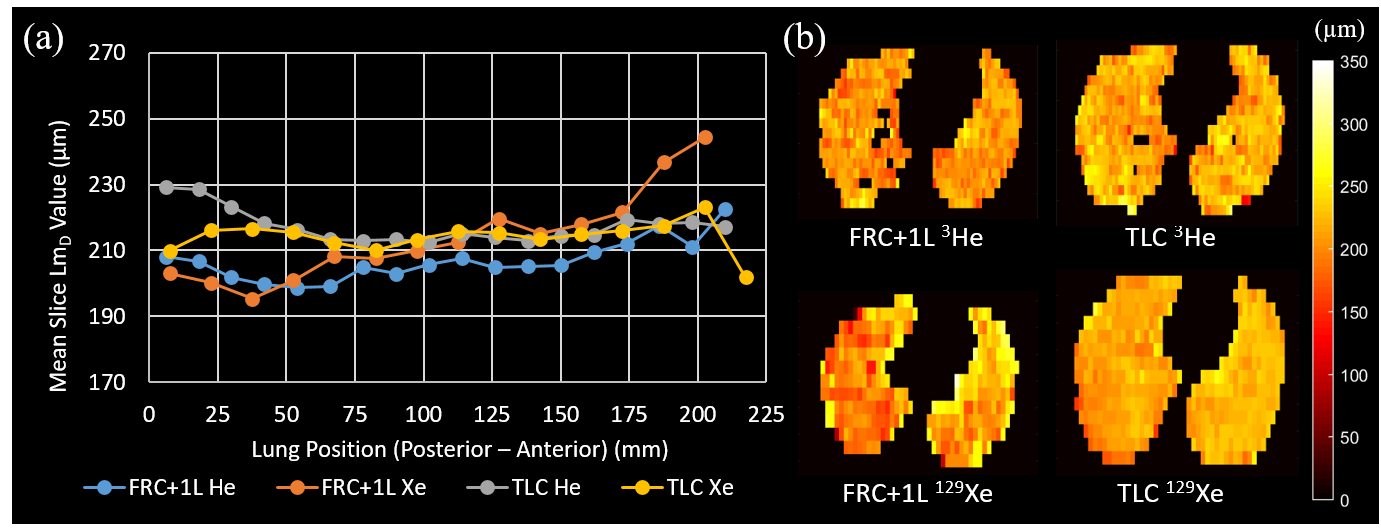
In conjunction with the increase in 3He and 129Xe LmD values with inflation, differences in the posterior to anterior (P-A) LmD gradient at the two inflation states were also observed (Table 1). Every volunteer had a decrease in P-A LmD gradient from FRC+1L to TLC volume. The reduction in P-A gradient was also observed previously with 3He ADC mapping 1 and can be explained by the regional differences in pleural pressure leading to an uneven distribution of ventilation at FRC+1L that reduces when the lung expands. 7 The P-A gradients for the five healthy volunteers can be classified in two distinct groups with either small or large differences between FRC+1L and TLC. HV1 LmD data is shown in Figure 1, where a large P-A gradient can be seen at FRC+1L; at TLC, this P-A gradient is diminished. HV4 (Figure 2) exhibits a small P-A gradient at FRC+1L and this gradient reduces slightly at TLC. These differences in P-A gradient between healthy volunteers could be the result of inter-subject variations in regional differences of lung ventilation.
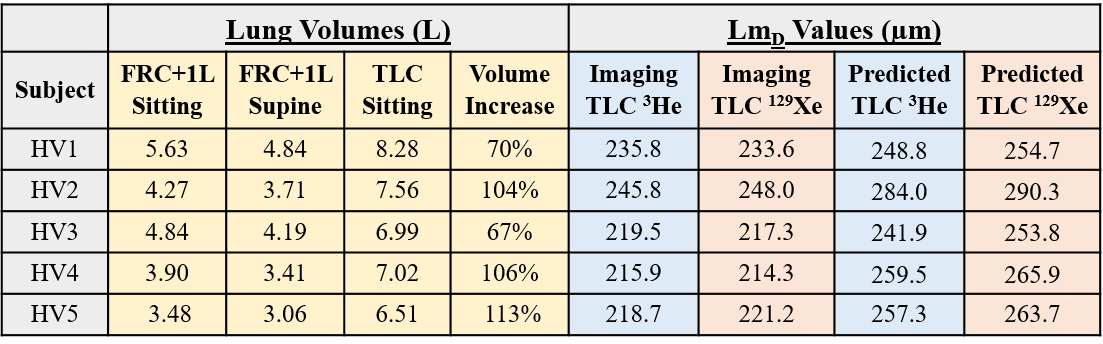
Table 2 summarises the plethysmography data for each volunteer. A FRC+1L supine volume was calculated by decreasing the FRC sitting volume by 17%. 8 Assuming a simple expansion model of isotropic increase in alveolar volume during inflation, a predicted TLC LmD value can be calculated by scaling the FRC+1L 3He LmD value by (% volume increase)1/3. Each volunteer’s predicted TLC 3He and 129Xe LmD value was larger than the in-vivo TLC equivalent. These results may suggest that a simple model of isotropic alveolar expansion does not fully explain changes in alveolar dimensions with lung inflation. A possible explanation for the smaller mean LmD value is alveolar recruitment, where previously closed alveoli become ventilated at TLC, contributing to increased lung volume but not increased mean LmD. A similar hypothesis of alveolar expansion and recruitment during lung inflation was proposed by Hajari et al. 3 More imaging in different patient groups and realistic acinar phantom geometry models is required to confirm this hypothesis.
Conclusion
This is the first preliminary study of lung inflation with 3D multiple b-value 3He and 129Xe DW-MRI in healthy volunteers. Good matching of LmD values and changes in the P-A gravitational gradient were observed at both inflation states with both HP gases. The smaller than predicted mean LmD values at TLC suggest that a combination of both alveolar expansion and recruitment may occur during lung inflation.Acknowledgements
No acknowledgement found.References
1. Halaweish, A. F., et al. (2013). Radiology 268(2): 572-580.
2. Diaz, S., et al. (2008). J Magn Reson Imaging 27(4): 763-770.
3. Hajari, A. J., et al. (2012). J Appl Physiol (1985) 112(6): 937-943.
4. Chan, H-F., et al. (2016). Magn Reson Med. doi:10.1002/mrm.26279.
5. Chan, H-F., et al. (2016). British Chapter ISMRM 2016.
6. Parra-Robles, J. et al. (2014). Proc ISMRM:3529.
7. Milic-Emili, J., et al. (1966). J Appl Physiol 21(3): 749-759.
8. Yap, J. C., et al. (2000). Am J Respir Crit Care Med 162(4 Pt 1): 1285-1291.
Figures