3313
Mapping Vascular Behaviour in Lung Perfusion of two-year old children after Congenital Diaphragmatic Hernia Repair using Tissue Similarity Maps1Computer Assisted Clinical Medicine, Heidelberg University, Mannheim, Germany, 2Department of Radiology and Nuclear Medicine, Heidelberg University, Mannheim, Germany, 3Department of Neonatology, University Medical Center Mannheim, Mannheim, Germany
Synopsis
Congenital Diaphragmatic Hernia (CDH) is associated with lung hypoplasia reflected in decreased pulmonary microcirculation and secondary pulmonary hypertension. Using tissue similarity maps (TSM), Haacke et al. demonstrated mapping vascular behaviour and calculating relative pulmonary blood volume (rPBV) maps in perfusion weighted imaging of the brain. In this study we have investigated the significance of the TSM technqiue for lung perfusion imaging in two-year old children after CDH repair.
Introduction
Congenital Diaphragmatic Hernia (CDH) is associated with lung hypoplasia reflected in decreased pulmonary microcirculation and secondary pulmonary hypertension1. After surgical repair, patients are registered in long-term follow-up programs i.e. to answer the question whether the hypoplastic part of the lung will catch up growth or remain problematic. Lung perfusion imaging in CDH of two-year old children has been recently proposed and quantitative dynamic contrast enhanced (DCE)-MRI could show significant differences between the ipsilateral and contralateral lung2-4.
Using tissue similarity maps (TSM), Haacke et al. demonstrated mapping vascular behaviour and calculating relative pulmonary blood volume (rPBV) maps in perfusion weighted imaging of the brain5.
In this study we have investigated the significance of the TSM technqiue for lung perfusion imaging in two-year old children after CDH repair. Especially, the following questions were answered: Are there any technical limitations applying TSM to lung perfusion data? Since this method requires the delineation of reference pixels or regions of interest (ROI), what is its sensitivity to the choice of reference region? Do the resultsa of TSM and TSM-based rPBV reflect lung hypoplasia with respect to rPBV values in the affected lungs?
Materials and Methods
DCE-MRI image data of ten children (age 2.0±0.2 years) after hernia repair were analysed retrospectively. Image acquisition and calculation of PBV maps were performed as described previously by Weidner et al.3. All patients were enrolled in our local follow-up program and written consent was obtained.
To calculate the TSM, the mean squared error (MSE) between a reference signal $$$S_{ref}$$$ and the signal from each pixel $$$S_{i,j}$$$ across a specific slice over N time points was calculated5:
$$ TSM(i,j) = \frac{1}{n} \sum_{t=1}^N((S_{ij}(t-Δttp_{i,j}) - S_{ref}(t))^2$$
$$$Δttp_{ij}$$$ is the difference between the reference ROI’s and each pixel’s time-to-peak. Due to shifting, data extrapolation was performed either by padding each pixel’s mean baseline value at the beginning or by extrapolating the intensities in the right tail using a slowly decaying exponential function. Two denoising techniques were applied, one in the spatial (2x2 median filter) and one in the temporal domain (moving average of length 3) to smooth the data.
rPBV maps were based on baseline-free data as follows5:
$$ rPBV(i,j) = \frac{\sum_{t=1}^N \left(\frac{\overline{S_{i,j}(0)} - S_{ij}(t- \Delta ttp_{i,j})}{\overline{S_{i,j}(0)}}\right) * \left(\frac{\overline{S_{ref}(0)} - S_{ref}(t)}{\overline{S_{ref}(0)}}\right)}{\sum_{t=1}^N \left(\frac{\overline{S_{ref}(0)} - S_{ref}(t)}{\overline{S_{ref}(0)}}\right)^2} $$
To evaluate the reproducibility of TSMs in terms of the reference ROI selection, we selected six reference ROIs (three in each lung side, upper, middle and lower parts) for each of three adjacent slices for every subject. Next, we created non-baseline corrected TSMs for four adjacent slices based on the reference ROIs while drawing 24 measuring ROIs for each subject, six for each one of four adjacent slices (again three in each side of the lung). Mean values of the MSE were calculated for measuring ROIs located at different parts of both lungs in TSMs nulling either the corresponding part of lung tissue or its symmetrical counterpart.
Finally, similar analysis was performed to investigate rPBV maps’ robustness while two-sample t-tests were performed to investigate not only differences between healthy and hypoplastic rPBV values, but also whether the rPBVs are in line with those obtained by Weidner et al.3. A p-value of <0.05 was considered as significant.
Results
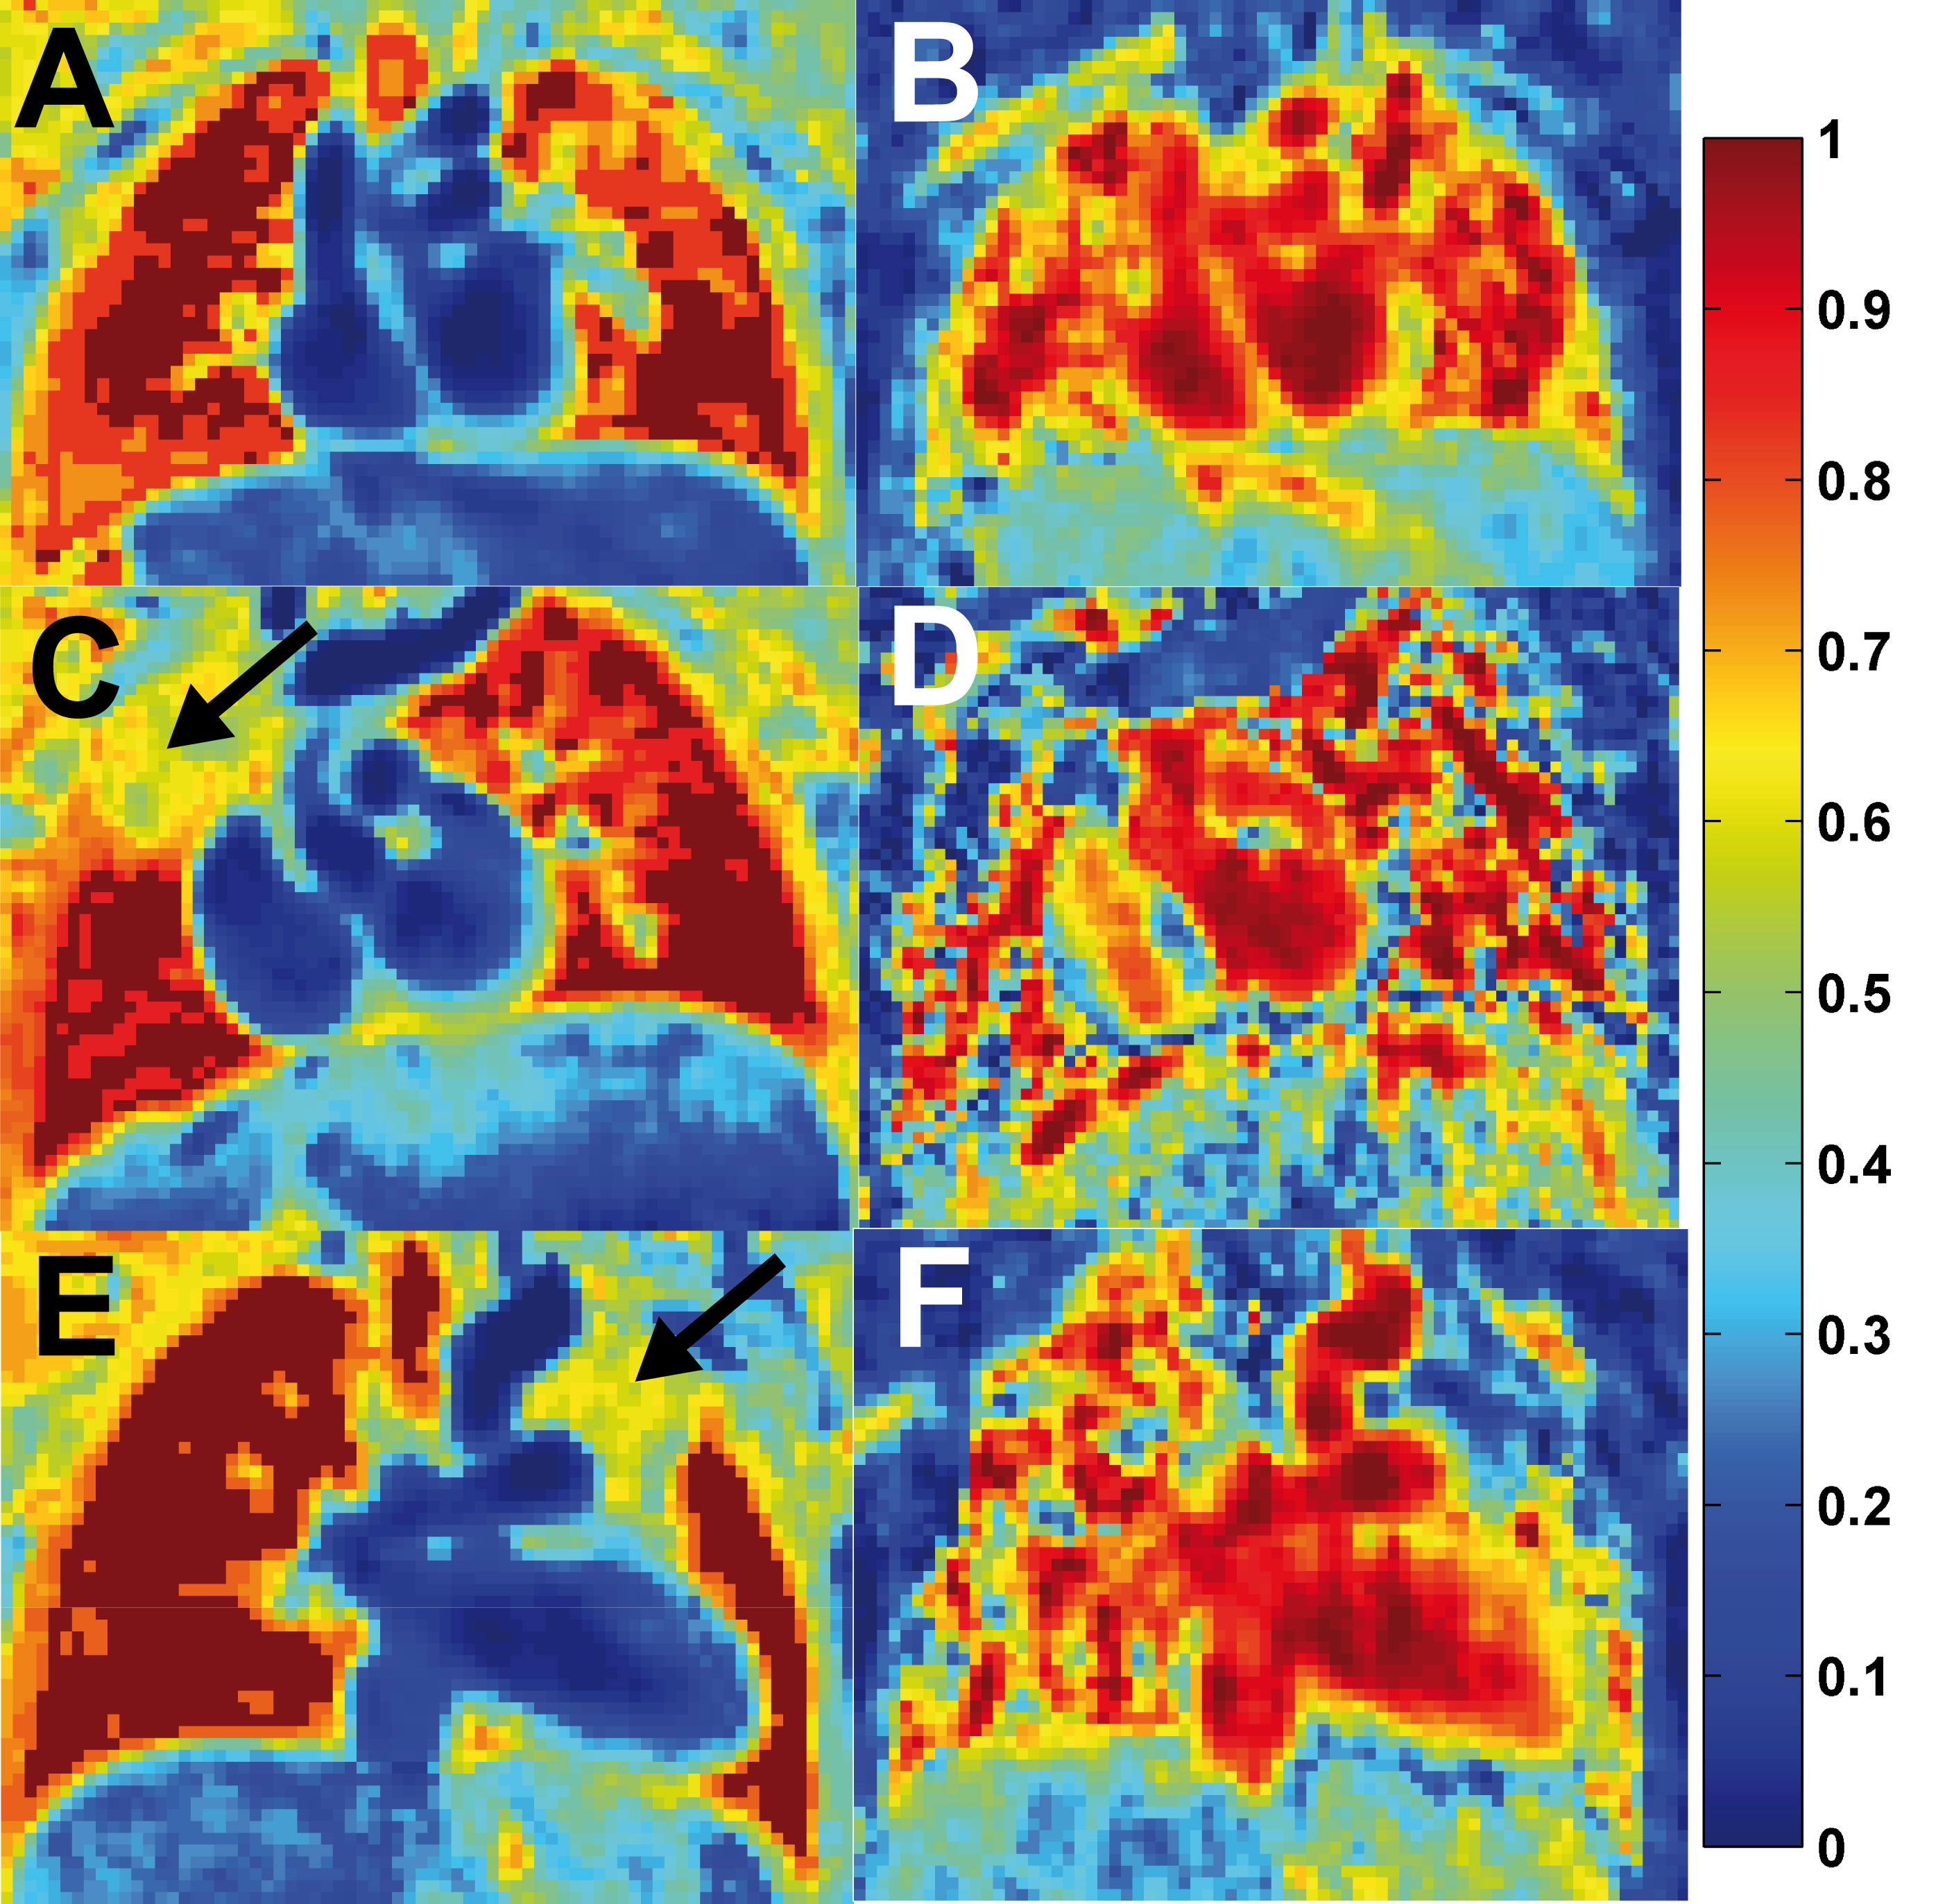
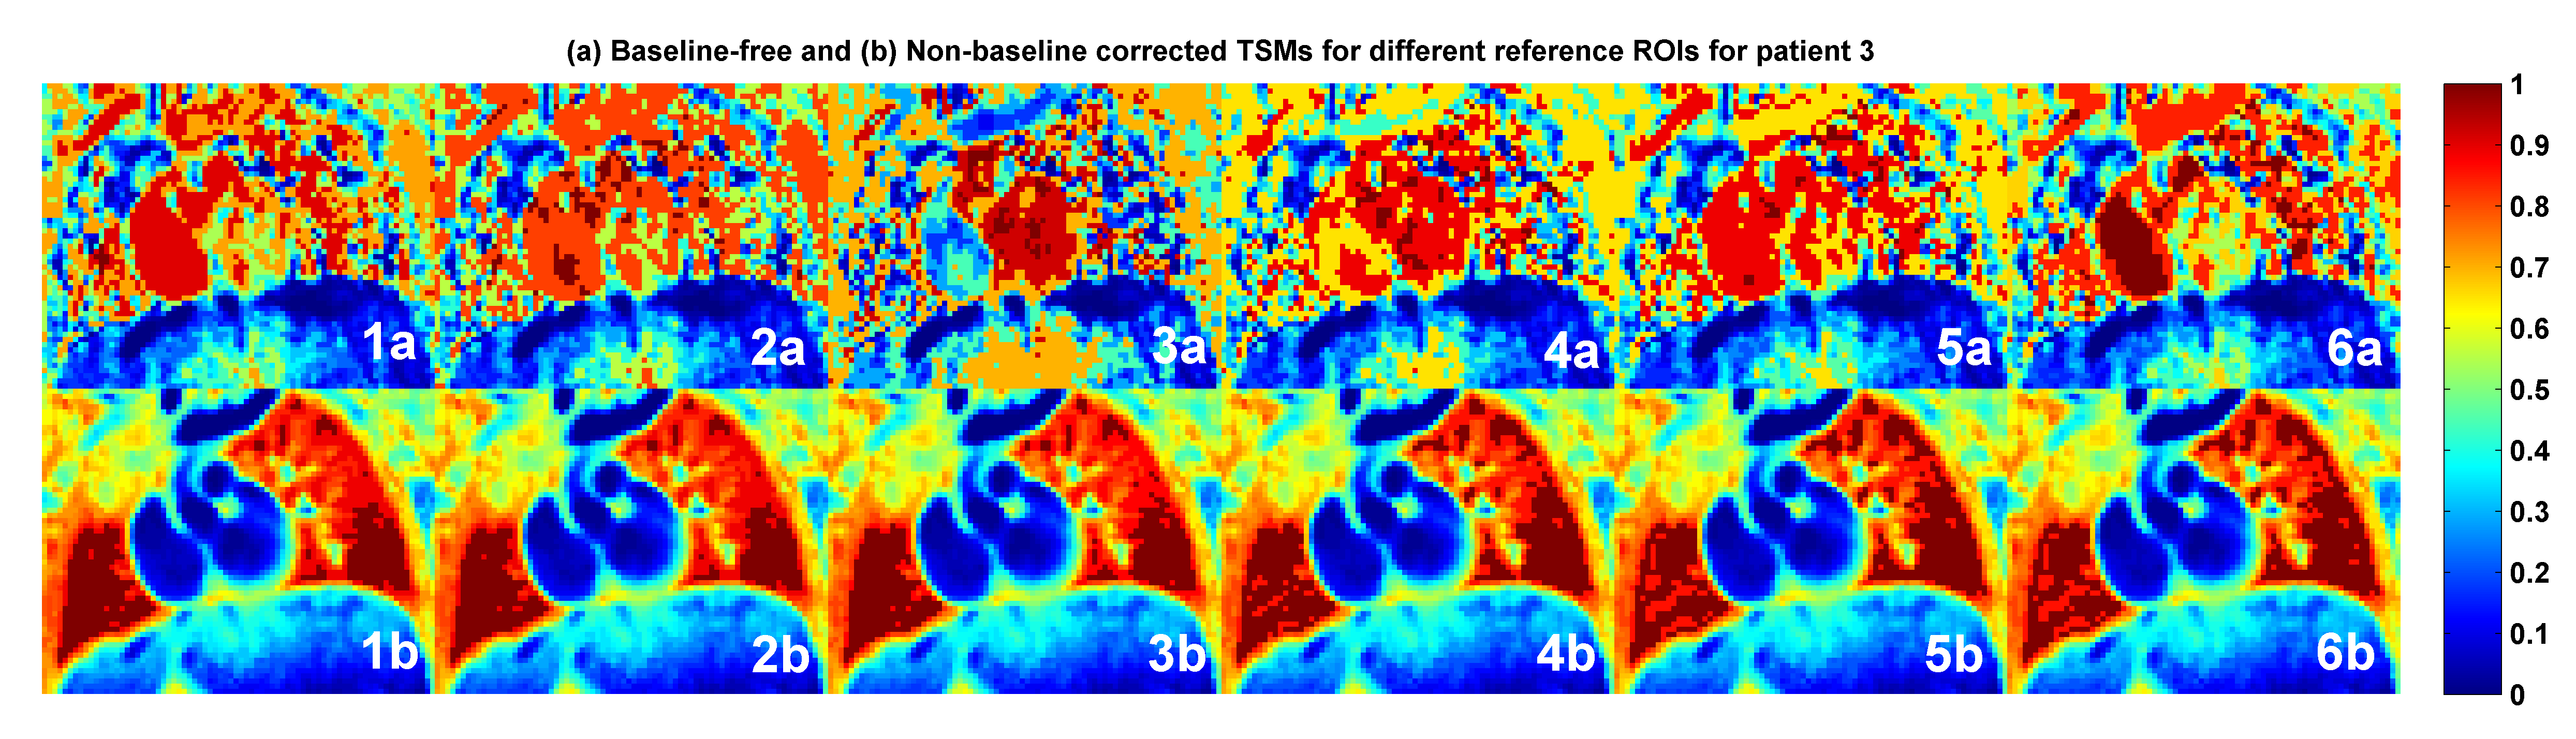
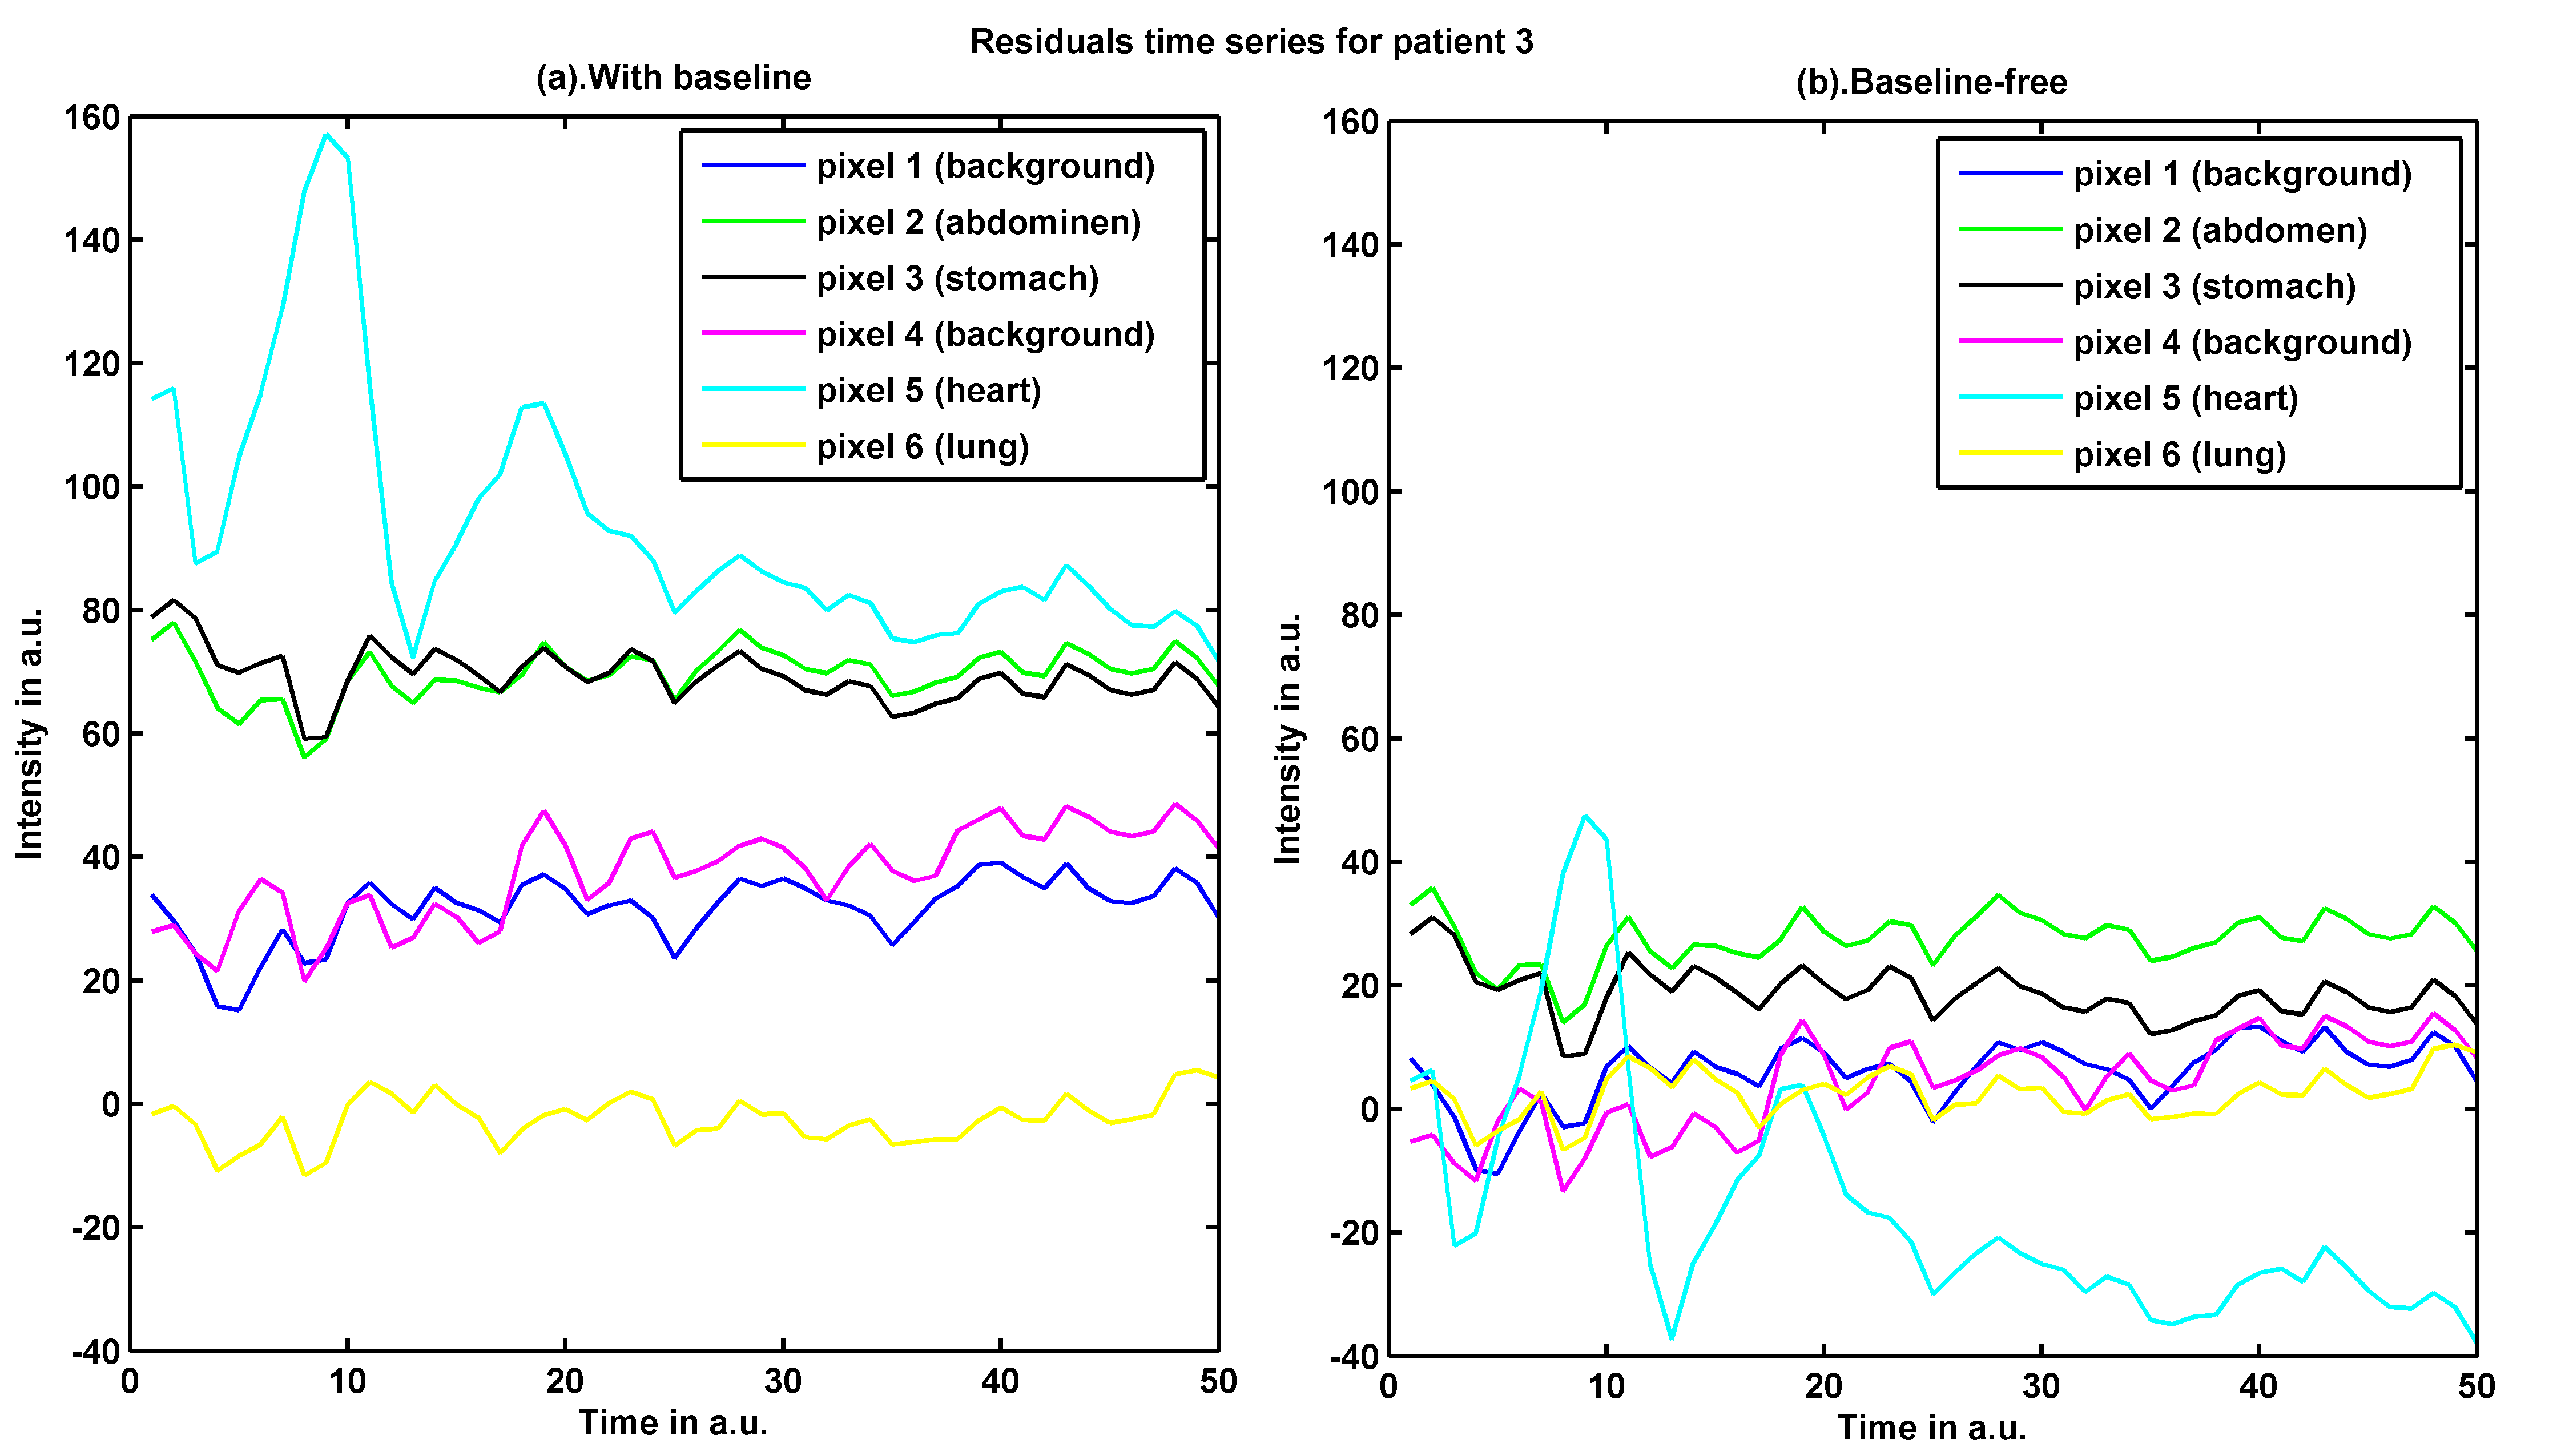
TSM and rCBV maps could be obtained for all subjects (cf. Fig. 1). A slowly decaying exponential function to extrapolate time shifted signal time curves models best the wash-out regime. To achieve a better segmentation of the lungs, a baseline correction can be omitted to produce visually enhanced TSMs (see Fig. 2). However, baseline correction is needed to calculate rPBV maps.
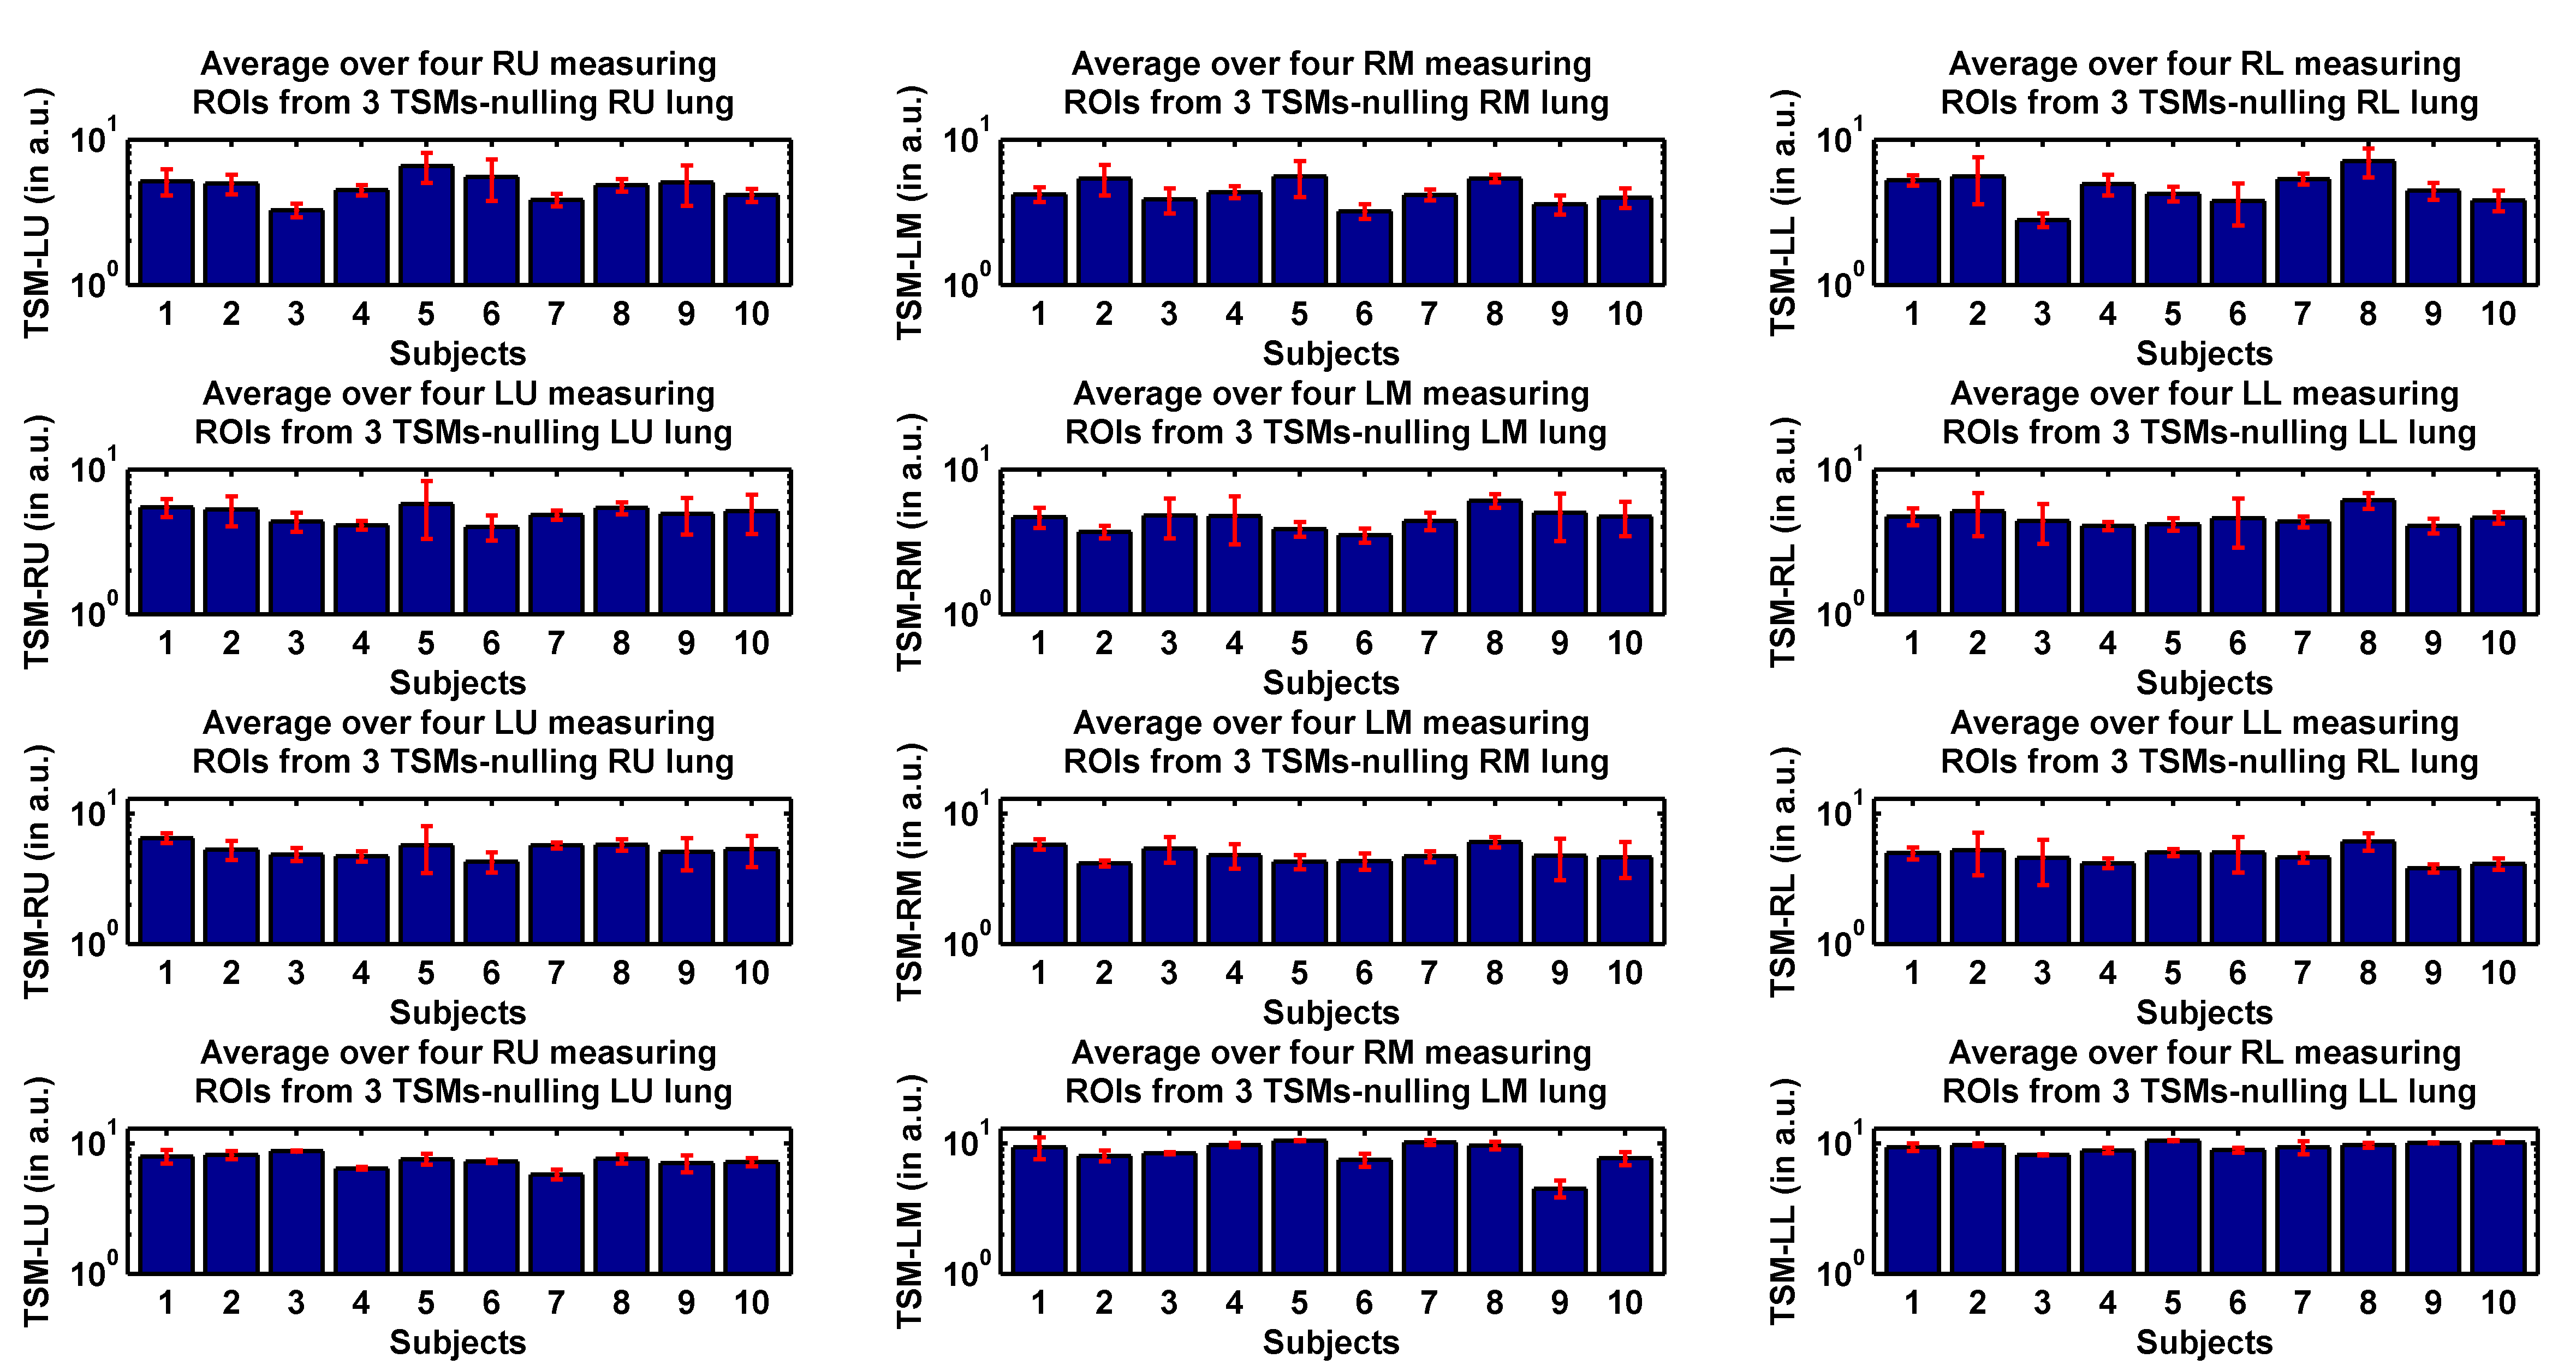
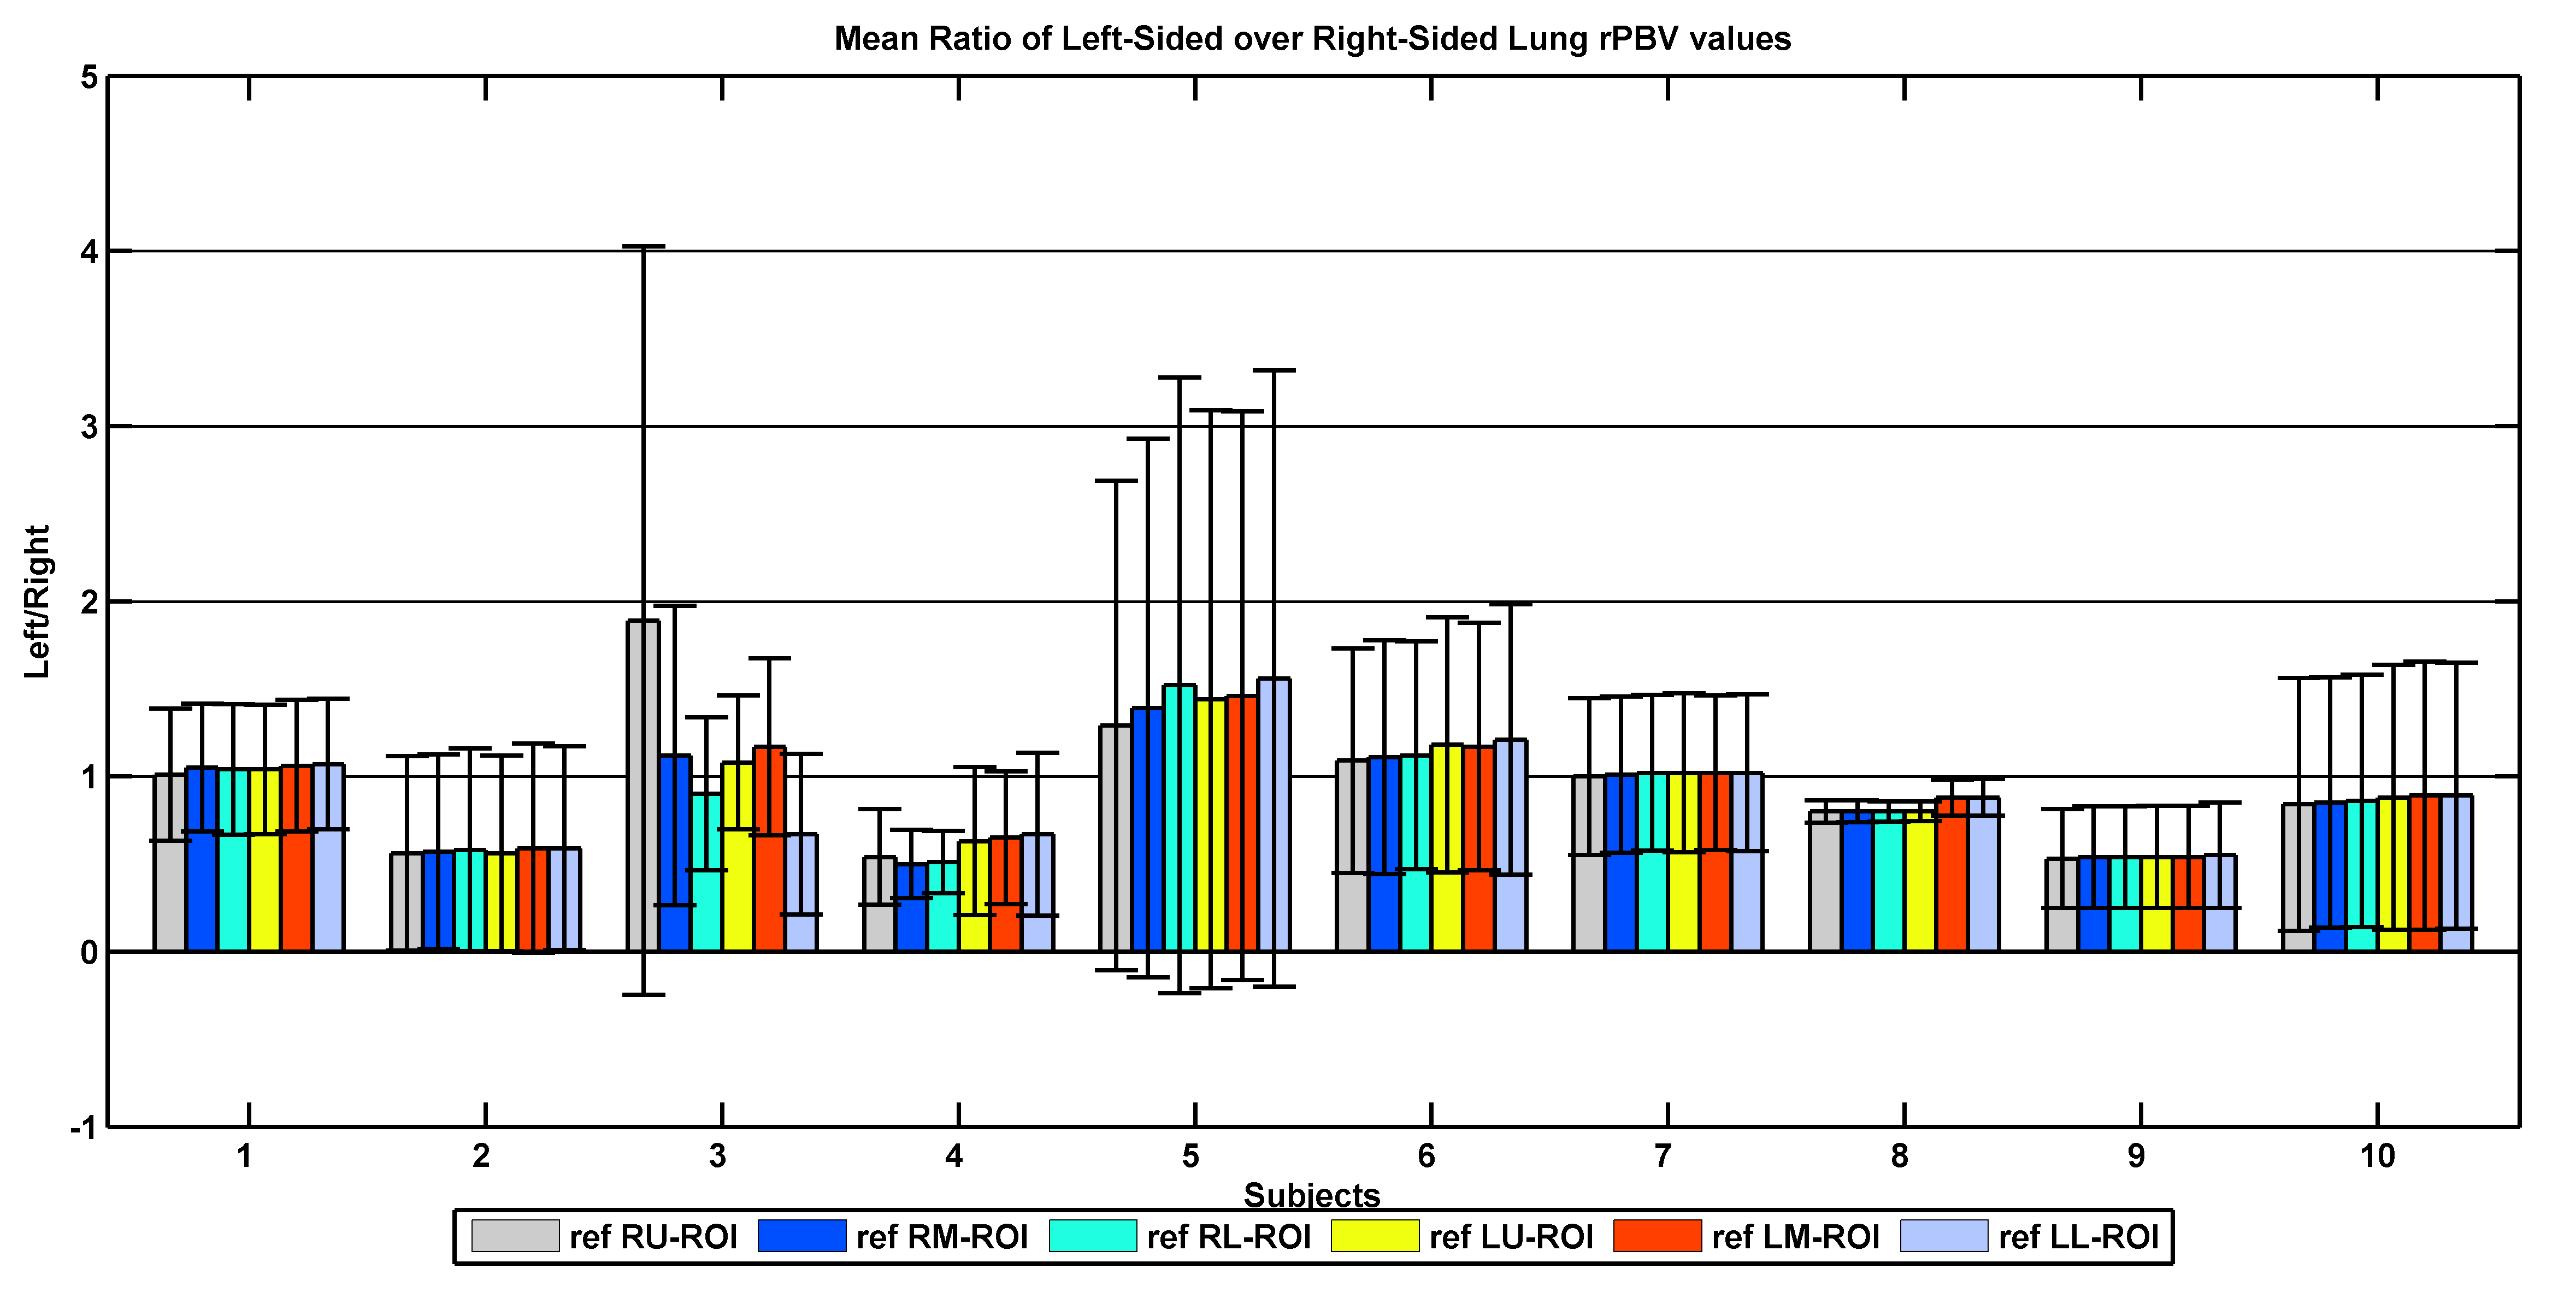
Moreover, TSM is robust and does not depend on reference ROI selection (cf. Figures 3 and 4). According to the two-sample t-tests, rPBV values estimated in healthy upper and middle measuring ROIs were not significantly different from their hypoplastic counterparts; p-values were 0.4053 and 0.3778 but significant for lower ROIs (p=0.0236). Comparing rPBVs created by UMMPerfusion6 and TSM denoted no significant difference between both approaches (p=0.8509).Discussion
Our initial results show that TSMs could be useful to depict lung hypolasia and to calculate rPBV maps. Obtained rPBV maps were not significant different from PBV maps obtained by deconvolution.
However, a direct translation of this technique from brain to lung was not possible as shifted time courses had to be extrapolated. Baseline correction can be omitted for TSMs since thereafter, we observed a narrow zones of intensities resulting into high similarity values even if signals do not originate from lung (see Fig. 5). Nevertheless, the technqiue is robust against the necessary reference ROI selection.
Acknowledgements
No acknowledgement found.References
1. Lakshminrusimha S, Saugstad OD. The fetal circulation, pathophysiology of hypoxemic respiratory failure and pulmonary hypertension in neonates, and the role of oxygen therapy. J Perinatology 2016, 36, S3-S11.
2. Zöllner FG, Zahn K, Schaible T, Schoenberg S, Schad LR and Neff KW. Quantitative pulmonary perfusion imaging at 3.0 T of 2-year-old children after congenital diaphragmatic hernia repair: initial results. Eur Radiol, 2012, 22 (12), pp.2743-2749.
3. Weidner M, Zöllner FG, Hagelstein C, Zahn K, et al. High temporal versus high spatial resolution in MR quantitative pulmonary perfusion imaging of 2-year old children after congenital diaphragmatic hernia repair. Eur Radiol, 2014, 24 (10), pp.2427-2434.
4. Weis M, Zöllner FG , Hagelstein C, et al. MR lung perfusion in 2-year old children after congenital diaphragmatic hernia repair– comparison of children after ECMO therapy and children without ECMO requirement.Am J Roentgenol, 2016, 206, pp.1-6
5. Haacke EM, Li M, and Juvvigunta F. Tissue similarity maps (TSMs): A new means of mapping vascular behavior and calculating relative blood volume in perfusion weighted imaging. Magnetic Resonance Imaging, 2013, 31(4), 481–9.
6. Zöllner FG, Daab M, Sourbron S, et al. An open source software for analysis of dynamic contrast enhanced magnetic resonance images: UMMPerfusion revisited.BMC Med Imaging, 2016, 16 (7), pp.1-13
Figures