3310
Repeatability of global percent enhancement and regional defect quantification in oxygen-enhanced 3D radial ultrashort echo time MRI1Medical Physics, University of Wisconsin-Madison, Madison, WI, United States, 2Radiology, University of Wisconsin-Madison, Madison, WI, United States, 3Pediatrics, University of Wisconsin-Madison, Madison, WI, United States, 4Biomedical Engineering, University of Wisconsin-Madison, Madison, WI, United States
Synopsis
Oxygen-enhanced 3D radial UTE MRI (OE-MRI) shows promise as an alternative to hyperpolarized gas MRI for evaluation of ventilation abnormalities. Ten subjects (2 normal, 2 asthmatics and 6 cystic fibrosis) underwent OE-MRI for multiple scans (test/re-test) during visits separated ≤15 days apart. The intra-subject percent signal enhancement (PSE) maps from OE-MRI were compared for median whole-lung PSE, ventilation defect percent (VDP) and spatial agreement between defects. The results suggest good agreement on two global measures, Median PSE and VDP, with low-to-moderate spatial alignment on the inter-visit segmented defects. Improvement of spatial defect repeatability will be a goal of future work.
Purpose
Ventilation heterogeneity1 and severity assessed from oxygen-enhanced 3D radial UTE MRI (OE-MRI) are correlated to hyperpolarized gas MRI in cystic fibrosis (CF)2. However, the repeatability of OE-MRI has not been fully addressed. The aims of this study were to 1) evaluate the intra-subject repeatability of OE-MRI, and 2) quantify defects on the percent signal enhancement (PSE) maps from OE-MRI.Methods
Study Population and Imaging
Two normal, 2 asthmatics and 6 CF subjects were enrolled in two different HIPAA-compliant studies with IRB approval. Each underwent OE-MRI scans at 1.5T (Signa HDx, GE Healthcare). The normal subjects underwent one hyperoxic and multiple air-breathing acquisitions consecutively at one visit, while the asthma and CF subjects were each imaged on 2 separate visits ≤15 days apart.
The OE-MRI technique required two 3D UTE volumes acquired sequentially, one acquired with the subject breathing 21% O2 (normoxic, V21) and a second acquired with the subject breathing 100% O2 (hyperoxic, V100). Scan parameters included: 32cm FOV, TR=2.9-4.2ms, TE=0.08ms, 8° flip, ~38000 projections, and 1.25, 2.5 or 3.2mm isotropic resolution varied experimentally to investigate tradeoffs in anatomic resolution and signal-to-noise ratio. Each UTE volume took ~3.5min to acquire following a 2min wash-in to avoid transient effects. Real-time gating to end-expiration was applied with an adaptive 50% acceptance window. V21 and V100 images were reconstructed offline at high resolution (hi-res) for anatomy and at 1cm3 low-resolution (lo-res) for OE PSE maps using a Fermi filter3.
Image Analysis
The hi-res V21 and V100 image pairs were normalized and co-registered using the B-spline deformable registration4. The resultant transformation (T) was applied to obtain the registered low-res volume T(V21). With the mass-preserving assumption, the lung density changes in normoxic vs. hyperoxic breathing were adjusted using the sponge model5. The adjustments were performed spatially using the Jacobian determinant of the transformation det(JT), which was applied voxel-wise to correct T(V21), using $$$V_{21C}=T(V_{21})\cdot det(J_{T})$$$. PSE was then calculated as $$$PSE=\frac{V_{100}-V_{21C}}{V_{21C}}$$$. The lung masks were segmented from the hi-res V100 using a 3D region-growing algorithm written in Matlab6. Median PSE (MPSE) was measured as the median PSE within the segmented lung volume. Ventilation defects were quantified from PSE as ventilation defect percent (VDP) using adaptive K-means7.
The intra-subject repeatability was assessed for median PSE and measured VDP using Bland-Altman plots. For subjects scanned on separate visits, 3D rigid registration was performed on the two hi-res V100 volumes to assess spatial overlap of segmented defects using the Dice coefficient.
Results
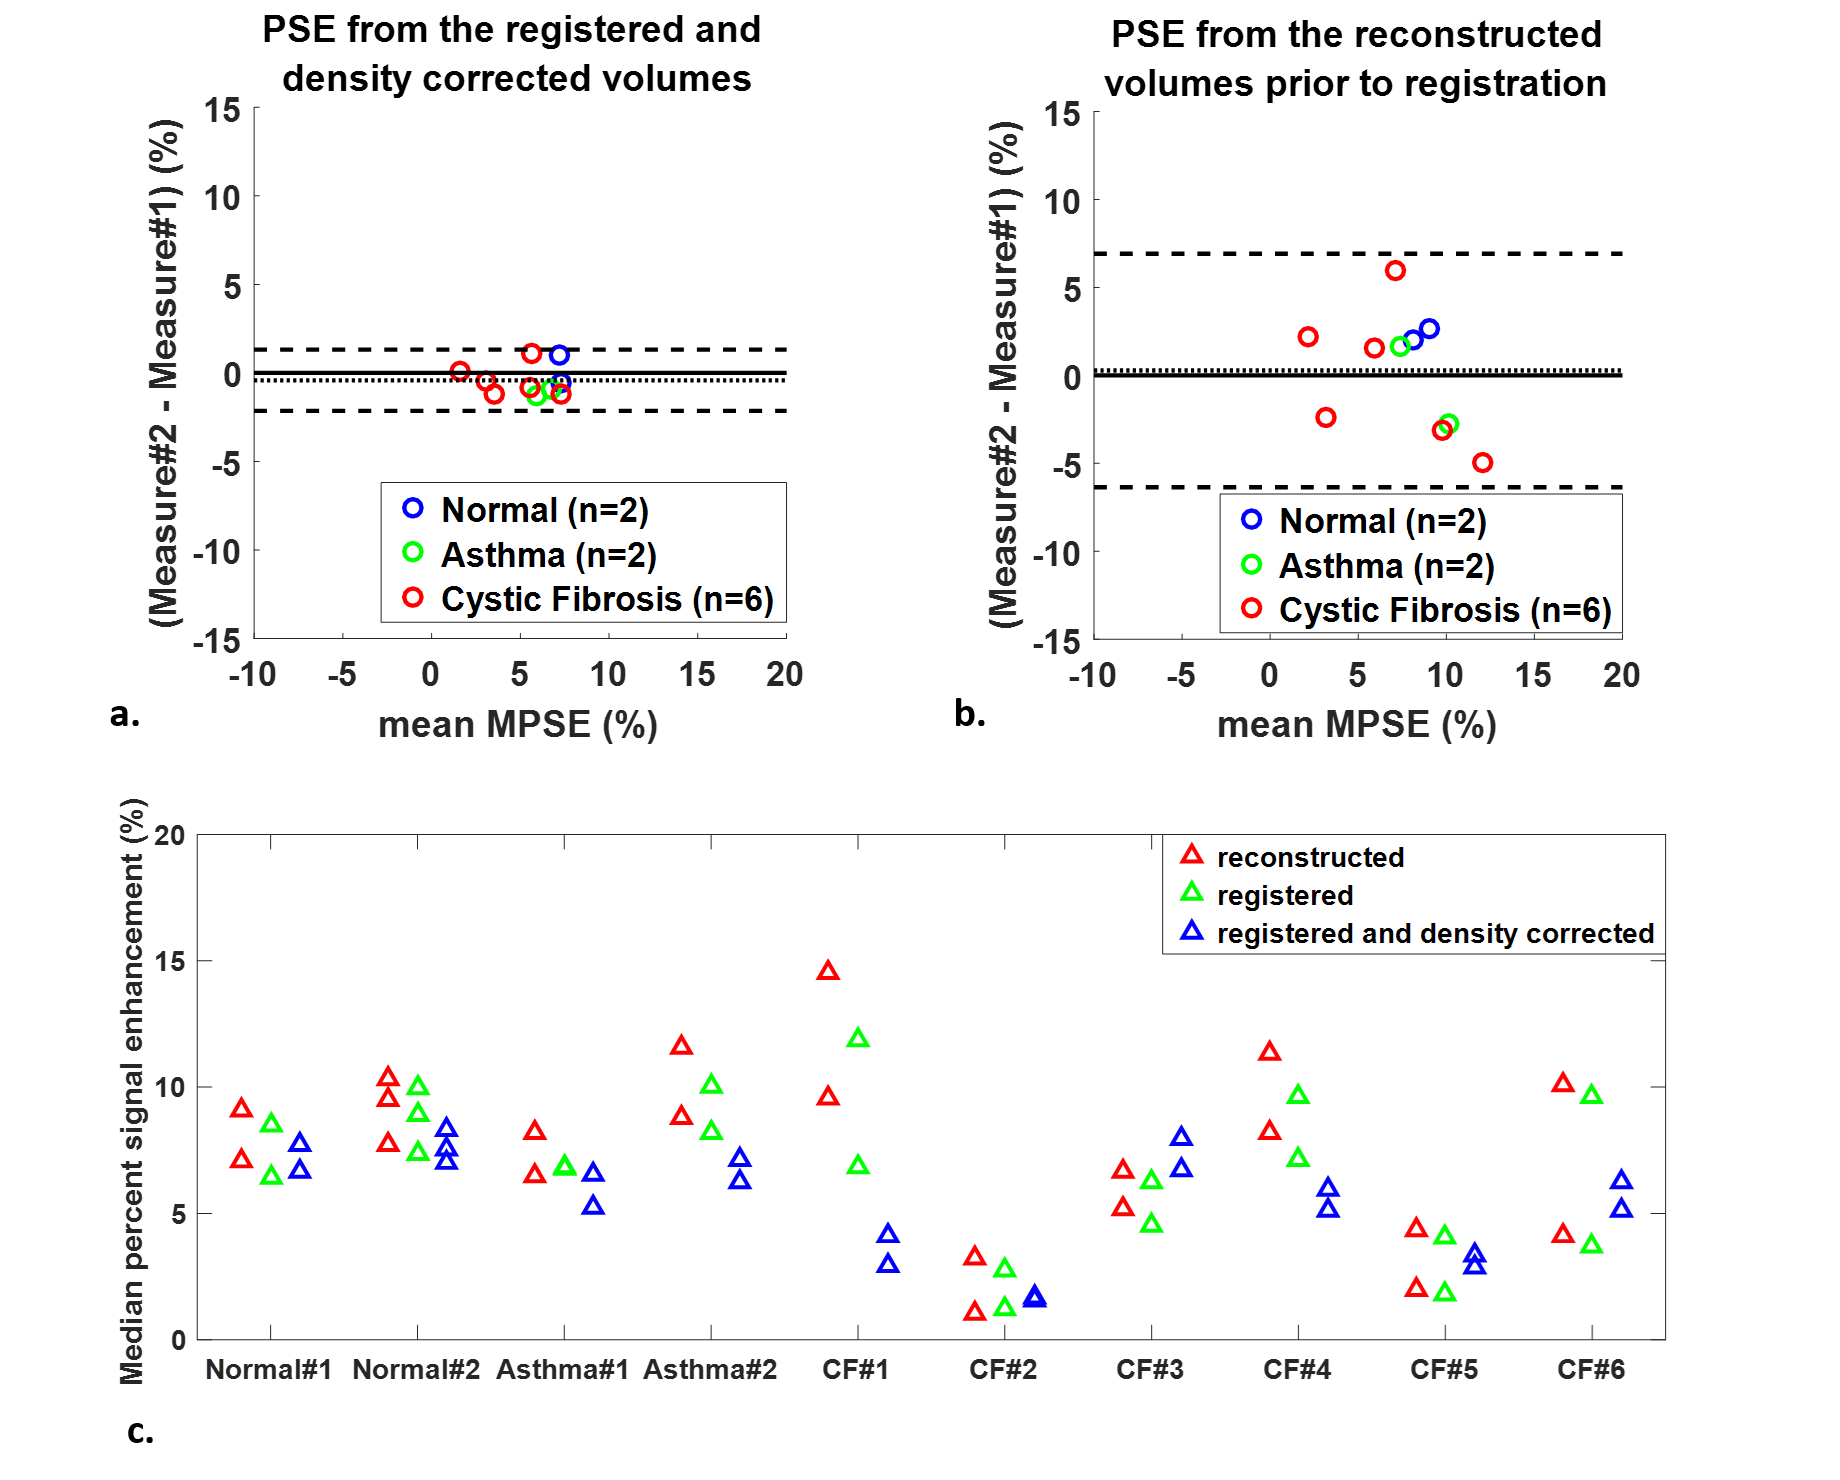
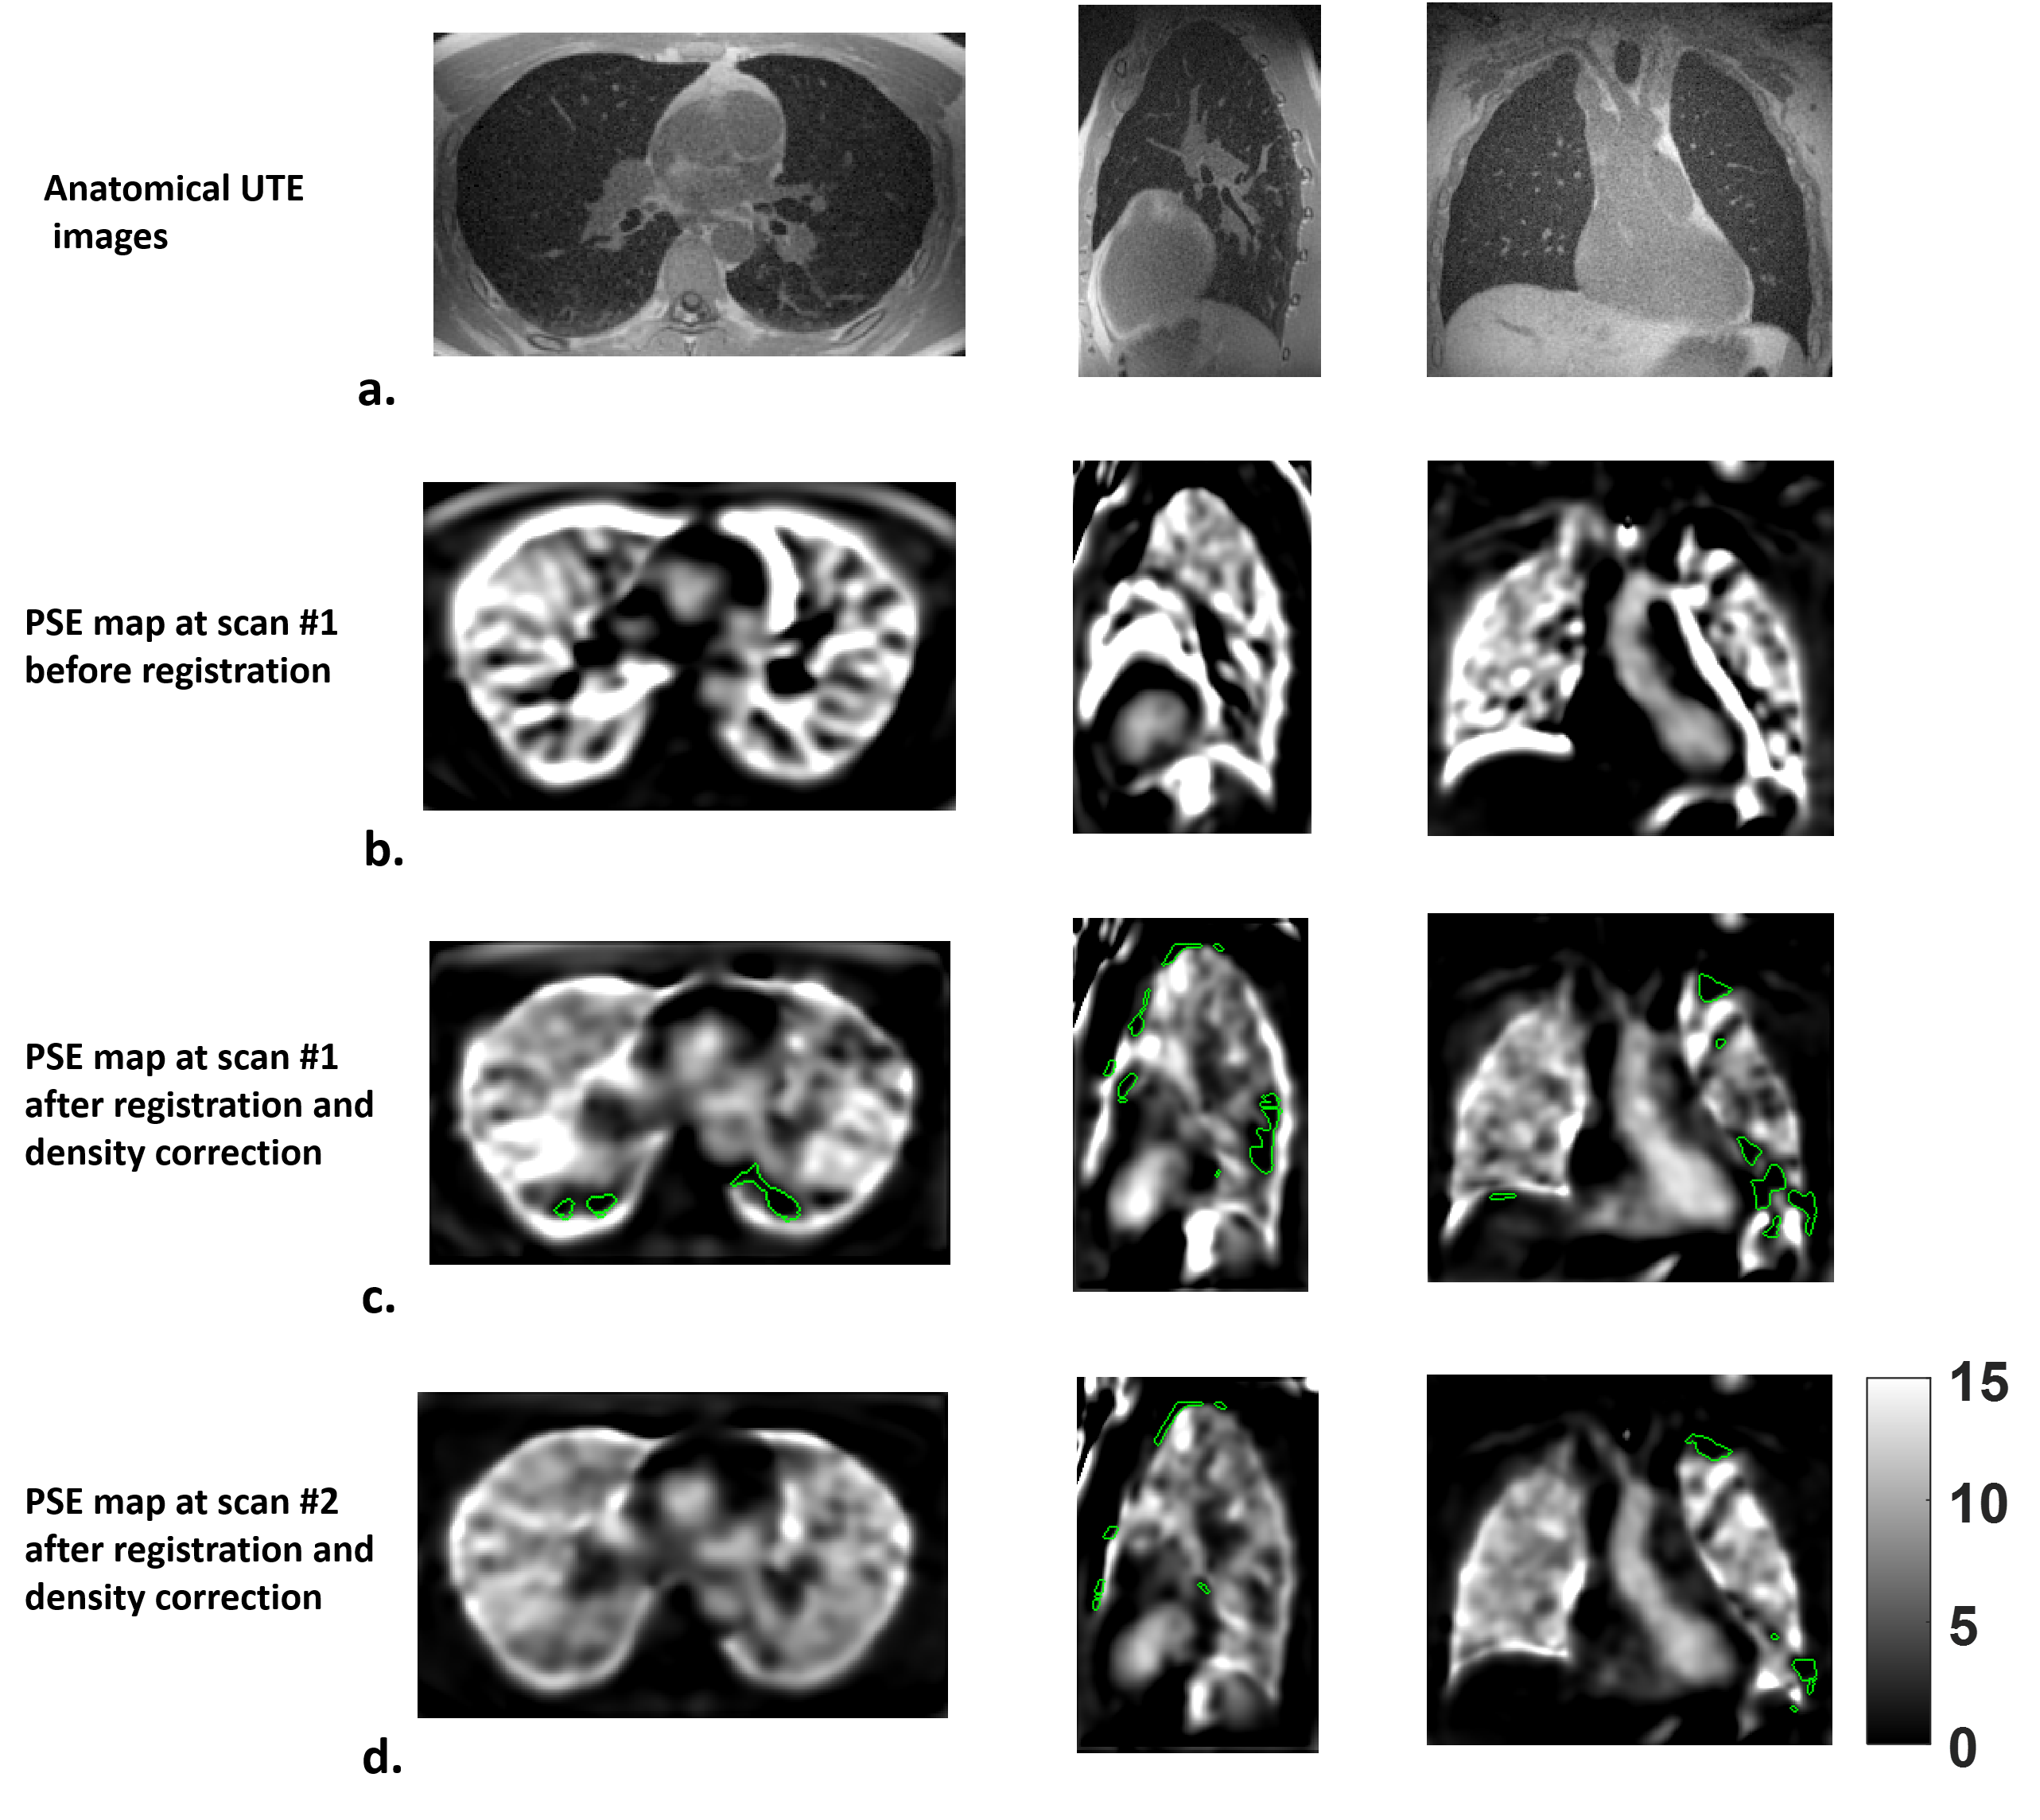
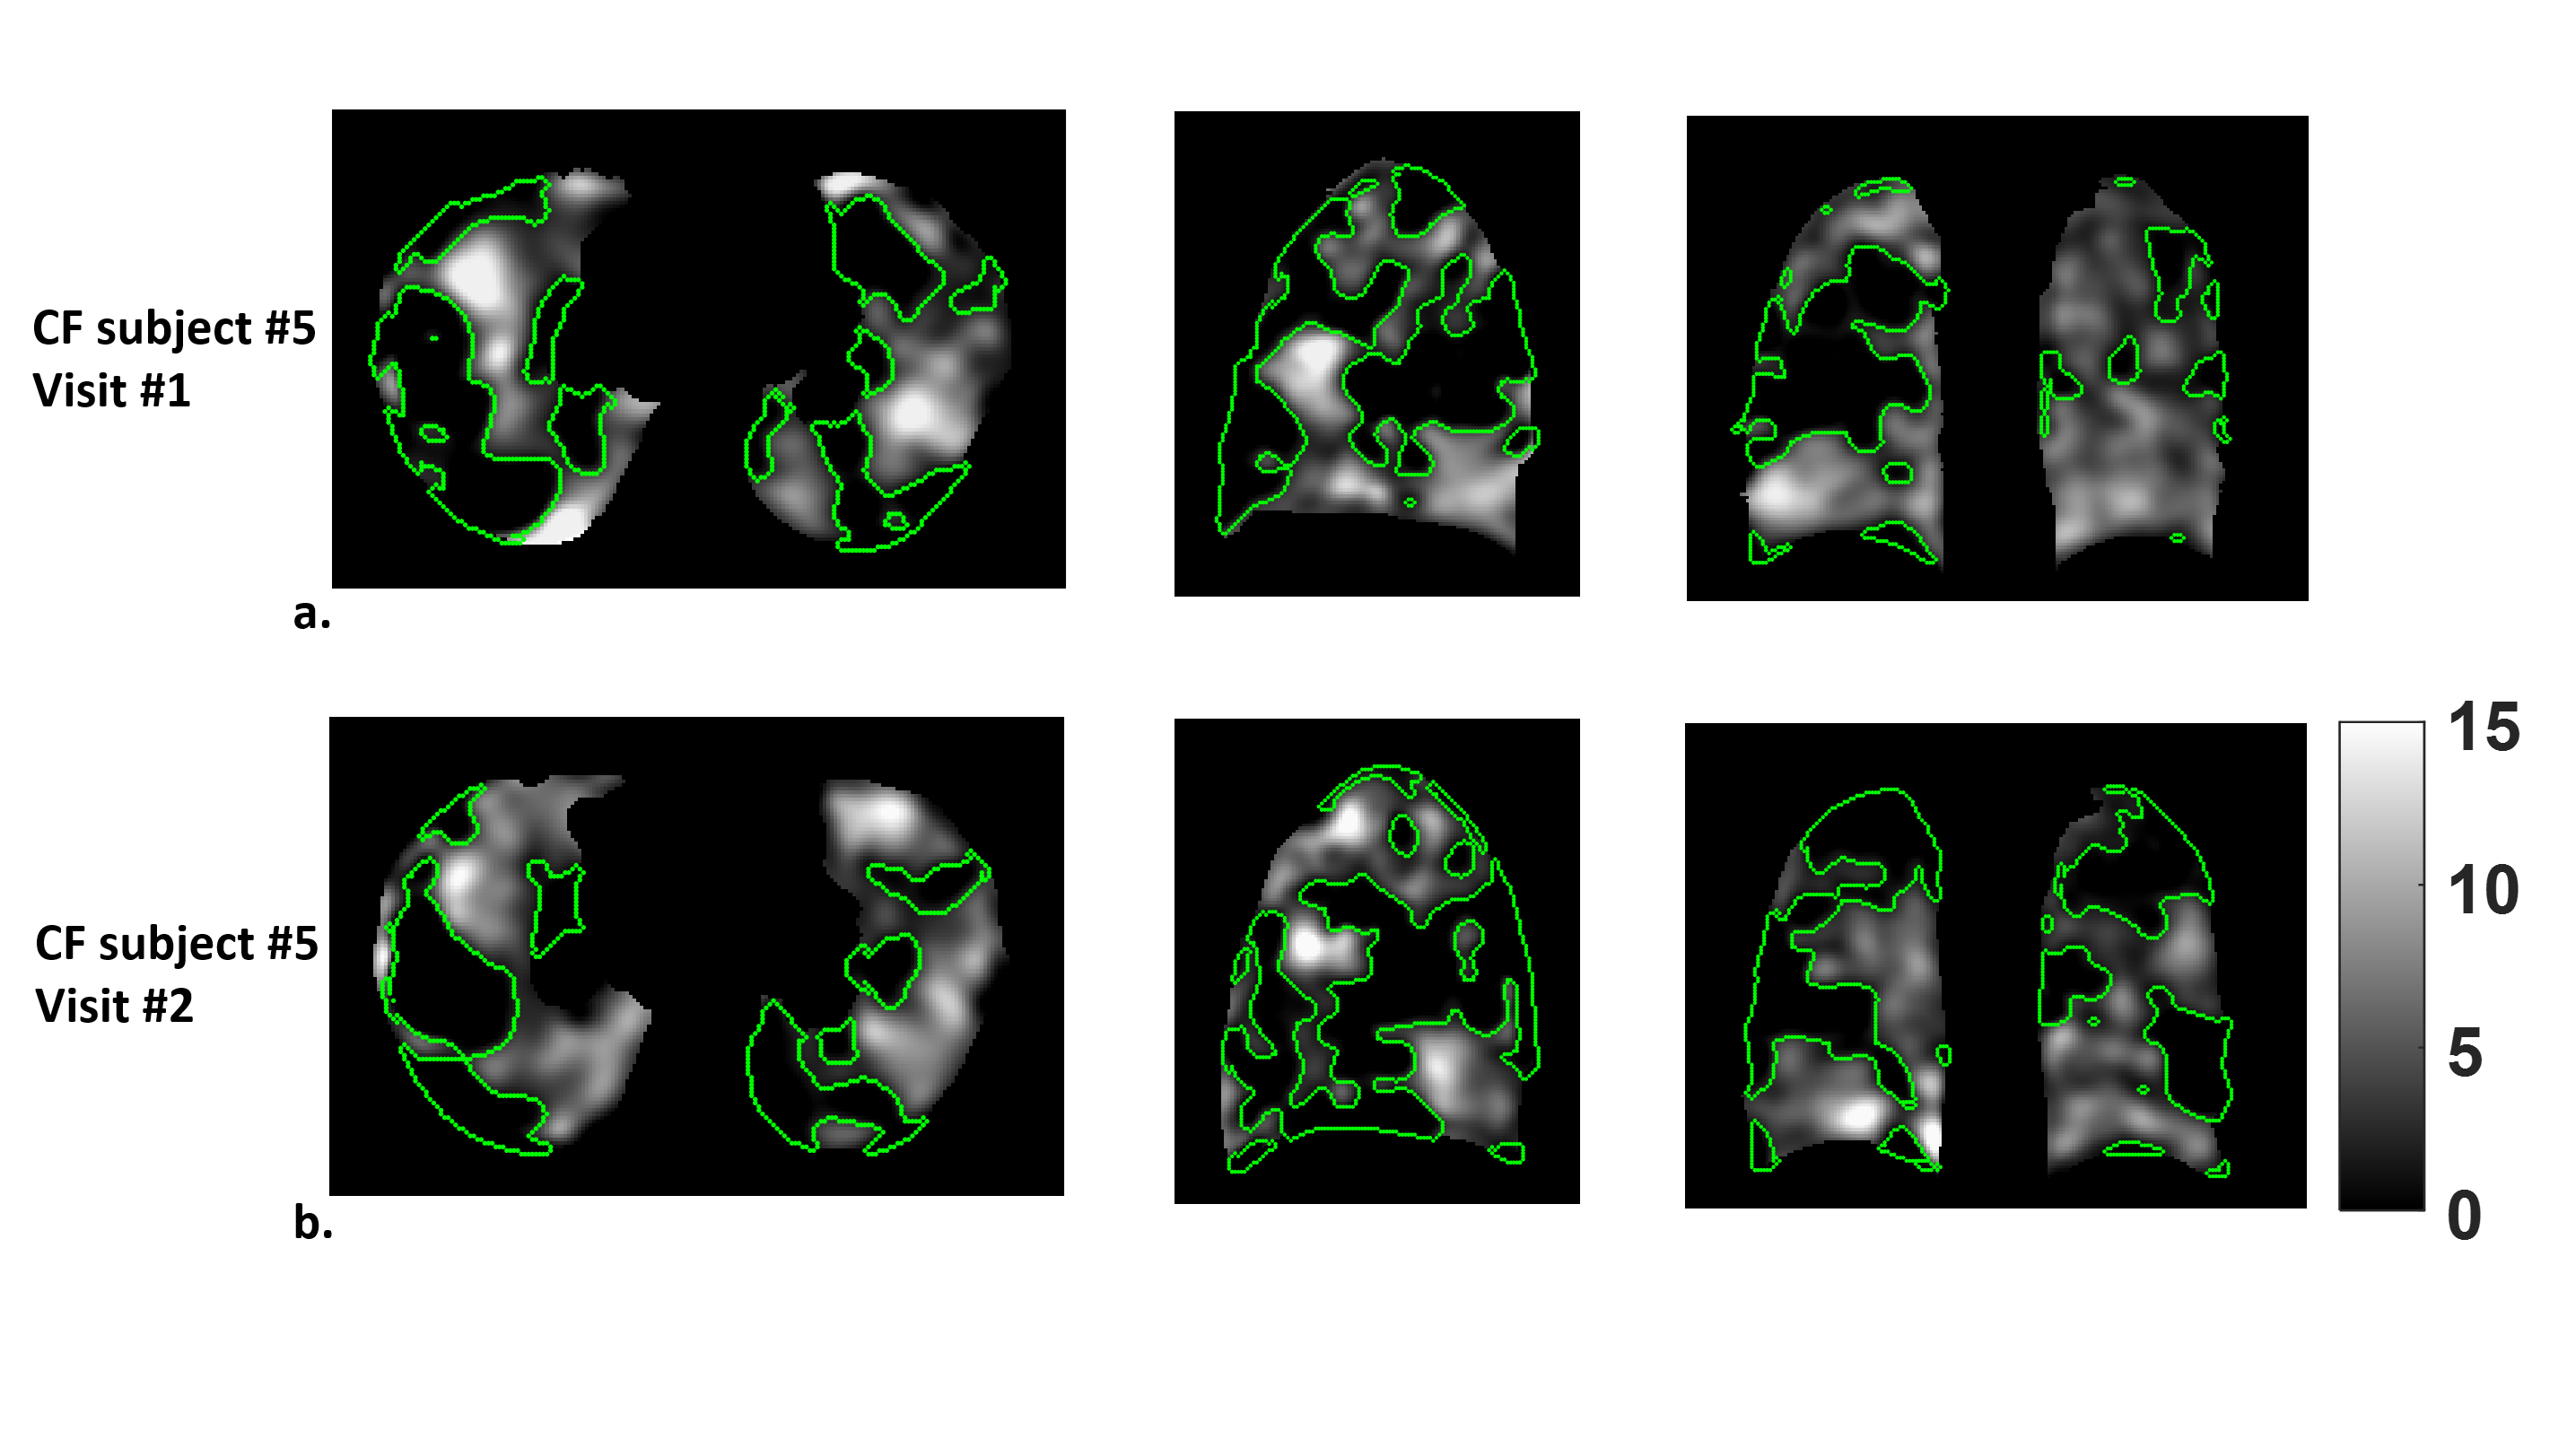
The intra-subject MPSE after registration and density correction (Fig.1a) showed considerably better 95% limits of agreement compared to that from the unregistered reconstruction (Fig.1b). The MPSEs measured from the registered volumes were lower than from the reconstructed volumes (p=0.0093) (Fig.1c) due to mitigation of false high enhancements on the lung periphery. The inter-scan PSE maps for the normal subject (Fig.2) showed similar enhancement variation patterns, whereas the inter-visit PSE maps both indicated focal ventilation defects for the CF subject (Fig.3).
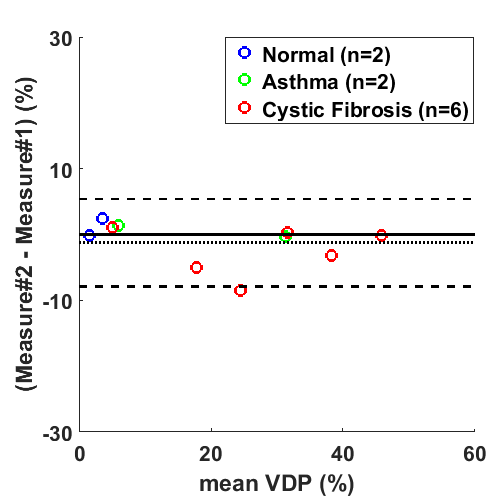
Bland-Altman plot showed an insignificant bias of 1.2% for the repeated VDP measures (Fig.4). However, inter-visit comparisons found only moderate spatial agreement of the segmented defects. The average Dice coefficients of the defects within the same subject were 0.20, 0.26, and 0.35 for the normal, asthma, and CF subjects.
Discussion
The deformable registration with density correction clearly improved the intra-subject agreement on MPSE. Moreover, we showed that VDP can be quantified from PSE map using a K-means classifier with negligible bias. Although the VDP showed good intra-subject agreement, Dice coefficients suggested low-to-moderate inter-visit spatial overlaps between defects. The different time intervals between scans may contribute to the variation in regional ventilation between visits. Motion artifact may also lead to some false defects which likely contributed to the modest Dice coefficient.
Two issues may further improve repeatability. First, CF subjects can have irregular tidal breathing patterns leading to data inconsistencies over the 3.5min scan time. For example, the bellows signal recorded within the acquisition window showed dramatic differences between V21 and V100 for visit#1 in CF subject#1. Using adaptive motion compensation or improving consistency of respiratory gating may mitigate this source of variation. Second, the 15-day time interval between scans may allow for genuine ventilation differences between visits, especially in asthma but possibly also in CF. Performing test/retest on the same visit will better assess repeatability of regional defects.
Conclusion
This initial evaluation of OE-MRI repeatability shows good agreement for global measures of MPSE and VDP with low-to-moderate spatial alignment of defects. The feasibility of defect quantification from the PSE parametric map shows promise for quantifying lung ventilation abnormalities using OE-MRI.Acknowledgements
The authors would like to acknowledge financial support from the Departments of Radiology and Medical Physics, and GE Healthcare.References
1. Kruger SJ, Nagle SK, Cadman R V, et al. Comparison of regional ventilation defect distribution between oxygen-enhanced and hyperploarized He-3 MRI. Proc Intl Soc Mag Reson Med. 2014;70.
2. Zha W, Kruger SJ, Cadman R V, et al. Severity Evaluation in cystic fibrosis using oxygen-enhanced MRI: comparison to hyperpolarized Helium-3 MRI. Proc Intl Soc Mag Reson Med. 2016;1626.
3. Kruger SJ, Fain SB, Johnson KM, et al. Oxygen-enhanced 3D radial ultrashort echo time magnetic resonance imaging in the healthy human lung. NMR in Biomedicine. 2014; 27(12):1535-41.
4. Tustison NJ, Avants BB. Explicit B-spline regularization in diffeomorphic image registration. Front Neuroinform. 2013;7:39.
5. Staring M, Bakker ME, Stolk J, et al. Towards local progression estimation of pulmonary emphysema using CT. Med Phys. 2014;41:21905.
6. Matlab v9.0.0, THe MathWorks, Natick, MA.
7. Zha W, Niles DJ, Kruger SJ, et al. Semiautomated ventilation defect quantification in exercise-induced bronchoconstriction using hyperpolarized helium-3 magnetic resonance imaging: a repeatability study. Acad Radiol. 2016; 23(9):1104-14.
Figures