3304
Metabolomic Analysis by HRMAS-MRS: Preliminary Study for Tumor DiagnosisFrancesco L Palmas1,2, Sarah L Prophet3, Lindsey L Vandergrift3, Taylor L. Fuss3, Shulin Wu3, Chin-Lee Wu3, Adam Feldman3, and Leo L. Cheng3
1Pathology, Massachusetts General Hospital, Charlestown, MA, United States, 2Chemical and Geological Sciences, University of Cagliari, Cagliari, Italy, 3Massachusetts General Hospital, Charlestown, MA, United States
Synopsis
Kidney cancer is the third most common genitourinary malignancy in the US and leads to over 14,000 deaths and over 61,000 new cancer diagnoses per year. Since metabolic pathways affect the development of several malignancies, MRS was applied to highlight the existing alteration between adjacent benign and cancer tissues. Furthermore, comparison of fresh-frozen paired samples was performed to assess whether such strategy may interfere and deliver different results. This approach was able to discriminate according to pathological condition (benign-tumor) and showed no significant differences in fresh-frozen pairs.
Introduction
Kidney cancer is the third most common genitourinary malignancy in the US and leads to over 14,000 deaths and over 61,000 new cancer diagnoses per year.1 Magnetic resonance spectroscopy (MRS) has the potential to characterize the metabolic profiles in tissues and certain biofluids. Since metabolic pathways play a critical role in the development of several clinical conditions, highlighting such pathways in renal cell carcinoma (RCC) may help to improve diagnostic approaches. Indeed, together with ever increasing interests in multi-modality imaging, MRS applied to onco-metabolomics has shown promising results in detecting malignancy, predicting tumor stage, and evaluating potential aggressiveness. The aims of the project are to characterize the metabolic pattern of RCC specimens and to underline biochemical differences that may help to distinguish benign from tumor tissues, and to test whether frozen samples may deliver same results as fresh ones. All are necessary for the discovery of biomarkers to be translated to in vivo platforms, and improve clinical practice.Methods
Sixty-seven frozen (48 tumors and 19 adjacent benign) and 13 fresh-frozen paired kidney biopsy samples were analyzed through intact tissue MRS. MRS was performed with high-resolution magic angle spinning (HRMAS) method on a Bruker AVANCE spectrometer operating at 600 MHz. A 4 mm zirconia rotor was used with Kel-F inserts to generate a 10 μL sample space, and D2O was added for field locking. Spectra were recorded at 4 ºC with spinning rate at 3600 Hz, and processed using an in-house developed MatLab based program. 58 spectral regions were identified, normalized by the metabolic region resonance from 0.5 to 4.5 ppm, and evaluated.Results
ANOVA allowed for the separation between adjacent benign tissues and tumor samples highlighting 8 significantly changing regions, while PCA showed 3 statistically different principal components (Table 1). The tissue MRS analyses of fresh and frozen samples present no significant difference in any spectral region (Figure 1).Discussion
Besides the region between 1.93 and 1.92 ppm, a decrease in spectral intensity is observe for the cancer samples when compared to adjacent benign ones. This may be explained by higher consumption of the relative metabolites by the tumor cells. The same trend in noticed for PCs 4 and 10, while 5 seems to be overregulated in benign tissues. The absence of significant difference between frozen and fresh specimens may be indicative of appropriate preservation strategies as well as the stability of such tissues that allows for metabolomic evaluations of previously banked tissue samples.Conclusions
This preliminary study provides promising results for a further exploration of RCC characterization through HRMAS MRS technique. The possibility to separate benign from cancer tissue by their metabolic profile may be translated in in vivo platforms. In turn, this will help diagnosis in clinical practice, hence allowing for early diagnosis and preventing potential overtreatment. After MRS, samples will be evaluated with quantitative histopathology to correlate Furhman and TMN scores with metabolic changes. Furthermore, a larger sample size will be analyzed to produce a more robust model.Acknowledgements
Francesco Palmas gratefully acknowledges Sardinia Regional Government (F.S.E. 2007-2013 UniCa) for the financial support of his PhD scholarship (P.O.R. Sardegna F.S.E. Operational Program of the Autonomous Region of Sardinia, European Social Fund 2007– 2013—Axis IV Human Resources, Objective l.3, Line of Activity l.3.1.). Authors acknowledge support by NIH grant CA115746 and the A. A. Martinos Center for Biomedical Imaging.References
1. Siegel RL, Miller RL, Jemal A. Cancer statistics, 2015. CA Cancer J Clin. 2015; 65(1):5-29.Figures
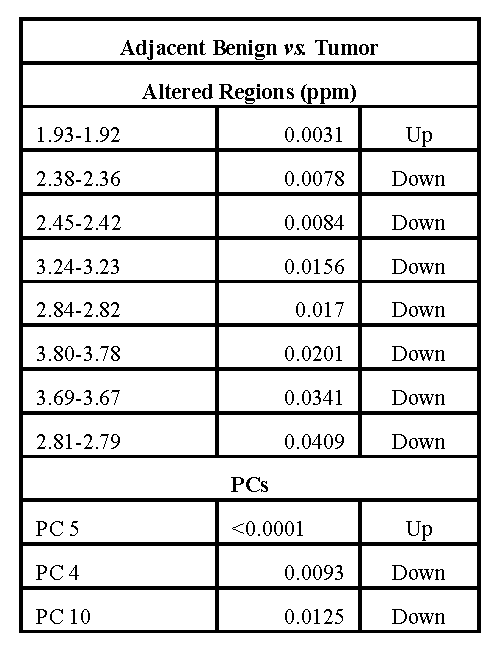
Table 1. Altered regions and PCs with relative p values
for the comparison of adjacent benign samples and tumor specimens.
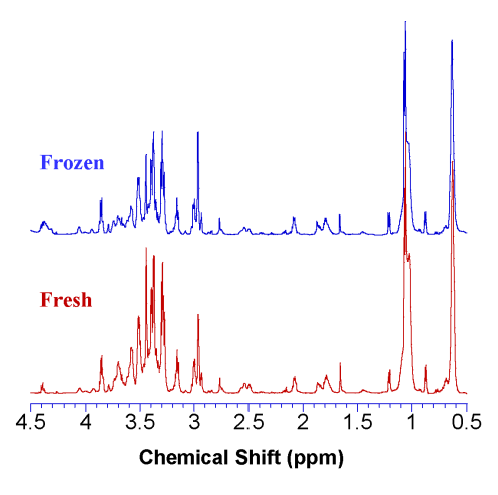
Figure 1. Comparison of spectra from a
frozen (blu) and fresh (red) sample.