3303
Detectability of oxygen saturation in renal blood using intravoxel incoherent motion (IVIM) imaging1Radiology, Tohoku University Hospital, Sendai, Japan, 2Diagnostic Radiology, Tohoku University Hospital, Sendai, Japan, 3Graduate School of Medicine, Tohoku University, Sendai, Japan
Synopsis
IVIM imaging acquired with two echo times may provide transverse relaxation time of blood fraction, which can be converted to blood oxygen saturation. We confirmed consistent increases in the renal blood oxygen saturation estimated by this method after an oral water load. IVIM imaging may become a non-invasive method to estimate blood oxygen saturation in kidneys.
PURPOSE
Noninvasive in vivo measurement of oxygen (O2) saturation in renal blood is desirable for clinical practice. Potential application of intravoxel incoherent motion (IVIM) imaging for kidneys includes estimation of parenchymal blood O2 saturation1. Previous studies2 showed that renal blood O2 saturation increases with an oral water load. The purpose of this study is to confirm the ability of IVIM imaging to detect the change in renal blood O2 saturation with an oral water load.
METHODS
Three healthy volunteers (age, 30-, 41-, and 51-years old) were scanned before and 30-50 min after oral intake of 1.2-1.5 L water with a 3.0T MR system (Achieva d-Stream, Philips Healthcare, Best, the Netherlands) with 32ch ds-Torso and 32ch Posterior coils. FLAIR-DWI and spin-echo (SE)-based DWI with short and long TE were imaged in coronal plane with free breathing. Basic imaging parameters were: slice thickness = 8 [mm], number of slice = 1, acquisition matrix = 65x112, FOV = 230 [mm], number of signal averaged=15, b=0, 250, 500 [s⋅mm-2]. Imaging parameters of FLAIR-DWI were: TR/ TEshort/TElong = 5500/59/84 [ms] and TI =2000[ms]. Imaging parameters for SE-based DWI were: TR/TEshort/TElong = 3000/59/84 [ms]. A 3-compartment (renal tissue, blood, glomerular filtrates) model was considered.
Definition of parameters
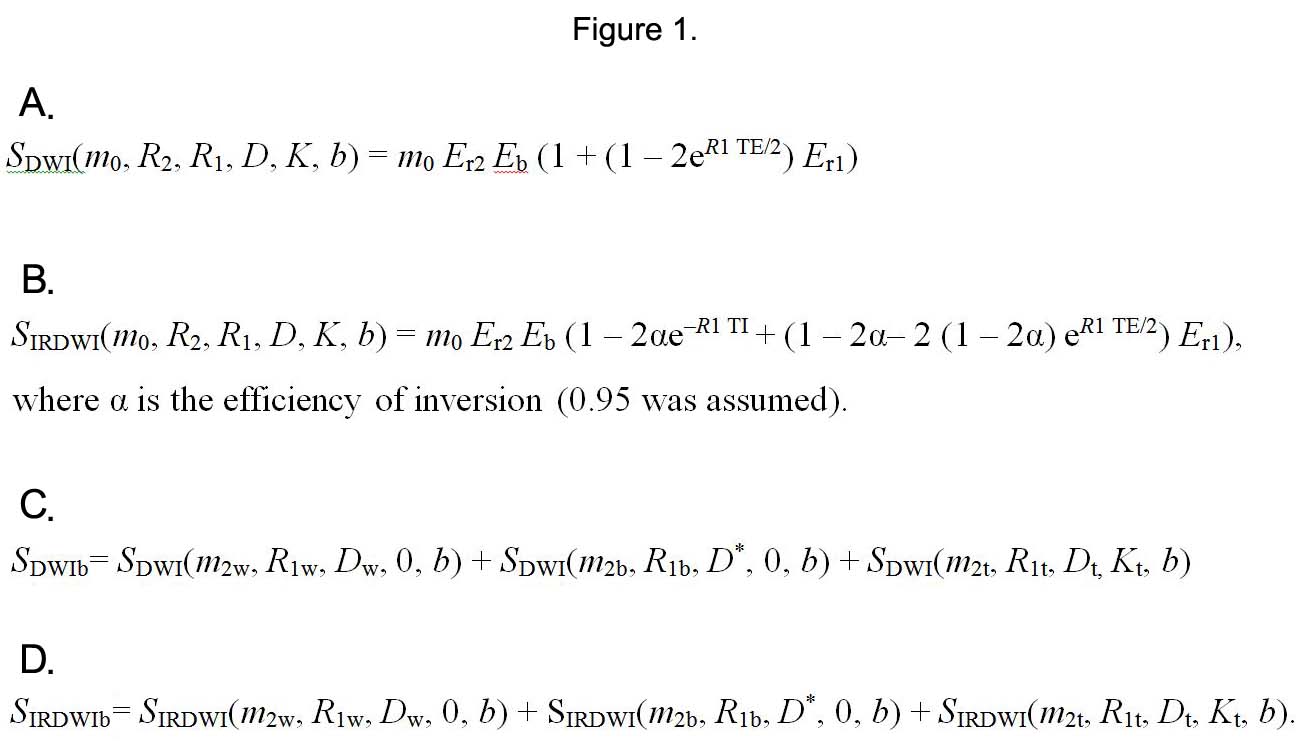
Longitudinal relaxation rates: R1t for renal tissue, R1b = 0.58 [s-1] for blood3, R1w = 0.234 [s-1] for water4. Transverse relaxation rates: R2t for renal tissue, R2b for blood, R2w for water. Apparent diffusion coefficients: Dt for renal tissue, D* for blood. Constants proportional to proton density: m0t for renal tissue, m0b for blood, m0w for water. Signal obtained with DWI can be expressed as the formula A (Figure 1A), where Er2 = e–R2 TE, Eb = e–bD + K bbDD/6, Er1 = e–R1 TR. Signal for IRDWI is expressed as the formula B (Figure 1B). Because m0 Er2 always appears, we define m2 = m0 Er2. We adopt a 3-compartment model so that the signal obtained with DWI can be expressed as the formula C (Figure 1C), and that with IRDWI can be expressed as the formula D (Figure 1D).
Data processing
The processing was performed on offline personal computers with Mathematica10 (Wolfram Research, Champaign, IL). IRDW images and DW images with long TE were registered to DW images with short TE using affine transformation. Then, the following processing was performed.
1. Eight image data sets (DW images and IRDW images with short TE and long TE, b = 250 and 500 for each image) were used to calculate m0, R1t, R2t and Dt; K was set as 0; signals from moving blood and glomerular filtrates were ignored at b≥250.
2. With parameters obtained from the above 1, 4 image data set (DW images and IRDW images with short TE and long TE, b = 0 for each image) were used to calculate m0w, m0b and R2b.
3. Blood O2 saturation (Y) was estimated from R2b using the formula for τCPMG = 20 ms by Lu, et al5.
Statistical analysis
A total of 6 kidneys were analyzed. Regions of interest (ROI) on Y map were set for renal cortical and medullary regions with use of R1t and m0b maps. Mean values of Y for the ROIs before and after water load were compared using a paired t-test. To accommodate the use of bilateral kidneys per person, the paired t-test was performed using the bootstrapping method with 1000 samples each. Statistical computations were performed using SPSS 22.0 (SPSS, Chicago, IL). P<0.05 indicated statistical significance.
RESULTS
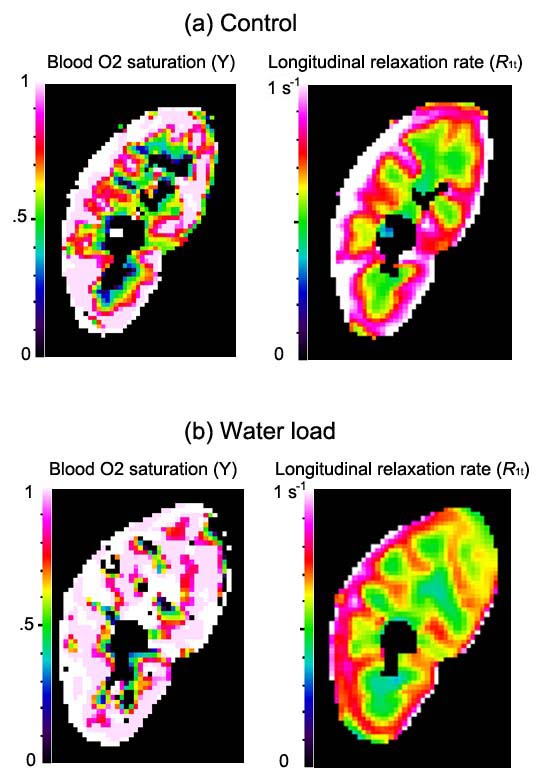
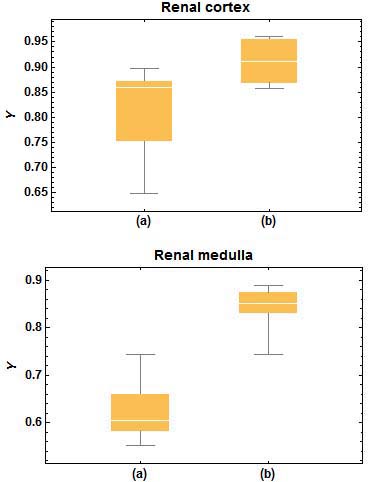
Increase in Y and decrease in R1t were visually observed after water load in each kidney (Figure 2). Figure 3 shows box-whisker charts of mean values of Y for the ROIs (a) before and (b) after water load. In the medulla, the mean values of Y were significantly elevated after water load (P =0.021). In the cortex, they demonstrated a tendency to be elevated (P = 0.105).
DISCUSSION
Renal blood O2 saturation estimated by transverse relaxation time of blood fraction with IVIM imaging was elevated after water load. That indicates detection of O2 saturation in renal blood is feasible. Transverse relaxation time was estimated by use of single-echo two-dimensional DWI acquired with two echo times (59/84 ms). Therefore, R2 values maybe overestimated because of diffusion on transvers relaxation especially on long-TE acquisition. Consequently, estimated O2 saturation may be underestimated.
CONCLUSION
IVIM imaging may become a non-invasive method to estimate blood O2 saturation in kidneys.Acknowledgements
No acknowledgement found.References
1. Nagasaka T, Ota H, Tamura, H. Estimation of Oxygen Saturation in Renal Blood Using Intravoxel Incoherent Motion (IVIM) Imaging by FLAIR DWI. ISMRM Proc 2016:3900.
2. Vivier PH, Storey P, Chandarana H, et al. Renal Blood Oxygenation Level–Dependent Imaging: Contribution of R2 to R2* Values. Invest Radiol 2013;48:501-508.
3. Shimada K, Nagasaka T, Shidahara M, et al. In vivo measurement of longitudinal relaxation time of human blood by inversion-recovery fast gradient-echo MR imaging at 3T. Magnetic Resonance in Medical Sciences 2012;11:265–71.
4. Abbas Z, Gras V, Möllenhoff K, et al. Analysis of proton-density bias corrections based on T1 measurement for robust quantification of water content in the brain at 3 Tesla. Magn Reson Med 2014;72:1735–45.
5. Lu H, Xu F, Grgac K, et al. Calibration and validation of TRUST MRI for the estimation of cerebral blood oxygenation. Magn Reson Med 2012;67:42–9.
Figures