3302
Phosphorescence Lifetime Imaging to validate BOLD MRI Derived blood PO21Northwestern University, Evanston, IL, United States, 2University of Illinois at Chicago, 3NorthShore University HealthSystem, 4University of Chicago
Synopsis
BOLD MRI measurements are the only non-invasive method sensitive to renal oxygenation. In a previous study we showed that BOLD MRI measurements can be combined with a statistical model to estimate renal oxygenation in rat kidneys. In this study, we examine the use of phosphorescence lifetime imaging (PLI) as a potential method for refining the model. It is important to differentiate between blood and tissue PO2, which is a key benefit of PLI. We found that the PLI is sensitive to changes following LNAME. However, the absolute PO2 values were lower than those estimated by BOLD MRI and possible reasons are discussed.
Introduction
Methods
To-date, 3 male Sprague-Dawley rats (Charles River, Chicago, IL), weighing 506 +/- 94g, were used in this study. All procedures were conducted under anesthesia (thiobutabarbital sodium, 100 mg/kg i.p.). A catheter was placed in the femoral vein of each rat for administration of L-NAME (10 mg/kg body weight). The left kidney was exposed and decapsulated. An oxygen-sensitive molecular probe (Pd-porphyrin, Oxyphor R0) was dissolved in bovine serum albumin (60 mg/mL) and administered through the catheter (20mg/kg). Body temperature was maintained at 37oC. PO2 was measured at baseline and following L-NAME (0, 10 and 20 min post injection).
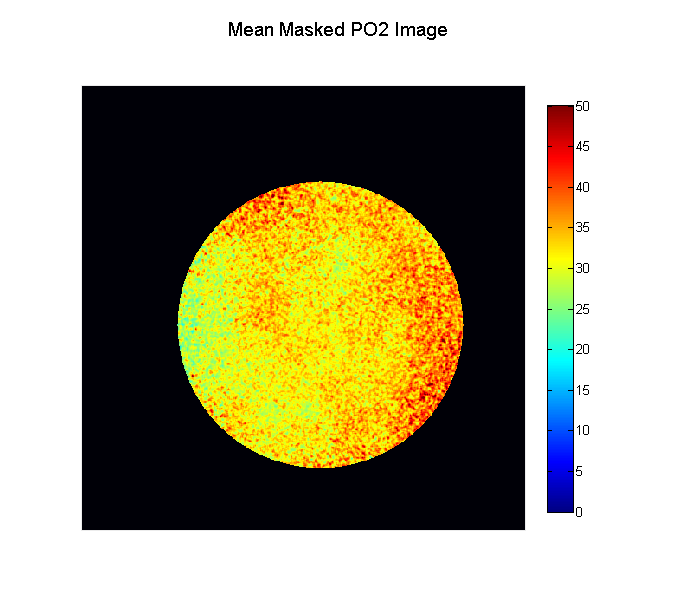
A previously established phosphorescence lifetime imaging system (4,5) was modified for renal PO2 (rPO2) imaging. Ten phase-delayed images were acquired with 3 repeated sets. Phosphorescence intensity images were smoothed using a 3 pixel isotropic filter and pixel-wise phosphorescence lifetime was measured using a frequency-domain approach (3). rPO2 was then calculated using the Stern-Volmer equation. A region of interest centered in the imaged area was selected and the mean and standard deviation of rPO2 was calculated.
A two-sided paired T test was performed between baseline and post-L-NAME measurements across all rats. Values are reported as mean +/- standard deviation and p-values are considered significant when p < 0.05. Correction for multiple comparisons was made using a Bonferroni procedure to control the familywise error rate. Cohen's d-value is reported as well.
Results
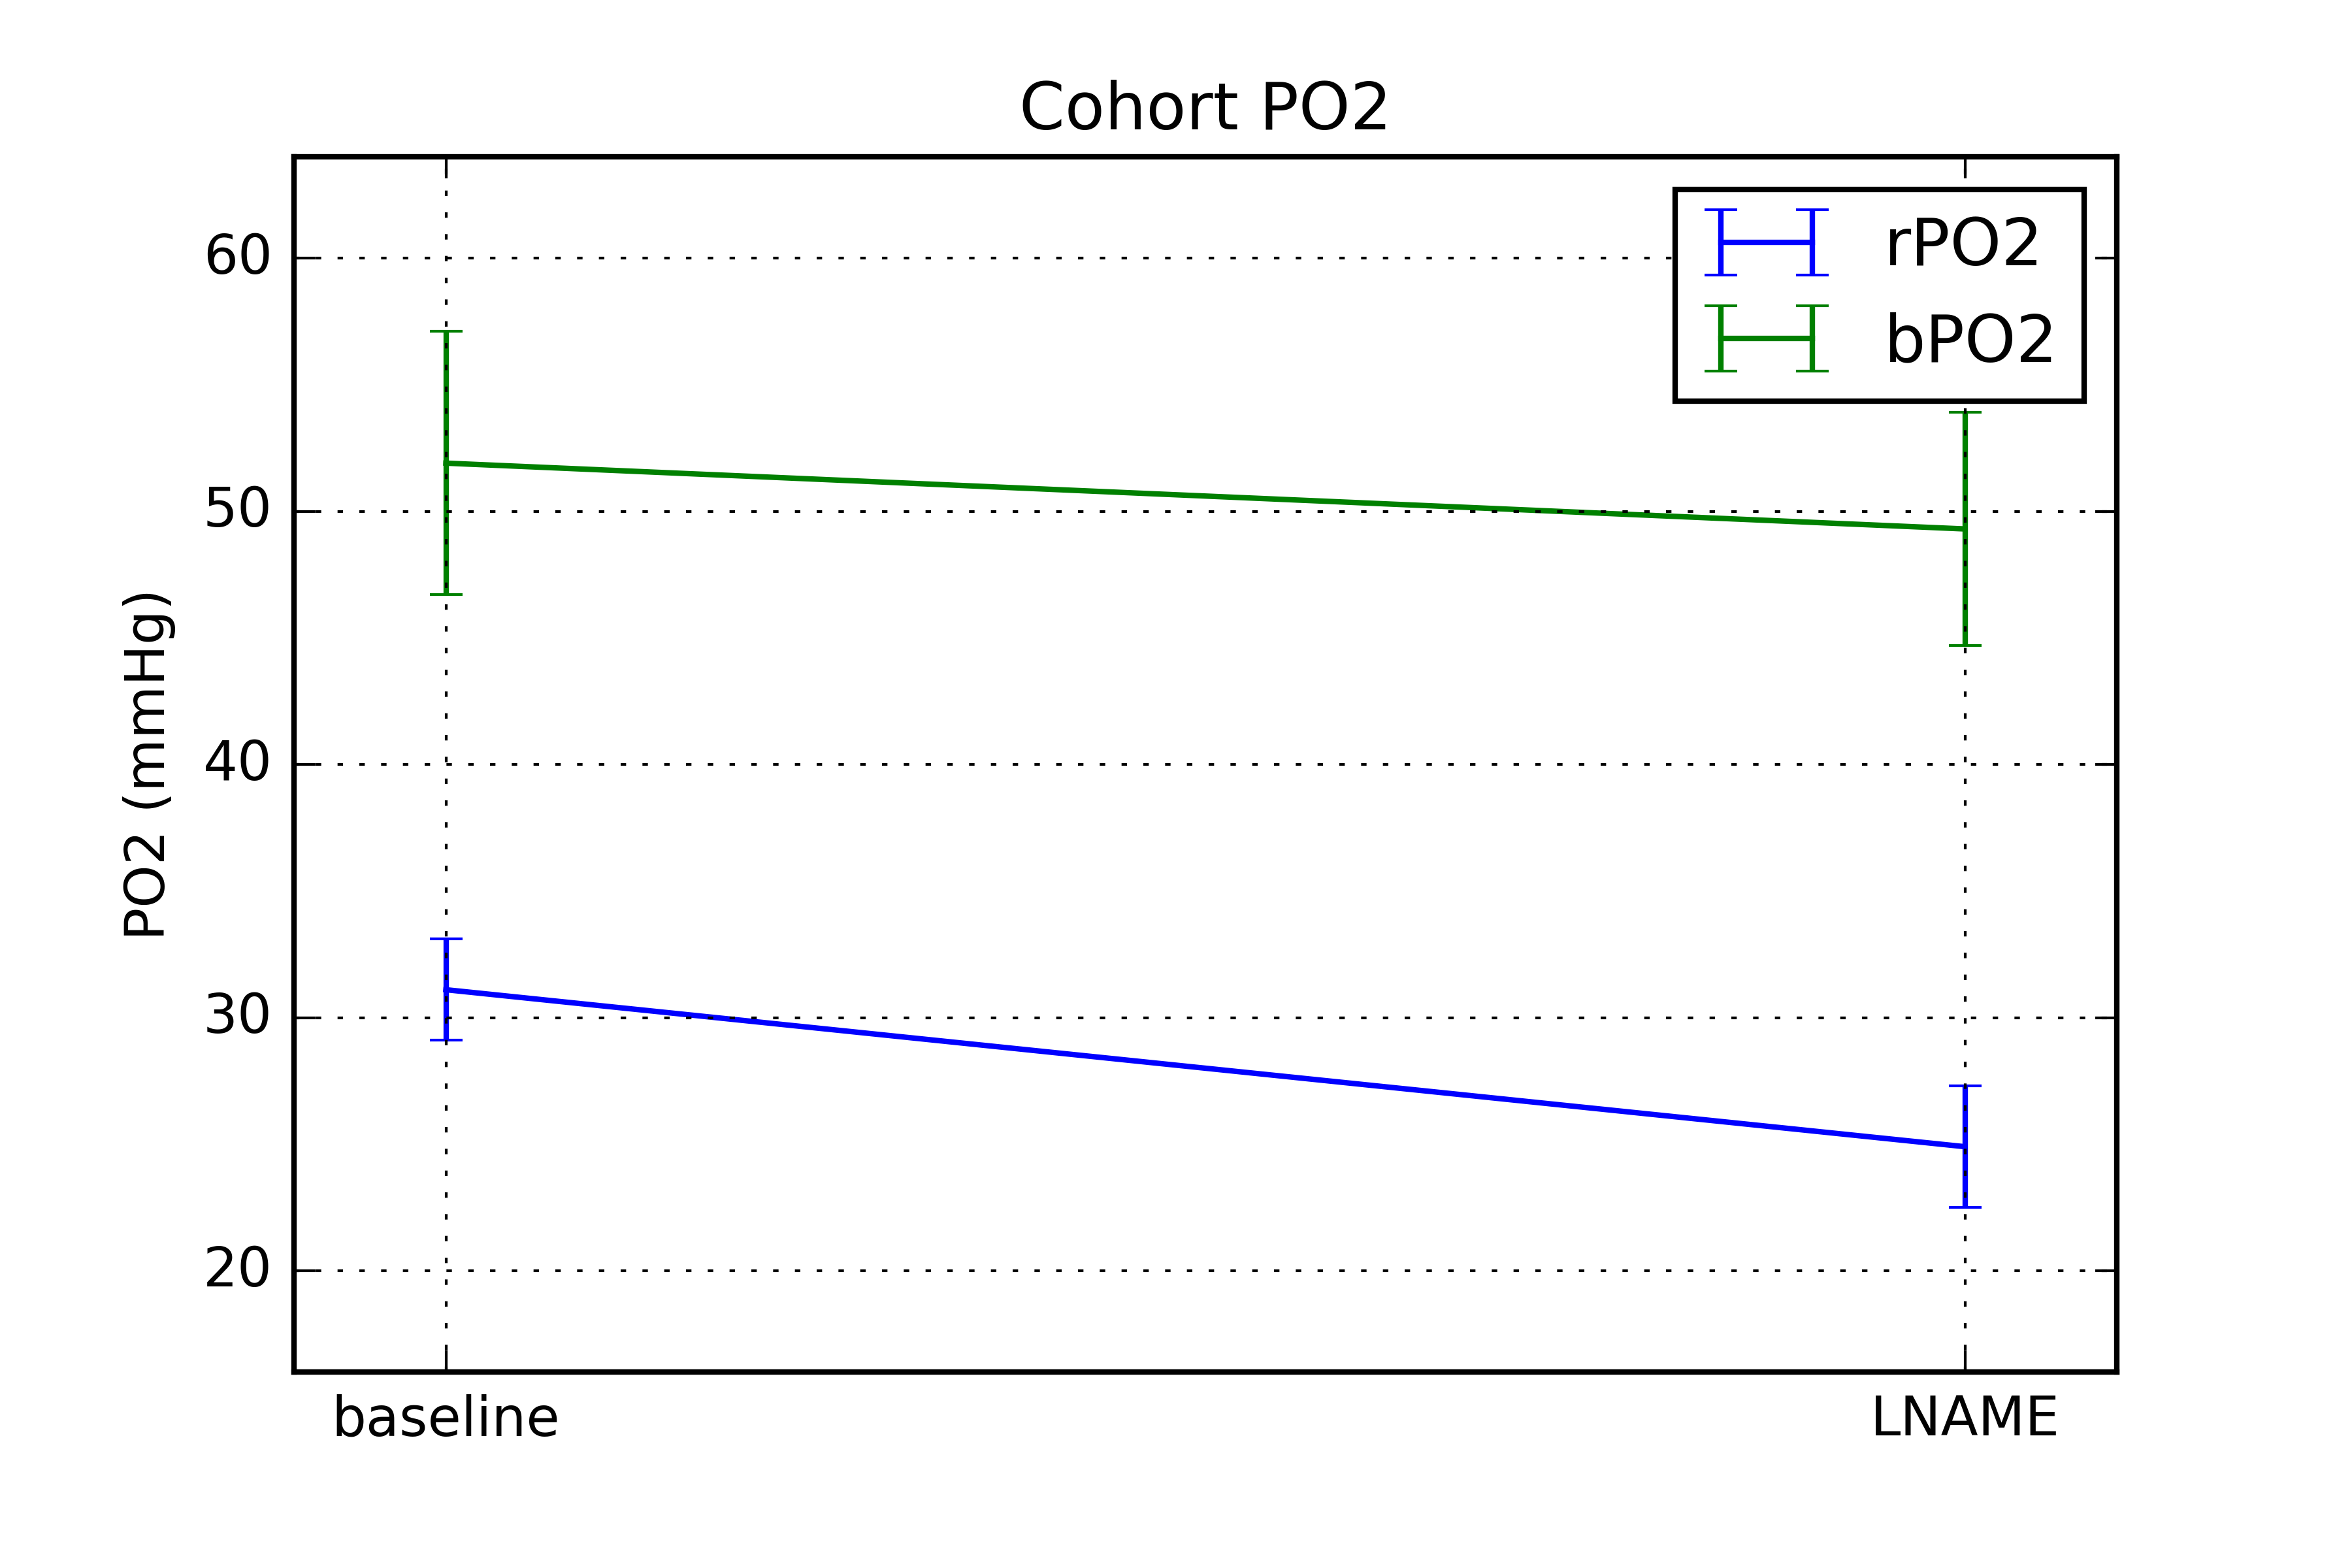
rPO2 across the rat cohort was found to be 31.1 +/- 2.0 mmHg at baseline, 29.8 +/- 11.4 mmHg at the first post-LNAME time point, and 24.9 +/- 2.4 mmHg at the final time point. A significant change was observed between baseline and the final time point of L-NAME (p = 0.045, d = 2.94). No significant change was observed between any other time points. Figure 1 shows an example of the phosphorescence lifetime image.Discussion & Conclusions
The baseline blood rPO2 measured here is in agreement with an earlier report (6). Figure 2 shows rPO2 data from this study along with bPO2 estimates based on previous BOLD MRI study (2). bPO2 estimates were higher than rPO2 and the change following L-NAME did not reach significance, though it did show a downward trend. This may be a limitation in the sensitivity of the bPO2 estimates based on the BOLD MRI model. It was assumed that fractional blood volume does not change between baseline and following LNAME. LNAME is known to reduce fractional blood volume through vasoconstrictive mechanisms. While decreased oxygenation will increase R2’, a simultaneous decrease in fractional blood volume will decrease R2’ and result in a muted apparent response to L-NAME. It is possible to estimate changes in fractional blood volume following L-NAME using an intravascular contrast agent (7). It is also possible that using measured fractional blood volume may allow for improved baseline bPO2 estimate.
There may be other practical reasons for the observed differences in rPO2 and bPO2. For logistical reasons, these two measurements were performed in a different group of animals. Also, BOLD MRI measurements were performed in intact animals, while rPO2 measurements were performed in exteriorized kidney. The penetration depth of the laser is less than 1 mm from the surface of the kidney and hence reflect the measurements in the cortex. bPO2 on the other hand is subject to partial volume effects with the medulla.
Overall, these preliminary data with PLI are promising and in combination with measured fractional blood volume and hematocrit values may allow more accurate calibration of the BOLD MRI derived blood PO2 estimates.
Acknowledgements
This study was supported in part by NIH grants EY017918 and EY001792, Senior Scientific Investigator award (MS) and an unrestricted departmental grant from Research to Prevent Blindness. JT was supported by a pre-doctoral fellowship from the NIH, F31 HL123360.References
1. Zhang JL, Morrell G, Rusinek H, Warner L, Vivier P-H, Cheung AK, Lerman LO, Lee VS. Measurement of renal tissue oxygenation with blood oxygen level-dependent MRI and oxygen transit modeling. Am. J. Physiol. Renal Physiol. [Internet] 2014;306:F579-87. pmid:24452640.
2. Thacker J, Zhang JL, Franklin T, Prasad P. BOLD quantified renal pO2 is sensitive to pharmacological challenges in rats. Magn. Reson. Med. [Internet] 2016;0:1–6.
3. Lakowicz JR, Szmacinski H, Nowaczyk K, Berndt KW, Johnson M. Fluorescence lifetime imaging. Anal. Biochem. [Internet] 1992;202:316–30. pmid:1519759.
4. Shahidi M, Shakoor A, Blair NP, Mori M, Shonat RD. A method for chorioretinal oxygen tension measurement. Curr. Eye Res. 2006;31:357–366. pmid:16603469.
5. Shahidi M, Wanek J, Blair NP, Little DM, Wu T. Retinal tissue oxygen tension imaging in the rat. Invest. Ophthalmol. Vis. Sci. 2010;51:4766–4770. pmid:20375336.
6. Rumsey WL(1), Abbott B, Lo LW, Vinogradov SA, Wilson DF. Imaging of oxygen distribution in the surface and deep areas of the kidney. Adv Exp Med Biol. 1997;411:591-5.
7. Lin W, Paczynski RP, Kuppusamy
K, Hsu CY, Haacke EM. Quantitative measurements of regional cerebral blood
volume using MRI in rats: effects of arterial carbon dioxide tension and
mannitol. Magn. Reson. Med. [Internet] 1997;38:420–428.
Figures