3300
Diffusion Tensor Imaging (DTI) in the Differential Diagnosis of Clear Cell Renal Cell Carcinoma (ccRCC) and infiltrative Transitional Cell Carcinoma (TCC)1First Affiliated Hospital of Dalian Medical University, Dalian, People's Republic of China, 2GE healthcare China, Beijing, People's Republic of China
Synopsis
It’s difficult to differentiate intrarenal transitional cell carcinoma from centrally located renal cell carcinoma by contrast enhanced CT when the tumor composition is complex. In this study, DTI were performed to investigate the utility of the apparent diffusion coefficient (ADC) and fractional anathtropy (FA) values for differential diagnosis of ccRCC and infiltrative TCC, thus assessing the sensitivity and specificity of ADC and FA values. The FA value from DTI, which reveals the different structure of tumors, provides an effectively non-invasive means to distinguish ccRCC from TCC because of its good sensitivity.
Purpose
Clear cell renal cell carcinoma (ccRCC) and transitional cell carcinoma (TCC) are the two most common cancer types among malignant renal tumors. Centripetal infiltration into the renal parenchyma is commonly accompanied with the progression of infiltrative TCC, and its differentiation from ccRCC grown into renal pelvis poses a diagnostic challenge 1. In the contrast enhanced CT, the image presentation could be non-typical when the tumor composition is complex. It has been demonstrated DWI may be used for differential diagnosis of ccRCC and TCC due to their differing cell micro-structures in the lesions. Another pathological difference between ccRCC and TCC is the tumor cell alignments, which may lead to directional diffusion difference. It is hence hypothesized that the fractional anathtropy (FA) value from DTI may be used as a biomarker for differential diagnosis of ccRCC and TCC, and to our knowledge this study is the first attempt for exploiting such property.Method
Forty-five histopathology proven ccRCC and TCC patients (30 male and 15 female), including 35 ccRCCs and 10 TCCs, were retrospectively enrolled in this ethical committee approved study. All patients received abdominal MRI exams on a 1.5T scanner (GE 1.5T Signa HDXT, US). The scan protocol included routine T1WI, T2WI and DTI (b=0, 600s/mm2, in 6 directions). MR images were reviewed and analyzed by 2 radiologists in a double-blind manner, and the ADC and FA maps were derived on a GE ADW4.4 workstation. Regions of interest (ROI) were drawn two times in tumor parenchyma that was greater than 1/3 of the tumor avoiding the part of hemorrhage and necrosis on the parametric maps. Then the average value was used in analysis. The data from two observers were analyzed with intra-class correlation coefficients (ICC) to assess inter-observer agreement. The differences of ADC and FA values between ccRCC and TCC group were compared using independent t-test. The ROC curves of all parameters were derived to study their diagnostic value in differentiating ccRCC and TCC.Results
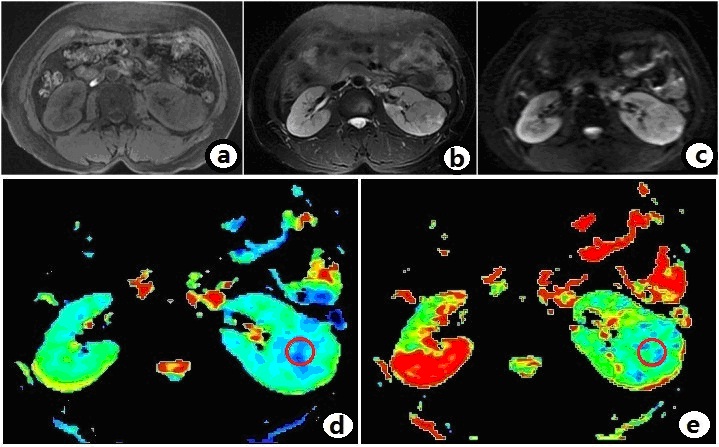
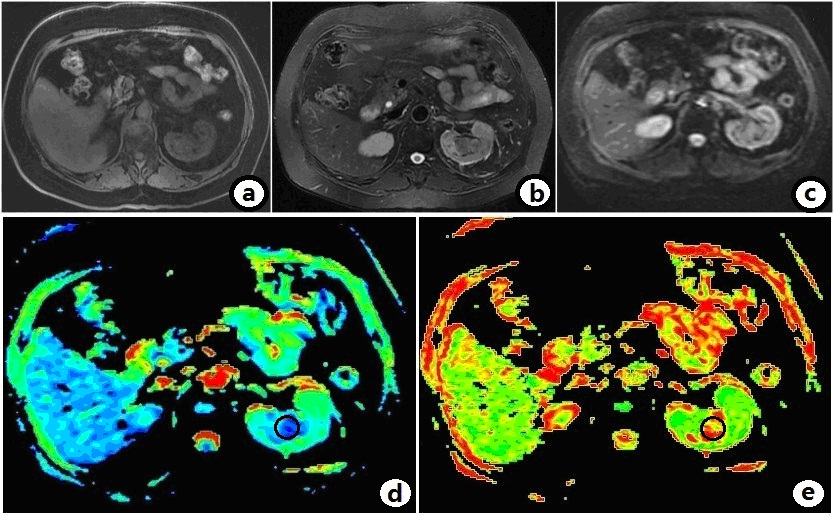
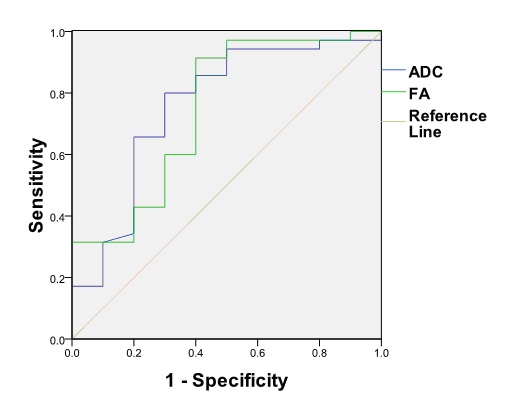
Typical sets of obtained images of ccRCC and TCC are shown in Fig.1 and Fig.2 respectively. The inter-observer agreements were good (ICC>0.75) for both ADC and FA. The ADC value of ccRCC was statistically higher than that of TCC [(2.03±0.47) vs. (1.59±0.41)×10-3mm2/s, P<0.05]; the FA value of ccRCC was statistically lower than that of TCC [(0.25±0.10) vs. (0.41±0.21), P<0.05]. As shown in Fig.3, the area under the ROC curve of ADC (AUC=0.759) was larger than that of FA at a threshold of 1.585×10⁻³mm2/s, with a sensitivity of 80.0% and a specificity of 70.0%. The AUC of FA was 0.746 with a sensitivity 91.4% and specificity 60.0%, the best diagnostic threshold of 0.33.Discussion and conclusion
In this study, a higher ADC value was observed in ccRCC group. Since the tumor cells of invasive TCC may be nested and clustered, and interstitial reaction promoting the fibrous connective tissue hyperplasia could be occurred between tumor nests 2. As a result, the diffusion of water molecules within the TCC lesions may be restricted. On the other hand, ccRCC have large chromatin-rich nucleus and the extracellular space may promote the water molecule diffusion. A higher FA value was observed in TCC group. This is because tumor cells of TCC grow along the direction of ureteropelvic epithelial arrangement. In addition, interstitial reaction promoting the fibrous connective tissue hyperplasia could be occurred in infiltrative TCC. Thus the water molecules in infiltrative TCC move with a more consistent direction.Acknowledgements
No acknowledgement found.References
1. Samir S, Taneja. Centrally infiltrating renal masses on CT: differentiating intrarenal transitional cell carcinoma from centrally located renal cell carcinoma. J Urol,2012,188(5):1719-1725.
2. Yu X,Lin M,Ouy^g H,et al. Application of ADC measurement in characterization of renal cell carcinomas with different pathological types and grades by 3.0T diffusion-weighted MRI. Eur J Radiol,2012,81(11):3061-3066.
Figures