3299
Kidney tumor characterization with diffusion-MRI: diffusion-tensor and tri-exponential modeling1Faculty of Science and Technology, University of Twente, Enschede, Netherlands, 2Urology, Medisch Spectrum Twente, Enschede, Netherlands, 3Radiology, Medisch Spectrum Twente, Enschede, Netherlands, 4Radiology, University Medical Center Utrecht, Utrecht, Netherlands
Synopsis
We present preliminary results of our study into the characterization of kidney tumors using diffusion derived parameters. We have acquired DTI and IVIM sequences and fitted the diffusion tensor and tri-exponential model to obtain parameters FA, MD, ffast, fintermediate and D. Among the first four patients planned for nephrectomy for suspected kidney tumor we found three RCCs, one cyst and one hemangioma. ffast, the fraction of the diffusion signal that reflects fast fluid motion, is lower in non-malignant lesions, whereas D is lower in the two cc-RCCs. The differences in parameter values between lesion types are reflected in parameter maps.
PURPOSE
Diffusion MRI allows visualization and quantification of water diffusion without administration of exogenous contrast materials and is therefore a promising technique for kidney imaging in the clinic. Previously, ADC and the bi-exponential intravoxel incoherent motion (IVIM) model were found to be able to differentiate between renal tumor types.1,2 However, current clinical imaging methods can detect the size and location of kidney tumors, but tumor type and malignancy can only be determined histologically after surgery. In this study, we assess whether other diffusion MRI derived parameters, including diffusion-tensor and tri-exponential fitting3 can better differentiate between malignant and benign kidney tumors.
METHODS
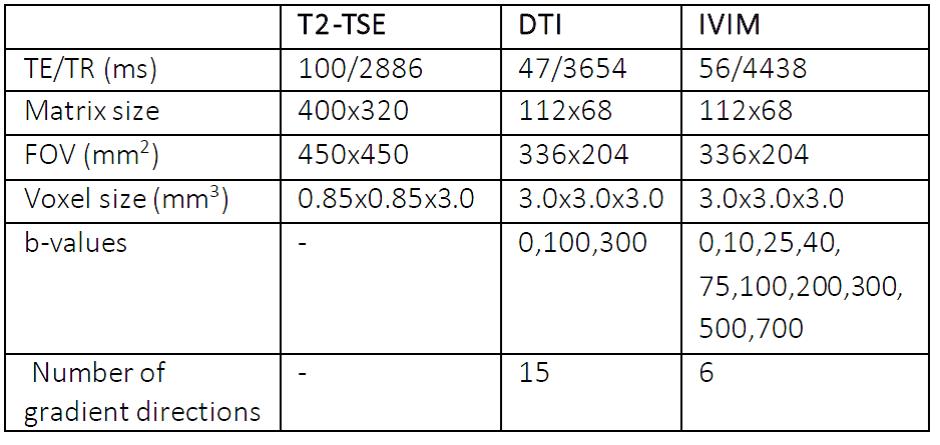
Approval of our institution’s ethical committee was obtained for this research. Up to this point, four patients with suspected kidney tumors who are planned for radical or partial nephrectomy are included. After resection histological analysis was performed. In total 15 patients will be included. A T2 weighted TSE was performed for anatomical reference, followed by a DTI sequence and an IVIM sequence on a 3T Philips Ingenia clinical scanner, see table 1 for acquisition details. To correct for motion, all diffusion-weighted images were registered to the unweighted volume, using a non-rigid 2D b-spline registration algorithm (Elastix4). ROIs were manually drawn to segment the both complete kidneys and the tumor volumes. DTI parameters fractional anisotropy (FA) and mean diffusivity (MD) were calculated using an iterative weighted linear least squares (iWLLS) algorithm with outlier rejection using ExploreDTI5. Tri-exponential diffusion decay parameters diffusion (D), the signal fraction attributed to fast pseudodiffusion (ffast) and intermediate pseudodiffusion (fintermediate) were obtained by fitting a three-compartment model to the IVIM data3. ROI-based parameters were compared and parameter maps were obtained for visual comparison with gross cut-through and anatomical reference. The parameters of the complete (contralateral) healthy kidney were averaged for comparison with lesion ROIs.RESULTS
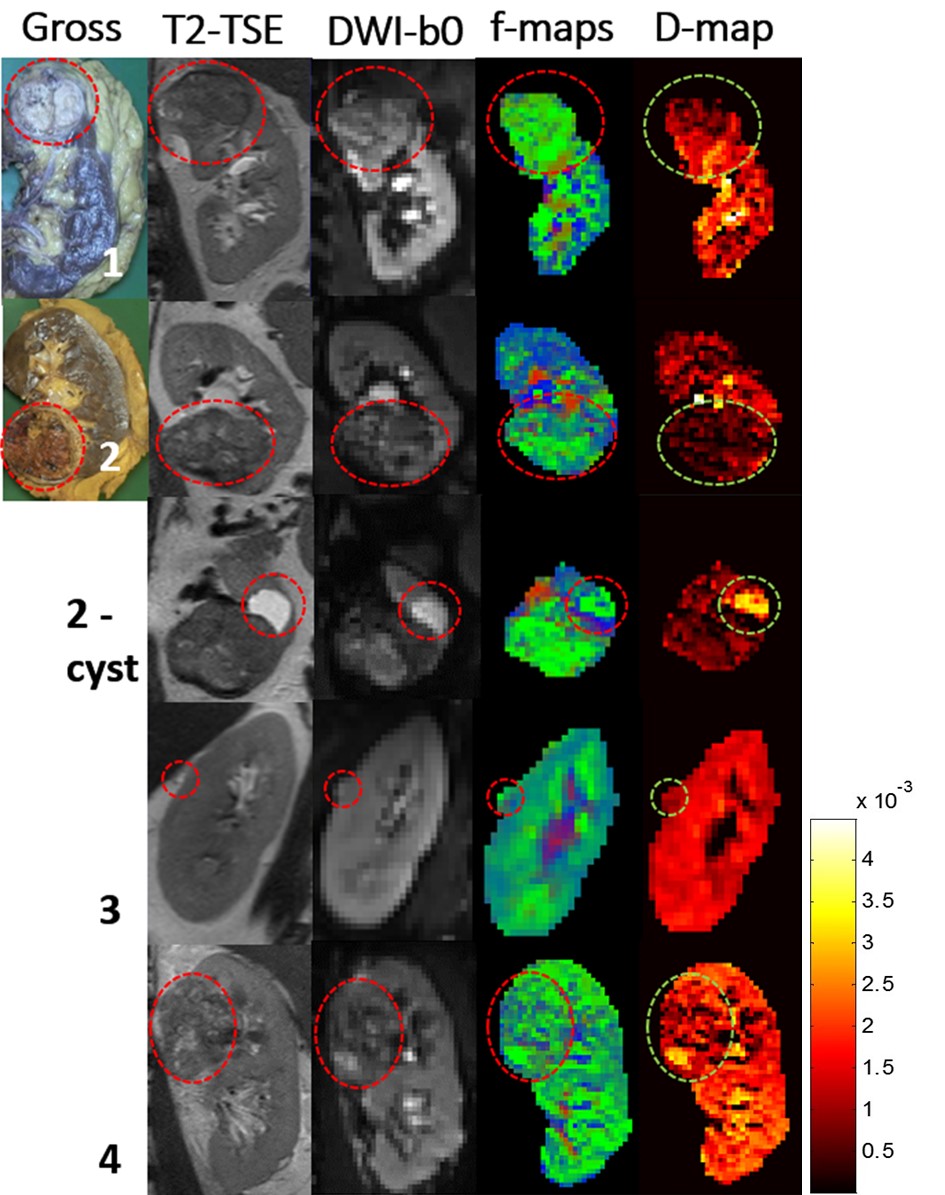
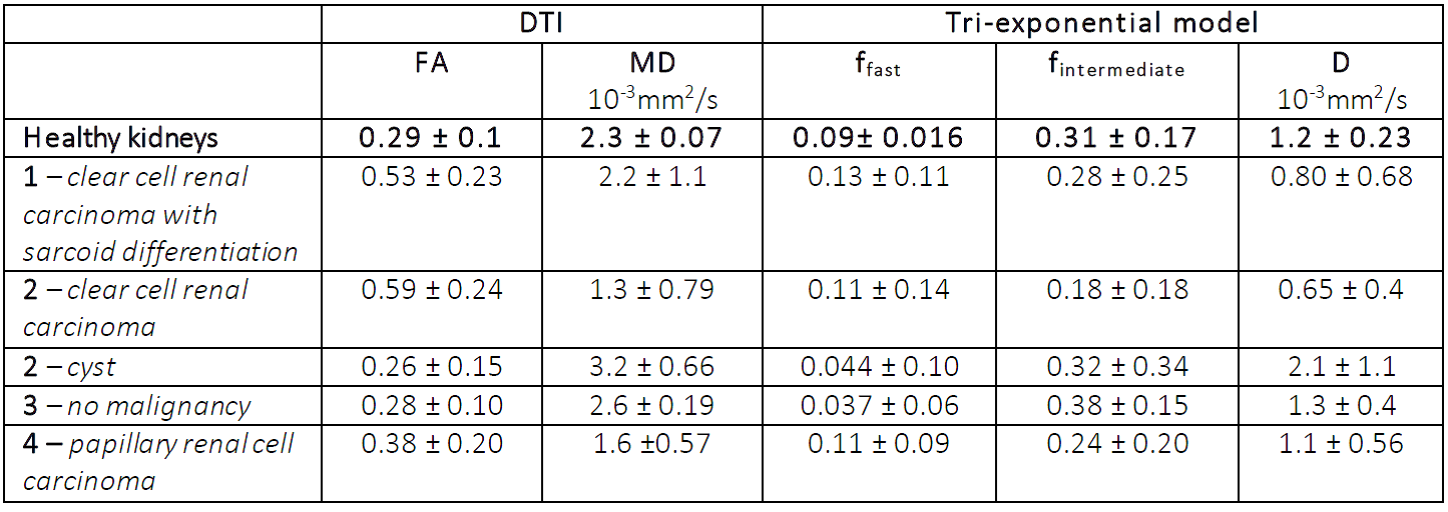
In the four patients scanned, three malignant tumors (two clear cell carcinoma’s (cc-RCC), of which one with sarcoid differentiation and one papillary renal cell carcinoma), one fluid-filled cyst and one non-malignant lesion (a hemangioma) of the kidney capsule were found in histological analysis after resection. Although we were unable to make direct comparisons between the histology of different tumor regions and the parameters maps, a visual comparison with conventional scans and a gross section can be made. In figure 1, we show a gross cut through of the kidney tumor, the T2 TSE, the unweighted DWI before image processing, and a merge of the fraction maps for the three signal fractions (ffast, fintermediate and fslow). These maps reflect the heterogeneity of these tumors. The average results of the healthy kidneys are listed in table 2 together with the individual values of all the separate lesions. MD is lower in malignant lesions than in non-malignant lesions and healthy renal tissue. Notably, ffast, the fraction of the diffusion signal that reflects fast fluid motion, is lower in the non-malignant lesions (cyst in patient 2 and lesion in patient 3, 0.044 ± 0.10 and 0.037 ± 0.06 respectively, versus 0.09± 0.016 in healthy kidneys), whereas it is about similar to healthy kidney tissue for malignant tumors. D is lower in the two cc-RCC’s (0.80 ± 0.68 and 0.65 ± 0.4, versus 1.2 ± 0.24 in healthy people) and higher in the cyst (2.1 ± 1.1).DISCUSSION
Previous studies have shown that MD decreases in kidneys tumors1, which agrees with our finding of decreasing MD. The two cc-RCC’s were found highly heterogeneous, including necrotic regions in over 20% of the tumor which is a sign of fast tumor growth, suggesting high malignancy. The lower D in tumors can be the result of diffusion restriction due to a higher cell density. The lesion in patient 3 was judged to be a malignant growth of kidney parenchyma on conventional imaging methods, but per-operatively found to be located in the kidney capsule and found benign in histological evaluation. This non-malignancy is reflected by a lower ffast. This makes the lesion comparable to the fluid-filled cyst in patient 2, which can be attributed to a lack of perfusion in these lesions. The differences in parameter values between lesion types are also reflected in the parameter maps, suggesting that such maps can potentially be used to assess the malignancy of a tumor.CONCLUSION
The preliminary results of this study suggest that diffusion-derived parameters, especially MD, ffast and D, might be valuable in differentiating between malignant and non-malignant kidney tumors, potentially preventing unnecessary surgery. Furthermore, it is shown that these differences and tumor heterogeneity can be visualized in parameter maps.Acknowledgements
We thank Caspar Jansen for taking photographs of gross cut-throughs before histology.References
1. Sandrasegaran K, Sundaram CP, Ramaswamy R, et al. Usefulness of diffusion-weighted imaging in the evaluation of renal masses. AJR Am J Roentgenol. 2010;194:438–445.
2. Chandarana et al. Diffusion-weighted Intravoxel Incoherent Motion Imaging of Renal Tumors with Histopathologic Correlation. Invest radiol. 2012;47: 688-696
3. Van Baalen et al. Intravoxel Incoheren Motion Modeling in the Kidneys: Comparison of Mono-, Bi-, and Triexponential Fit. J. Magn. Reson. Imaging. 2016. Forthcoming
4. Klein et al. Elastix: a toolbox for intensity-based medical image registration. IEEE trans Med Imaging 2010;29: 196-205
5. Leemans et al. ExploreDTI: a graphical toolbox for processing, analyzing and visualizing diffusion MRI data. Proc 17th Annual Meeting ISMRM, Honolulu, 2009
Figures