3295
Whole-Tumor Quantitative Apparent Diffusion Coefficient Histogram and Texture Analysis to Differentiation of Minimal Fat Angiomyolipoma from Clear Cell Renal Cell Carcinoma1Department of Radiology, Tongji Hospital, Tongji Medical College, Huazhong University of Science and Technology, Wuhan, People's Republic of China
Synopsis
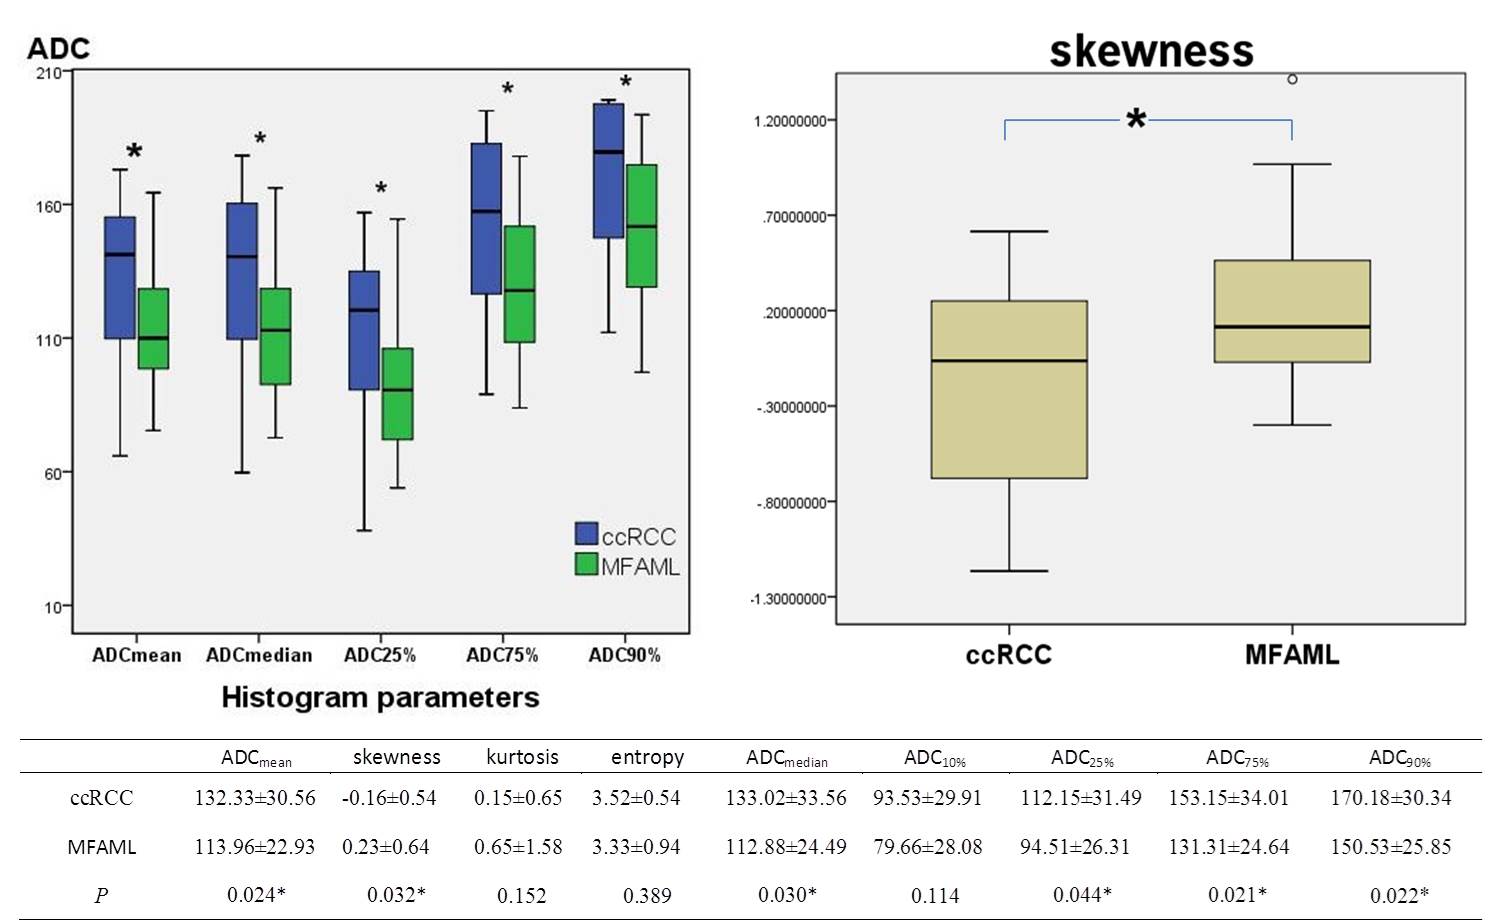
The purpose of this study was to determine whether whole-tumor ADC histogram and texture analysis is helpful for distinguishing MFAML from ccRCC. The differences of ADC histogram and texture parameters between MFAML and ccRCC were compared using the independent-sample t test. There were significant differences on ADCmean, ADCmedian, ADC25%, ADC75%, ADC90% and skewness between MFAML and ccRCC. The ADC90% derived from the whole-tumor ADC histogram analysis showed the best diagnostic value in discriminating MFAML and ccRCC. Therefore, whole-tumor ADC histogram and texture parameters can be used as a quantitative tool to distinguish MFAML from ccRCC.
Introduction
Angiomyolipoma (AML) is one of the most common benign renal tumors. About 5% of renal AML no sufficient fat can be detected on routine computer tomography (CT) or magnetic resonance (MR) imaging, which is referred to as minimal fat AML (MFAML). It may be difficult to differentiate MFAML from clear cell renal cell carcinoma (ccRCC) in clinic1. Accurate preoperative differentiation between MFAML and ccRCC is important to determine appropriate treatment strategies.Purpose
The objective of our study was to evaluate the value of whole-tumor quantitative apparent diffusion coefficient (ADC) histogram and texture analysis for differentiation of MFAML from ccRCC.Methods
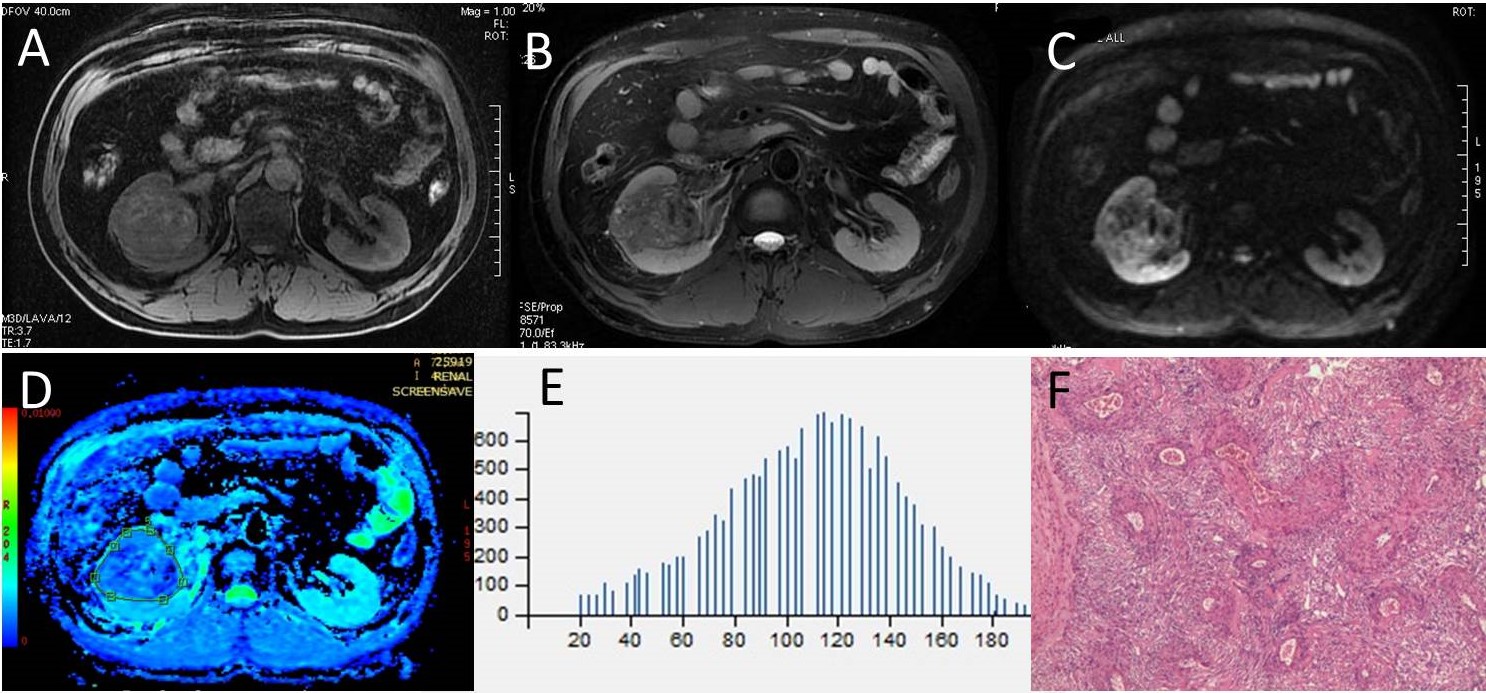
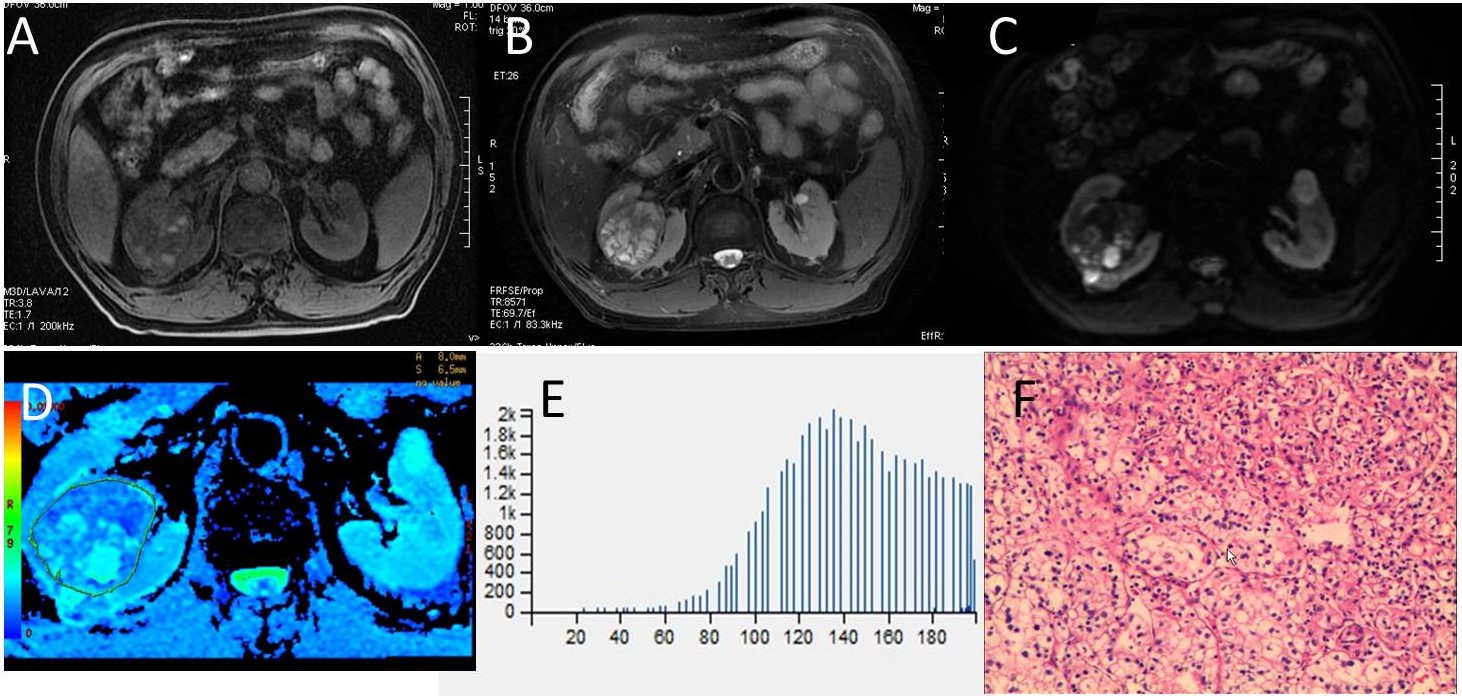
We retrospectively reviewed 168 adult patients with suspected renal tumors with magnetic resonance imaging (MRI) including DWI (b=0, 800s/mm2) performed on a 3-T system (Discovery 750, GE Medical System, Milwaukee, WI). Patients with visible macroscopic fat within the lesions on CT or MRI were excluded. Finally, 26 patients with MFAML and 20 patients with ccRCC were included in this study and all the cases were diagnosed pathologically. Whole-tumor regions of interest (ROIs) were drawn around the entire tumor on all slices of the ADC maps to obtain histogram and texture analysis parameters, including the ADCmean, ADCmedian, ADC10%, ADC25%, ADC75%, ADC90%, entropy, skewness and kurtosis. An independent-samples t test was used to compare the parameters between MFAML and ccRCC. Multiple receiver operating characteristic (ROC) curves analysis was used to determine and compare the diagnostic value of each significant parameter.Results
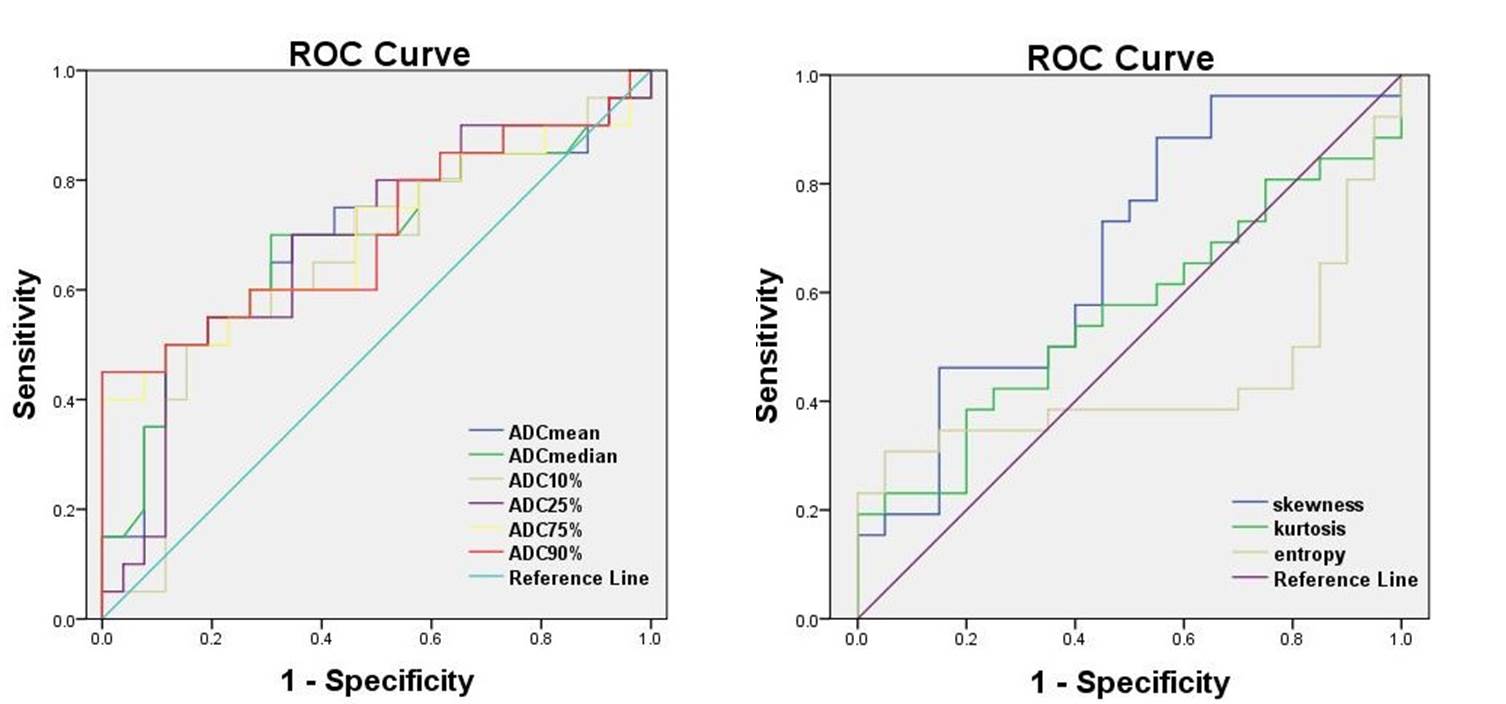
MFAML had significantly lower ADCmean, ADCmedian, ADC25%, ADC75%, and ADC90% than ccRCC (P=0.024, P=0.030, P=0.044, P=0.021, P=0.022, respectively).The majority ADC value of MFAML was concentrated on the left of the histogram, but ccRCC was concentrated on the right of the histogram (skewness=0.23±0.64, -0.16±0.54, respectively, P=0.032). However, ADC10%, kurtosis and entropy were not significantly different (P=0.114, P=0.152, P=0.389, respectively) (Fig.1, 3, 4). During ROC curves analysis, the ADC90% value generated the highest AUC for differentiating MFAML from ccRCC (AUC, 0.706; Sensitivity, 45%; Specificity, 100%; cut-off value, 1.943×10⁻³ mm2/s), while the ADCmean value generated higher AUC for differentiating these two subtypes (AUC, 0.690; Sensitivity, 50%; Specificity, 88%; cut-off value, 1.433×10⁻³mm2/s) (Fig.2).Discussion
Most of prior studies measured ADC values from manually placed ROI on a single section of the tumor, which might have led to interobserver variability in ROI selection, and inappropriate ROI selection may not accurately reflect various histopathologic characteristics of the tumor2. However, whole-tumor ADC histogram analysis was employed to evaluate the distribution of ADC values of the entire lesion and avoided the subjectivity of ROIs placement to ensure calculation accuracy and repeatability. This method has described the comprehensive characteristics of ADC values of entire tumors and can potentially eliminate sampling bias during data processing3. In our study, the ADCmean, ADCmedian, ADC25%, ADC75%, and ADC90% of MFAML was significantly lower than those of ccRCC, which may indicate that water molecular diffusion was more restricted in MFAML. The skewness of MFAML was significantly higher than that of ccRCC, suggesting that they may have different distribution of ADC values. In addition, during ROC curves analysis, the ADC90% value generated the highest AUC value for differentiating MFAML from ccRCC, while the ADCmean value generated higher AUC for differentiating these two lesions. The high percentile of ADC derived from the whole-tumor ADC histogram analysis showed the best in discriminating MFAML and ccRCC.Conclusion
ADC histogram and texture analysis based on the whole-tumor can be considered a useful and noninvasive method to help differentiate MFAML from ccRCC. Especially ADC90% and skewness of histogram analysis allow differentiation of MFAML from ccRCC with higher accuracy.Acknowledgements
No acknowledgement found.References
1. Hodgdon T, McInnes MD, Schieda N, et al. Can Quantitative CT Texture Analysis be Used to Differentiate Fat-poor Renal Angiomyolipoma from Renal Cell Carcinoma on Unenhanced CT Images? Radiology 2015; 276(3):787-96.
2. Wang H, Cheng L, Zhang X, et al. Renal cell carcinoma: diffusion-weighted MR imaging for subtype differentiation at 3.0 T. Radiology 2010; 257(1):135–143.
3. Gaing B, Sigmund EE, Huang WC, et al. Subtype differentiation of renal tumors using voxel-based histogram analysis of intravoxel in coherent motion parameters. Invest Radiol 2015;50:144–152.
Figures