3291
Treating male infertility: Can spectroscopy supplant biopsy in the search for sperm?1Radiology Department, New York University School of Medicine, New York, NY, United States, 2Urology Department, New York University School of Medicine, New York, NY, United States, 3Urology Department, Case Western Reserve University, Cleveland, OH, United States, 4Siemens Healthcare, New York, NY, United States
Synopsis
Many men who wish to start a family but lack sperm in their semen undergo surgical exploration of the testes in the hope of extracting sperm at source. However, there are currently no tests that can accurately predict whether sperm will be found. We performed proton spectroscopy at 3T in the testes of eight infertile patients and nine controls. Choline concentrations were significantly lower in patients (mean 1.4mM, range 0.8 – 1.9mM) than controls (mean 4.1mM, range 3.0 – 5.1mM), p<0.0001. This suggests that choline, which is a marker of membrane synthesis and cell proliferation, may be useful for detecting spermatogenesis noninvasively.
Introduction
Approximately 1% of men have azoospermia (no sperm in their semen)1. In most cases no obstruction can be identified, and their azoospermia is attributed to impaired or incomplete spermatogenesis. Some men with non-obstructive azoospermia (NOA) may have small numbers of sperm in their testes. These can be used to conceive a child by means of testicular sperm extraction combined with intracytoplasmic sperm injection (TESE-ICSI). However, there are currently no reliable tests to predict whether any sperm will be found, and success rates for sperm retrieval range from 35 – 65%2,3. A noninvasive biomarker of spermatogenesis would be of enormous value to patients deciding whether to undergo this surgical procedure.
A previous study of testicular biopsy specimens at 11.7T suggests that phosphocholine concentration is sensitive to spermatogenesis4. This is consistent with phosphocholine’s role as a marker of phospholipid membrane synthesis and active cell proliferation. Our goal was to investigate whether 1H-MRS of the testes at 3T might provide a robust, noninvasive biomarker of spermatogenesis in vivo.
Methods
Eight infertile men (mean age 36.9, range 32 – 50) and nine controls (mean age 34.2, range 27 – 40) participated. All the controls except the youngest one had previously fathered children. Seven patients had NOA and one had oligospermia.
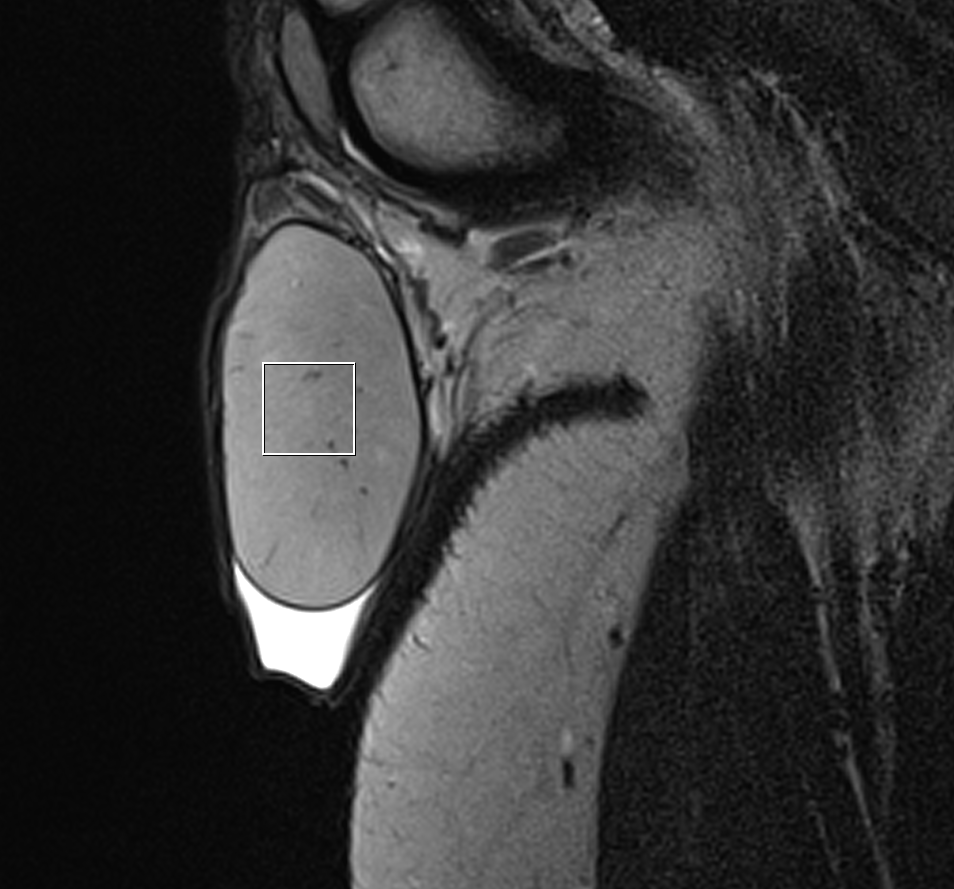
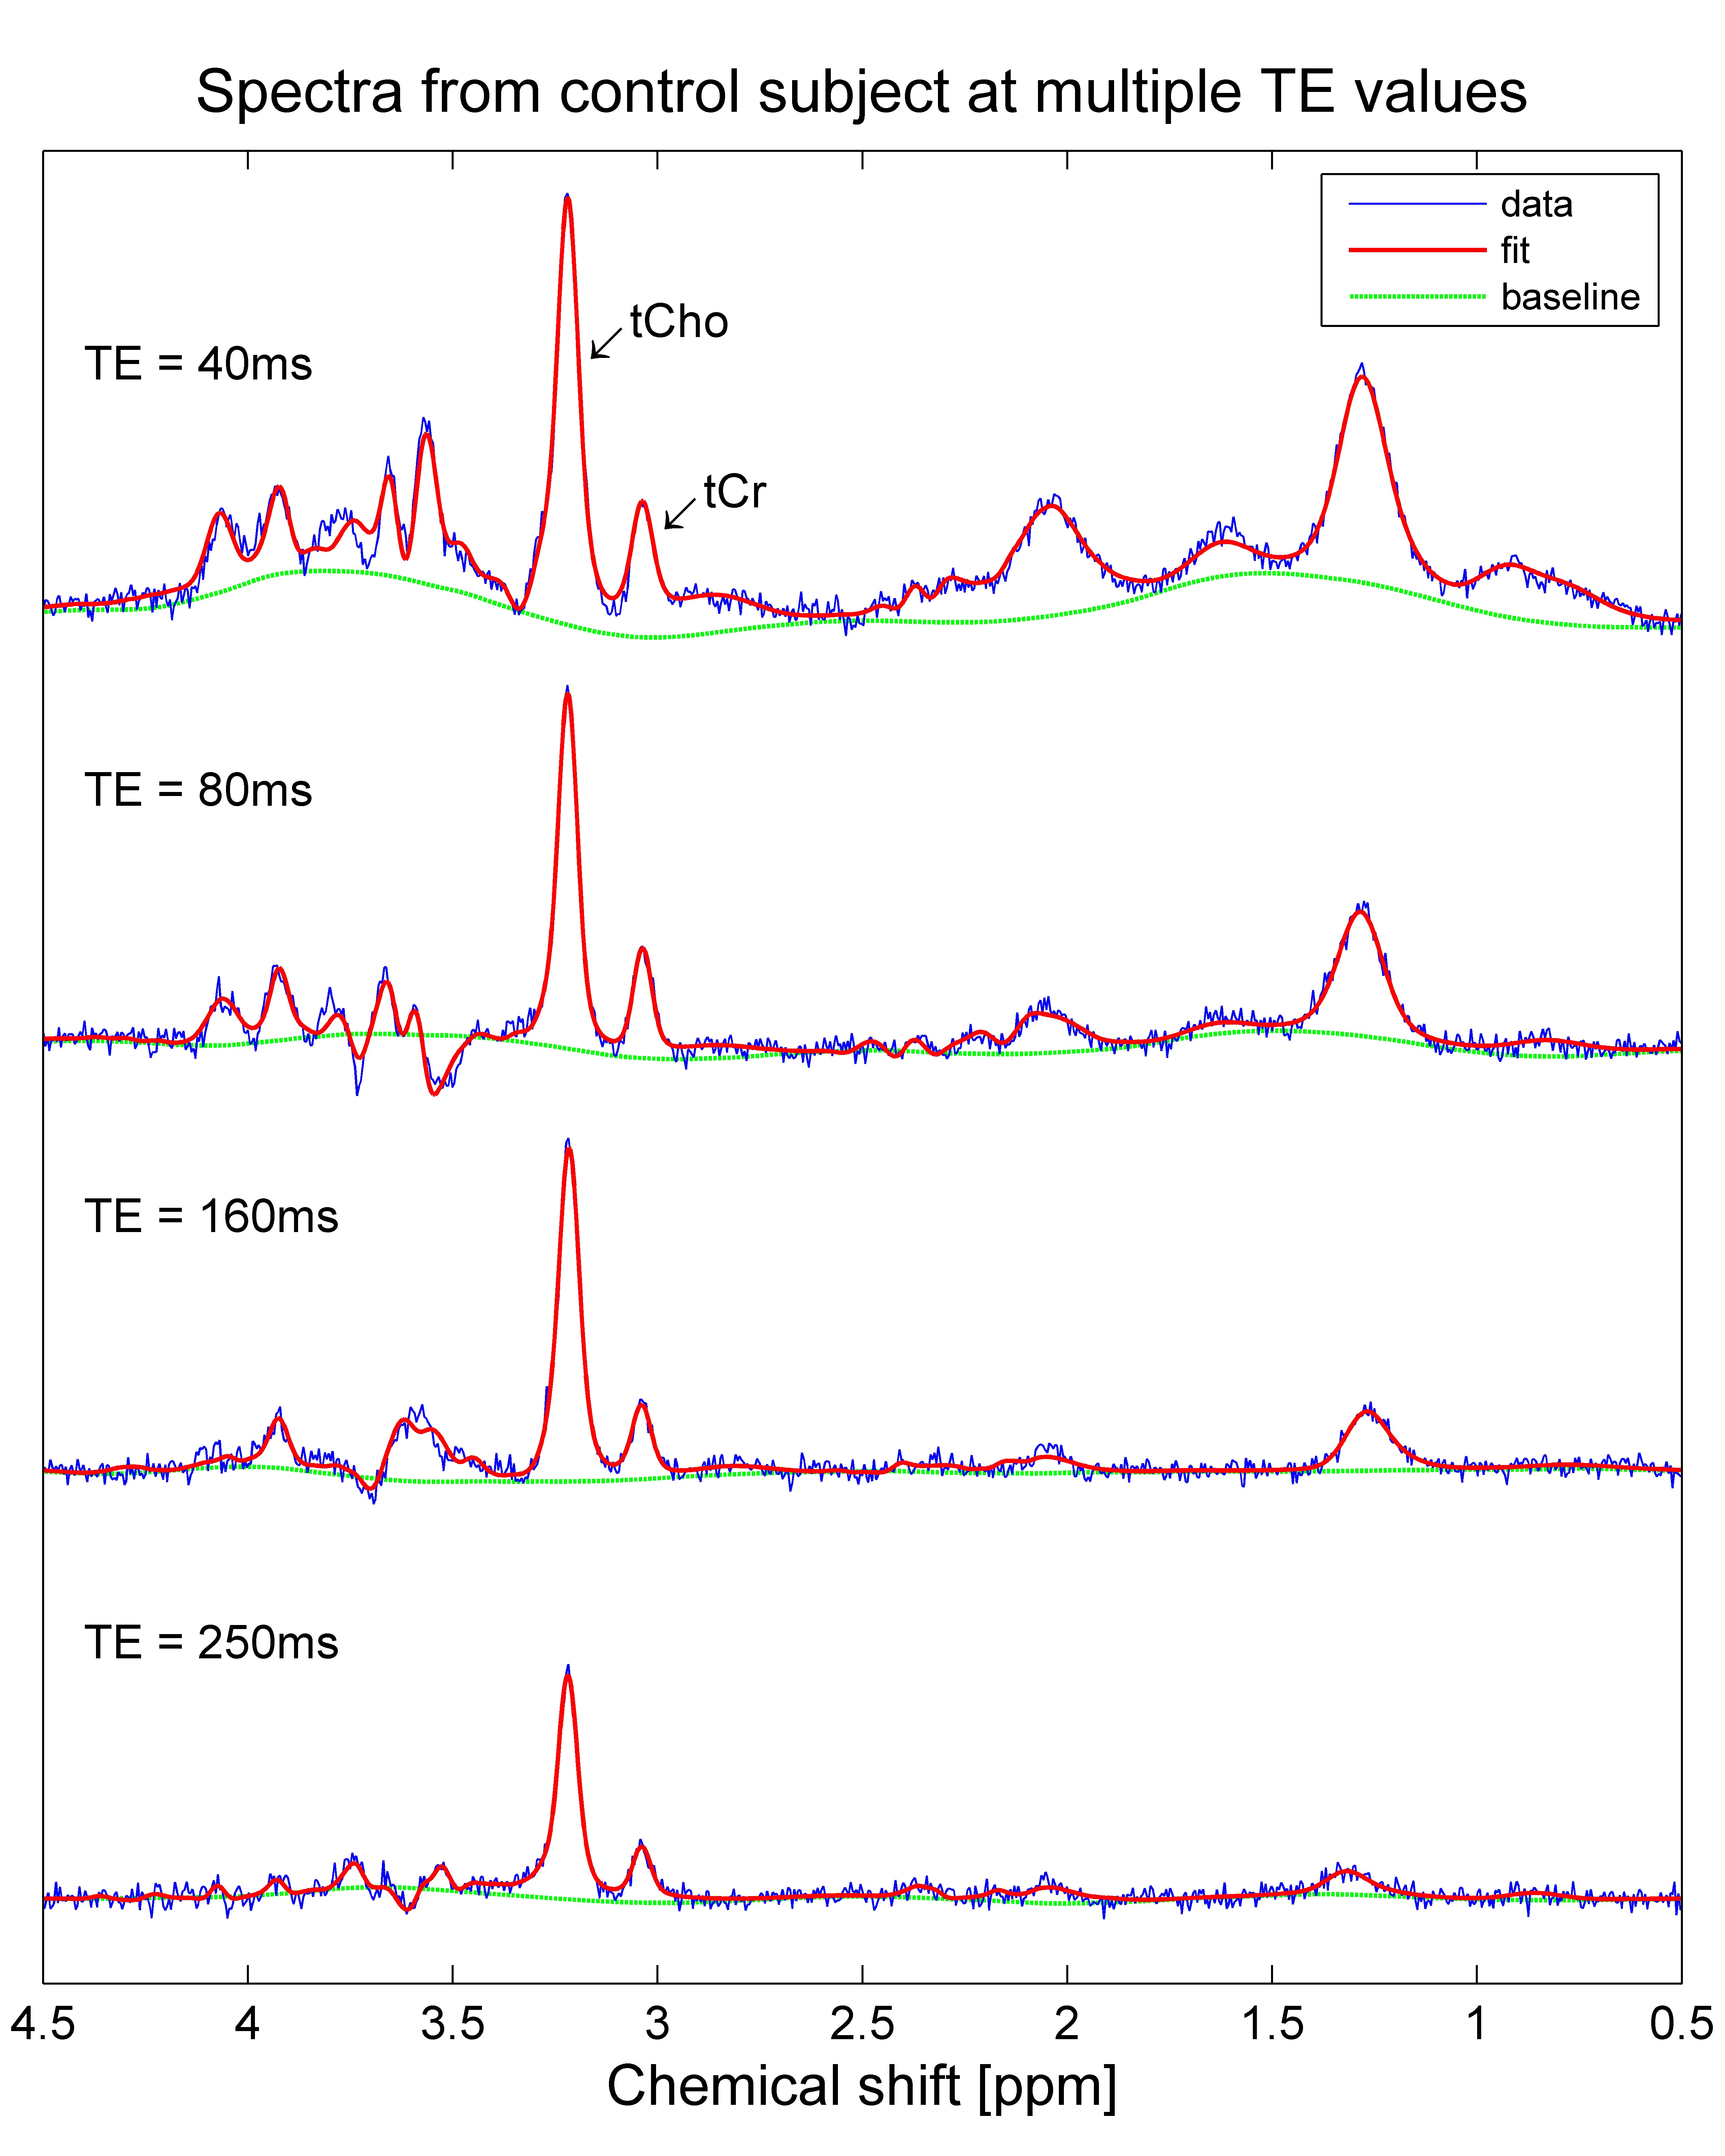
Single-voxel 1H-MRS (PRESS, TE/TR=40ms/2000ms) was performed with and without water suppression at 3T (Prisma, Siemens) using a 4-channel phased array (Siemens small flex receive coil). A 12x12x12mm3 voxel was used in all controls and five patients (Figure 1), with 192 averages for the water-suppressed acquisition. In the remaining patients, the voxel size was reduced and the number of averages increased to allow for the smaller size of the testes. In controls only, PRESS data were collected at multiple TE values (40ms, 80ms, 160ms and 250ms) to estimate T2 values for water and metabolites. Preliminary T1 measurements were made in one subject by varying TR (1300ms, 2000ms, 4000ms and 8000ms) with TE=40ms.
T2-weighted FSE images were also acquired. They were reviewed for pathology and used to calculate testicular volumes by segmenting the testes manually from surrounding tissues.
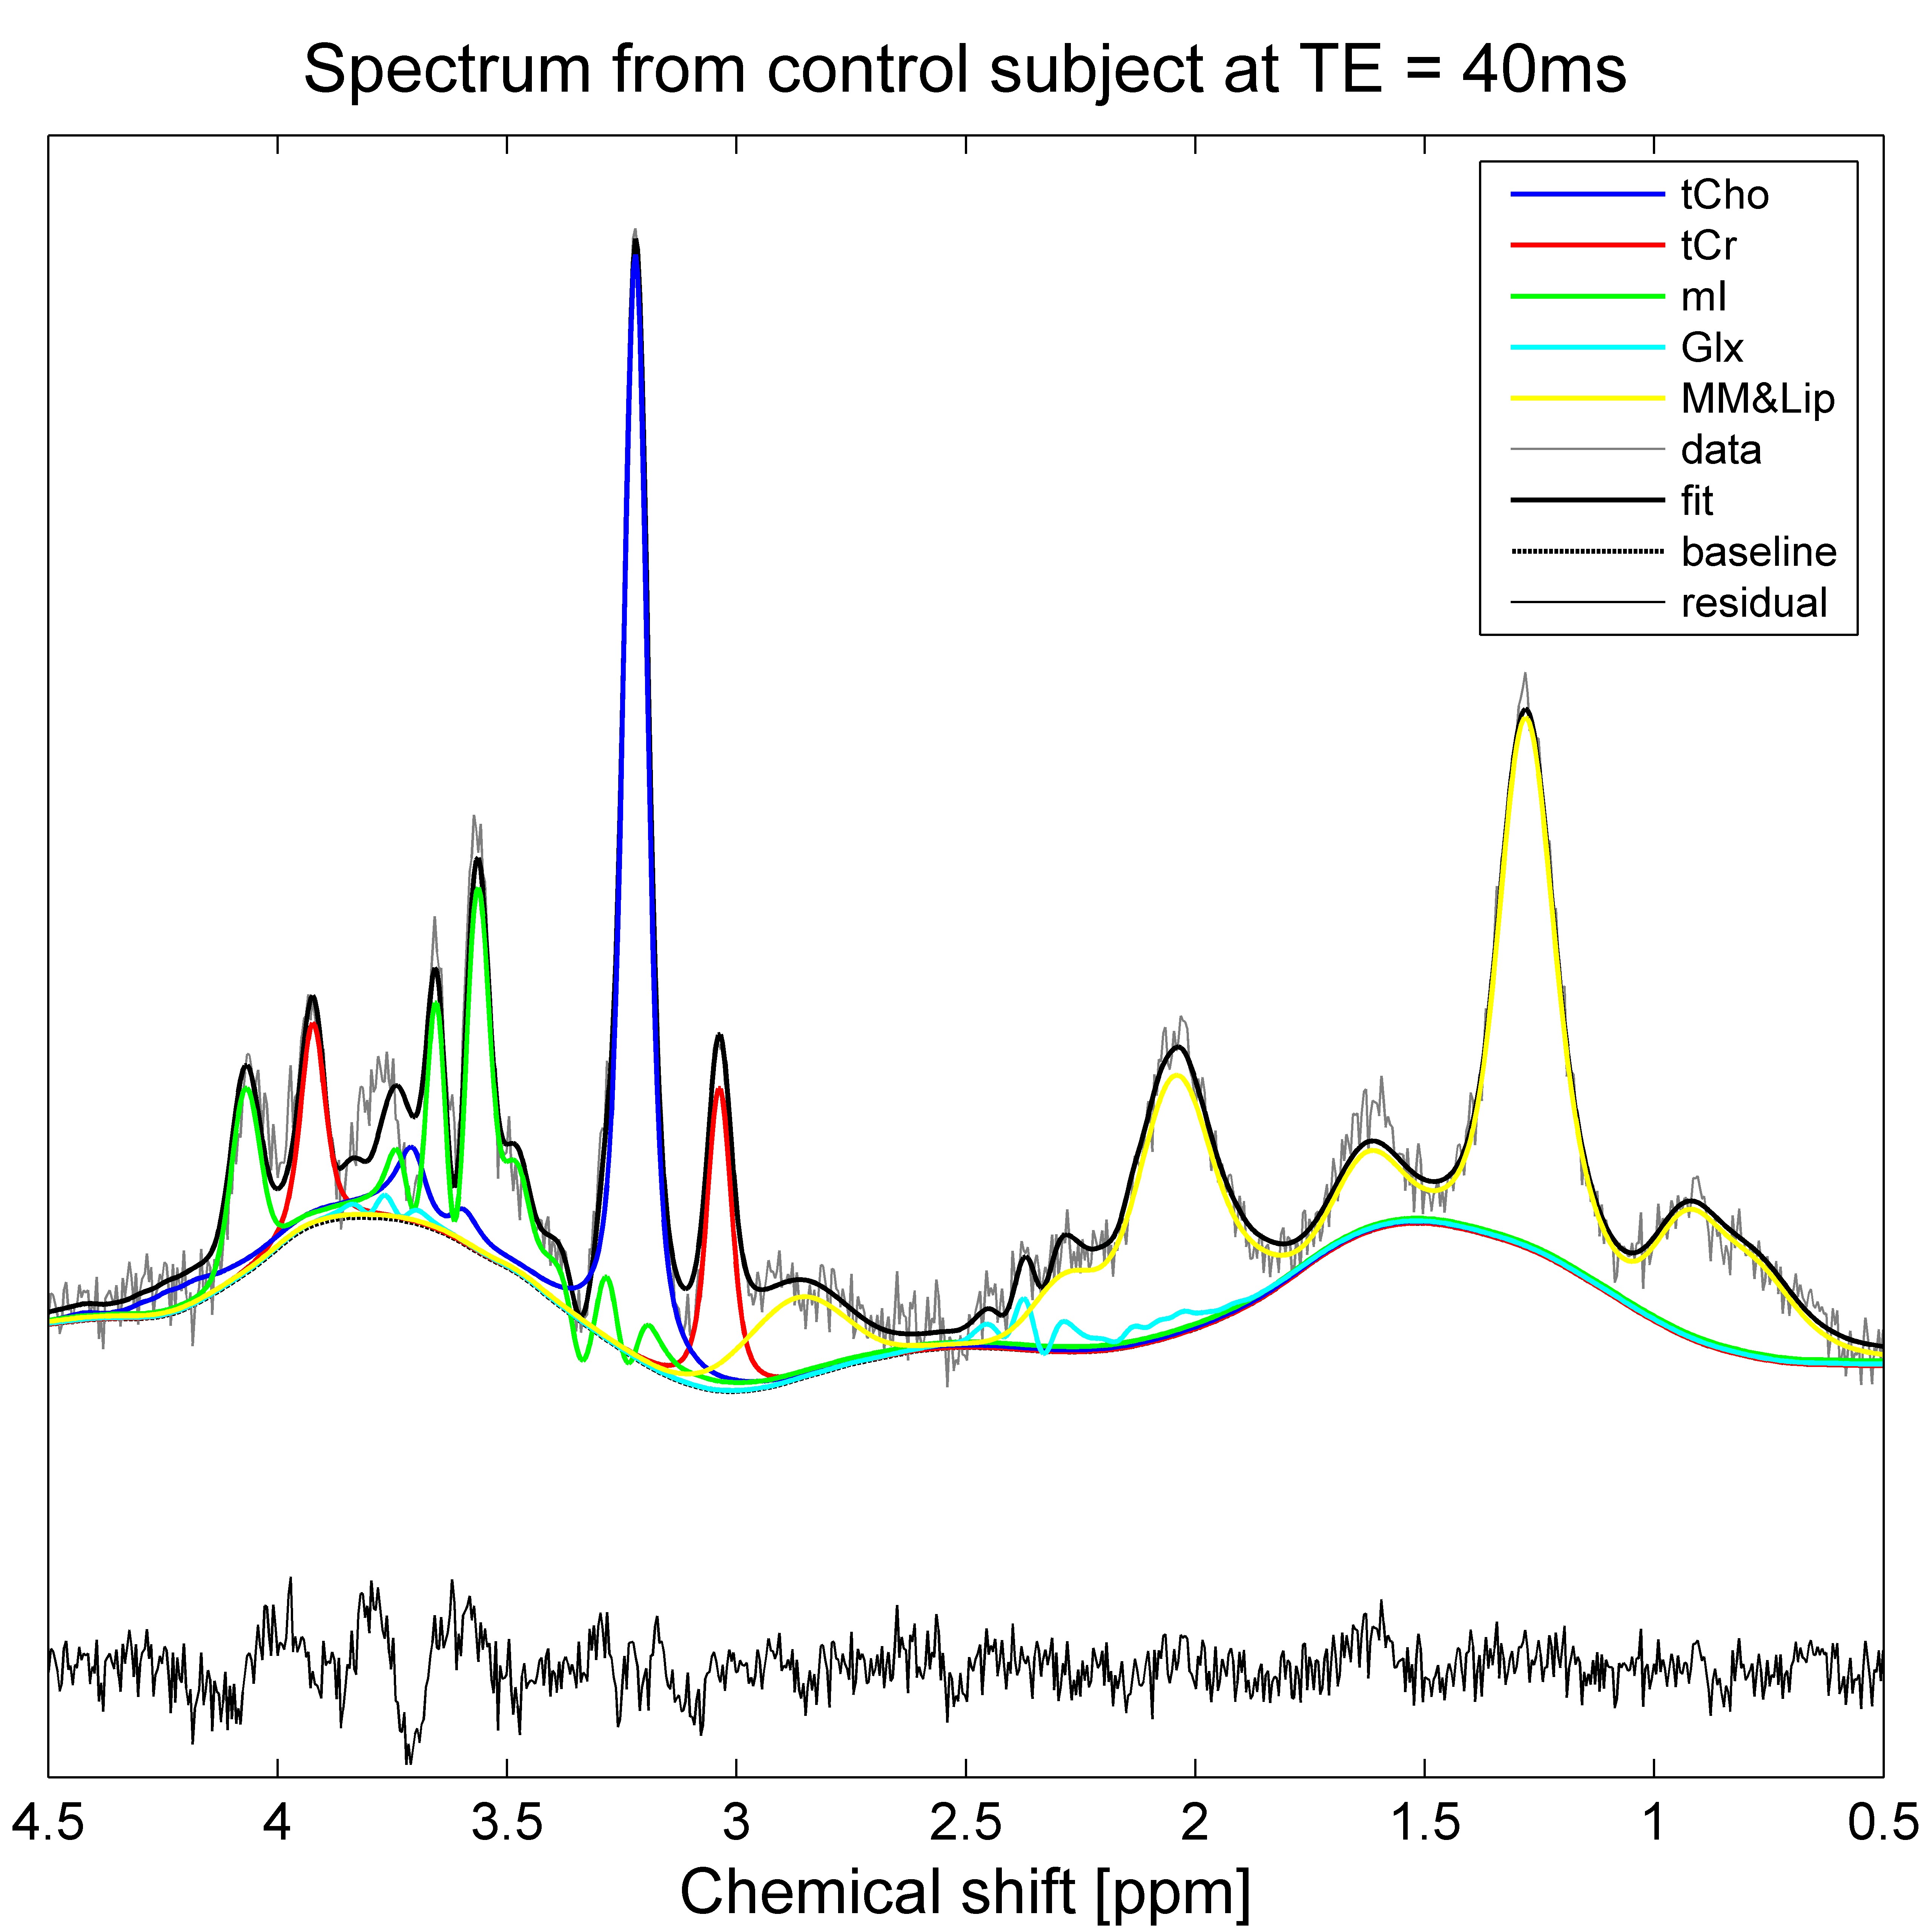
Spectra were fitted using TARQUIN5. The basis set (Figure 2) comprised creatine and phosphocholine, reported as total creatine (tCr) and total choline (tCho) respectively, myo-inositol (mI), glutamate and glutamine (Glx), and macromolecules and lipids (MM&Lip). Metabolite concentrations were calculated using the unsuppressed water signal as a reference, assuming a water content of 84%6, and correcting for relative T1 and T2 weighting of water and metabolites. Due to the small sample sizes, between-group differences were analyzed using the Mann-Whitney U test.
Results
No gross abnormalities were evident in the T2W-FSE images, although bilateral varicoceles were reported in one patient and an epididymal cyst in another. Testicular volume was significantly lower in patients (mean 8.4cc, range 1.3 – 27.6cc) than controls (mean 17.1cc, range 6.3 – 26.5cc), p=0.02. The patient with the largest testes was the one with oligospermia.
In all controls, spectra were successfully acquired in both testes and at all TE values (Figure 3). T2 values for water, tCho and tCr were 146±11ms, 307±32ms and 230±94ms respectively. Preliminary T1 values (estimated from one subject) were 2.22sec, 1.06sec and 1.7sec respectively.
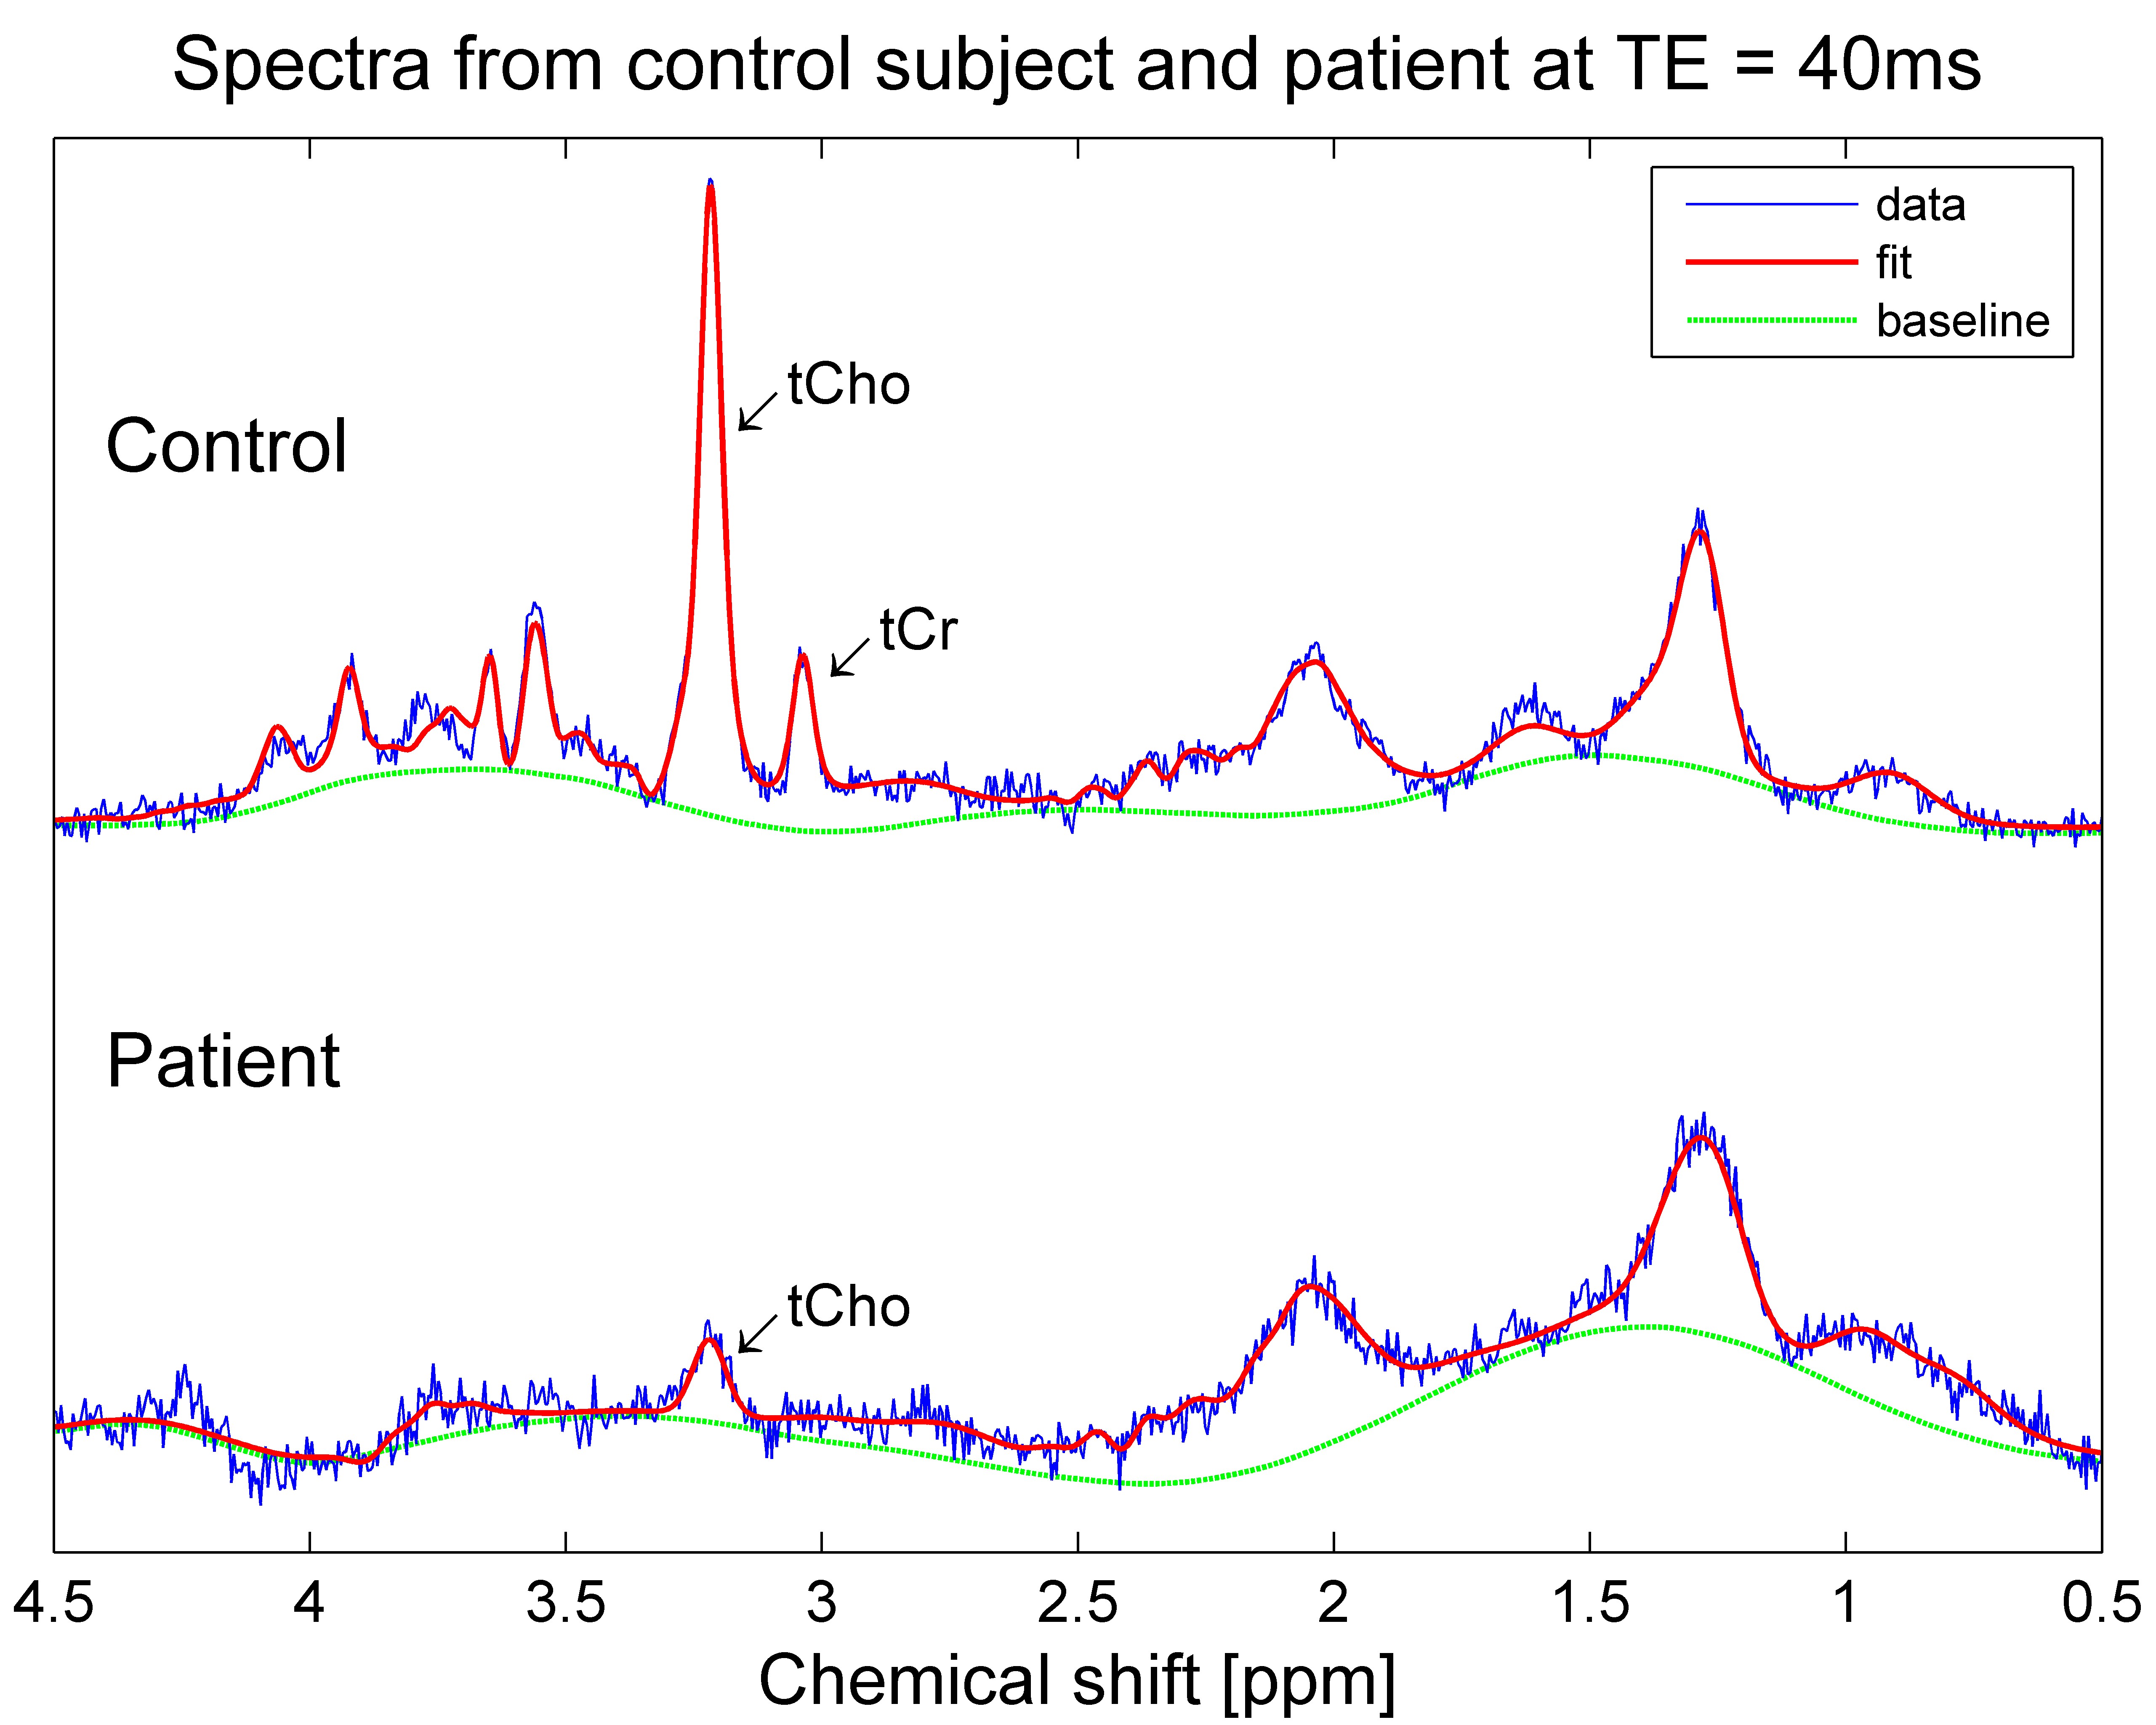
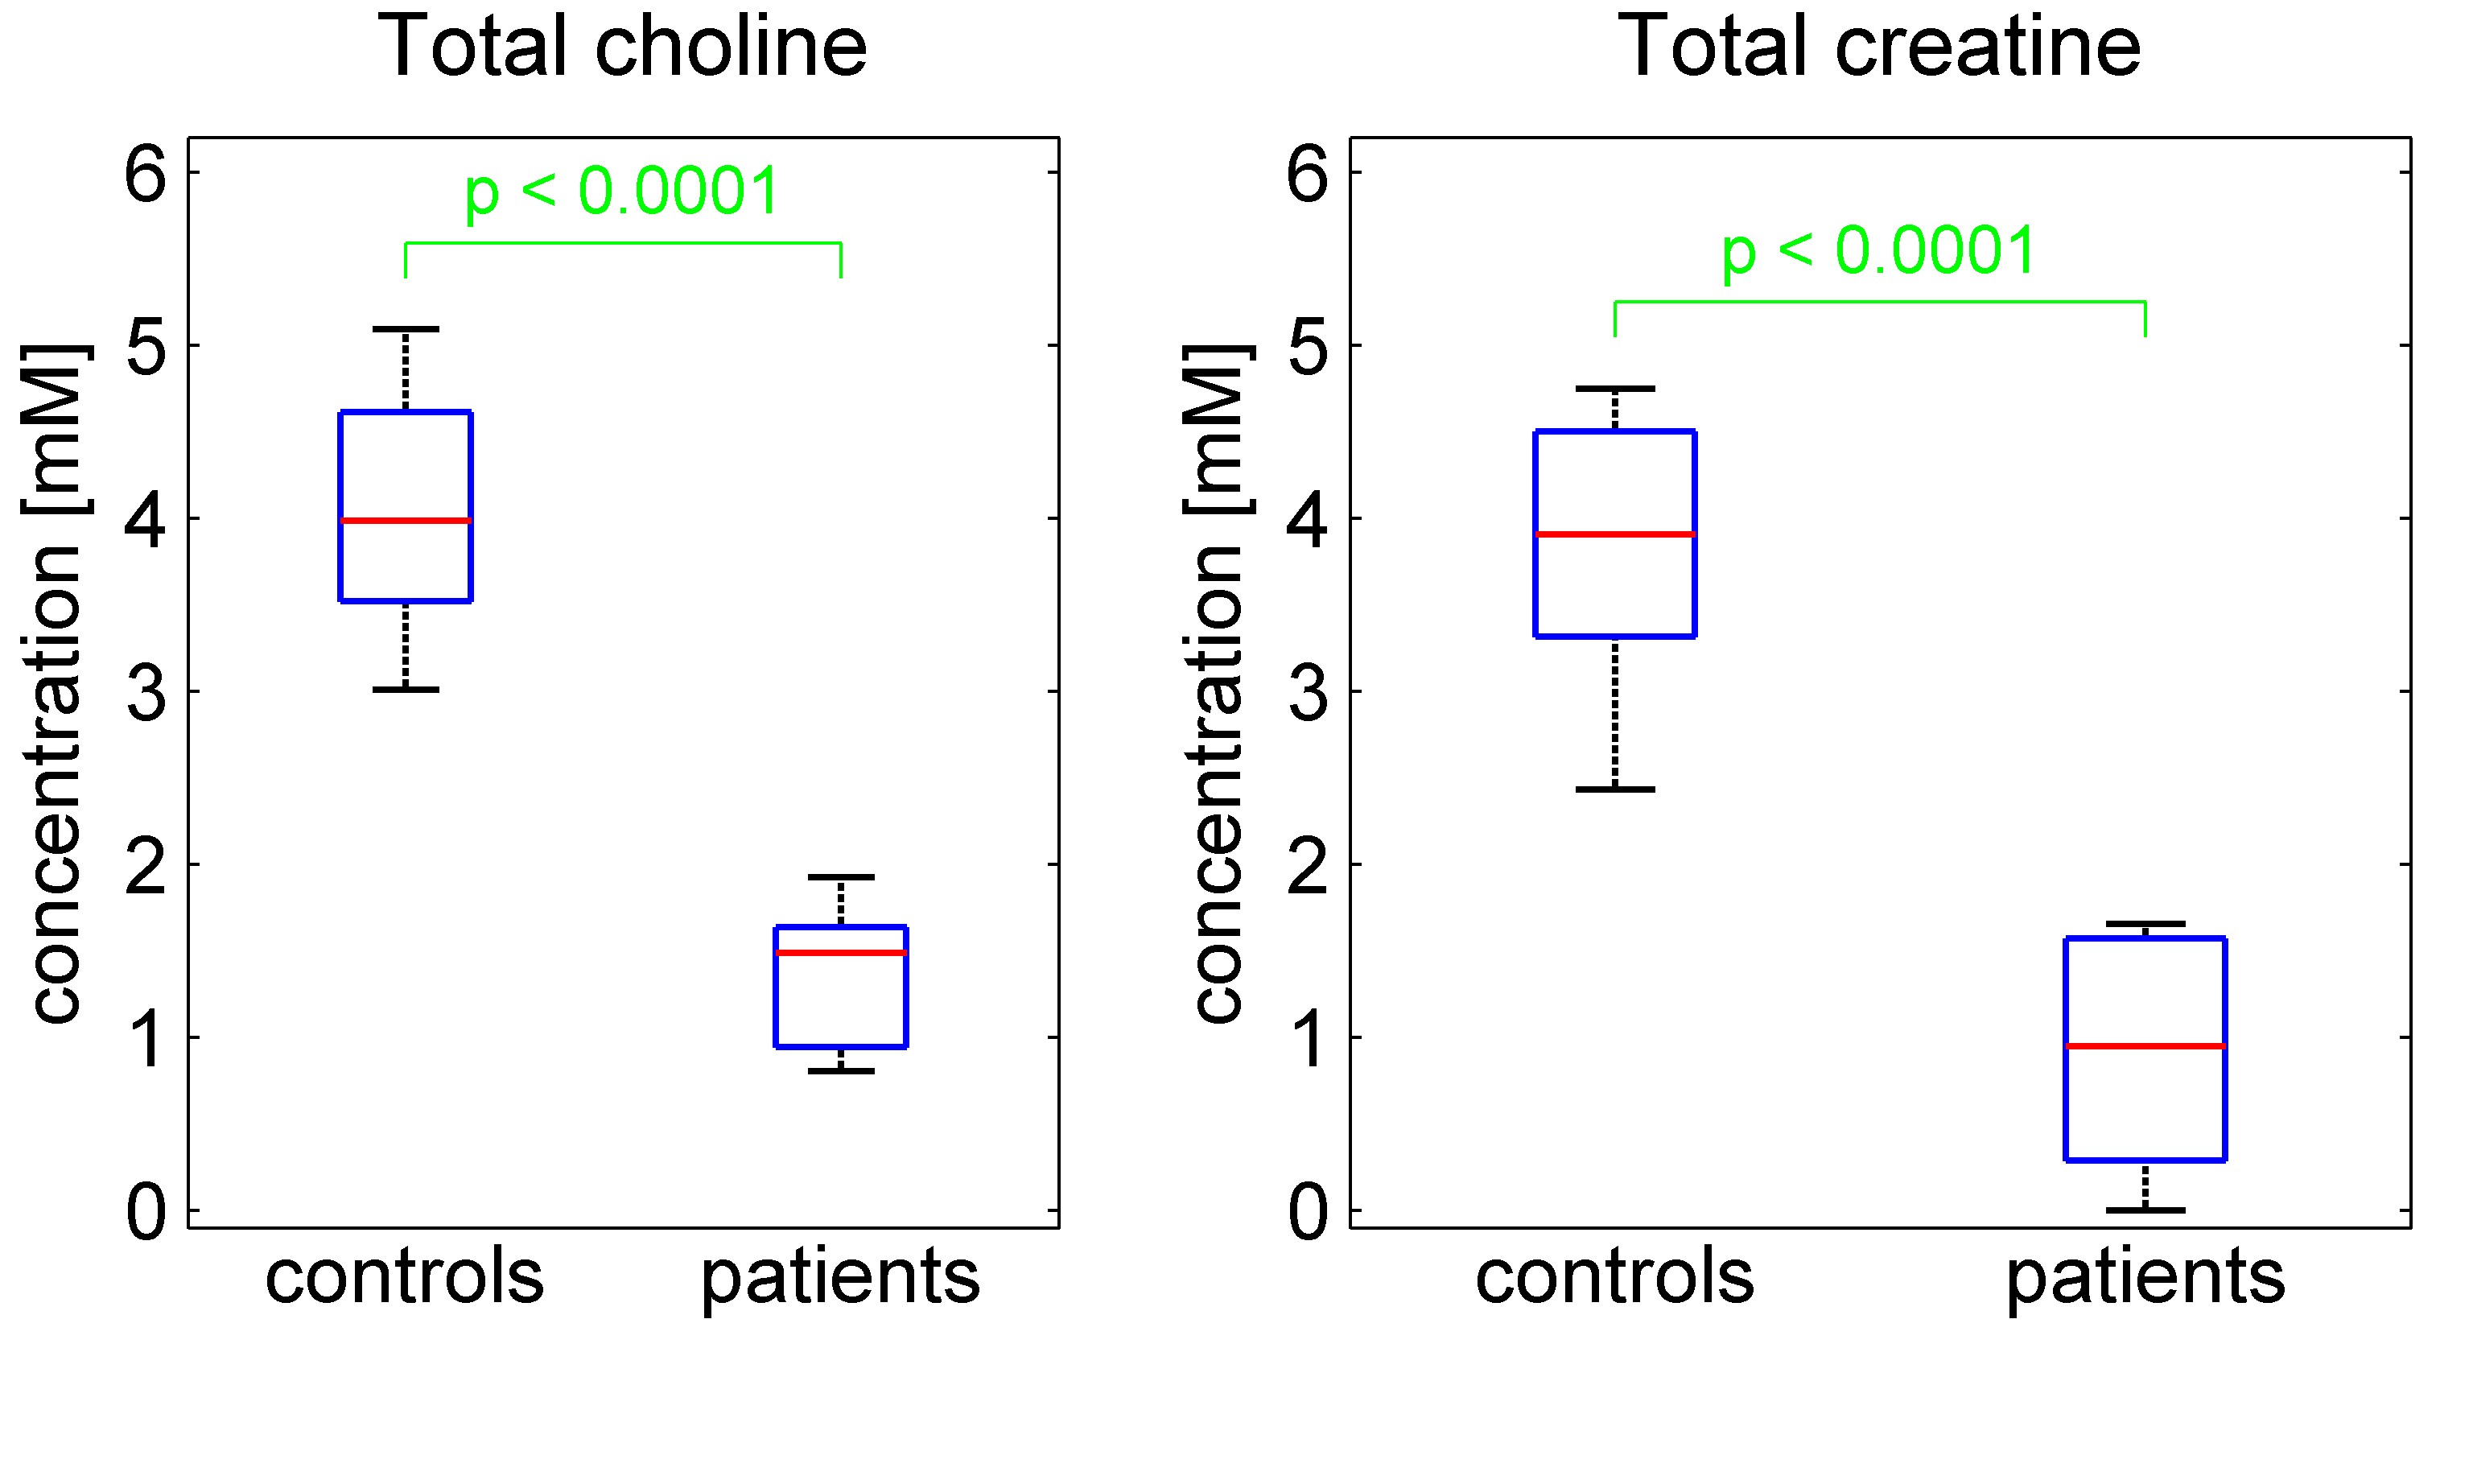
Spectra at TE=40ms were successfully acquired in all patients (Figure 4), either in both testes (four patients) or in a single testis, due to insufficient time (3 patients) or orchiectomy (1 patient). Averaged over left and right testes, total choline was significantly lower in patients (mean 1.4mM, range 0.8 – 1.9mM) than controls (mean 4.1mM, range 3.0 – 5.1mM), p<0.0001 (Figure 5). Total creatine was also significantly lower in patients (mean 0.9mM, range: undetectable – 1.7mM) than controls (mean 3.8mM, range 2.4 – 4.7mM), p<0.0001. The patient with the highest levels of tCho and tCr was the one with oligospermia.
Discussion and conclusions
Spectra were successfully acquired even in patients with very small testes. Total choline and creatine concentrations were significantly lower in patients than controls, with no overlap in values between groups. This suggests that spectroscopy may be valuable as a biomarker of spermatogenesis. One limitation of the study was the assumption that the water content of the testes was identical across subjects. Qualitative assessment of signal intensity on T2W-FSE images suggests that water content may be lower in some patients. If true, the difference in metabolite concentrations between patients and controls may be wider than our results suggest. Use of an external water reference may be useful in calibrating water content. Future work will investigate whether 1H-MRS can predict the absence or presence of sperm in patients scheduled for TESE.Acknowledgements
P.S. is grateful to Sanjeev Chawla PhD, Ke Zhang PhD, Nicole Hindman MD, Ivan Kirov PhD and Martin Wilson PhD for their advice regarding the spectroscopy acquisition, shimming procedure, imaging protocol, spectral fitting and use of TARQUIN respectively. This work was supported in part by an NIH grant P41 EB017183.References
1. Cocuzza M, Alvarenga C, Pagani R. Epidemiology and Etiology of Azoospermia. Clinics. 2013;68(Suppl 1):15-26
2. Vloeberghs V, Verheyen G, Haentjens P, Goossens A, Polyzos NP, Tournaye H. How successful is TESE-ICSI in couples with non-obstructive azoospermia? Hum Reprod. 2015 Aug;30(8):1790-6.
3. Everaert K, De Croo I, Kerckhaert W, Dekuyper P, Dhont M, Van der Elst J, De Sutter P, Comhaire F, Mahmoud A, Lumen N. Long term effects of micro-surgical testicular sperm extraction on androgen status in patients with non obstructive azoospermia. BMC Urol. 2006; 6: 9.
4. Aaronson DS, Iman R, Walsh TJ, Kurhanewicz J, Turek PJ. A novel application of 1H magnetic resonance spectroscopy: non-invasive identification of spermatogenesis in men with non-obstructive azoospermia. Hum Reprod. 2010 Apr;25(4):847-52
5. Wilson M, Reynolds G, Kauppinen RA, Arvanitis TN, Peet AC. A constrained least-squares approach to the automated quantitation of in vivo ¹H magnetic resonance spectroscopy data. Magn Reson Med. 2011 Jan;65(1):1-12
6. Altman PL, Dittmer DS (1964) Biology Data Book. Washington D.C.: Federation of American Societies for Experimental Biology.
Figures