3288
Multiparametric Assessment of Acute Kidney Injury1Sir Peter Mansfield Imaging Centre, University of Nottingham, Nottingham, United Kingdom, 2Centre for Kidney Research and Innovation, University of Nottingham, Nottingham, United Kingdom
Synopsis
Acute Kidney Injury (AKI) is a sudden reduction in kidney function, with causes and degree of renal recovery varying widely between individuals. MRI provides a method to assess changes associated with AKI. Here, we use multi-parametric MRI to monitor renal changes in AKI at time of injury and recovery. At peak AKI an increase was seen in renal volumes and T2* values while cortical ADC and perfusion was lower during the AKI phase. T1 maps showed an increase at time of AKI with a reduction in corticomedullary differentiation. At 3 months post AKI, T1 remained higher than HVs.
Purpose
Acute Kidney Injury (AKI) is a sudden reduction in kidney function, with causes and degree of renal recovery varying widely between individuals. MRI provides a method to assess both functional and structural changes in the kidney associated with this renal pathophysiology. Mouse models of AKI have shown increased longitudinal relaxation time (T1) from day 7–28 following AKI1 and decreased ASL perfusion measures,2 with changes in T1 and perfusion differentiating AKI severity. Further, the transverse (T2) relaxation time has been shown to increase whilst the apparent diffusion coefficient (ADC) decreases at day 7 following AKI.3 Here, we use multi-parametric MRI to monitor renal changes in AKI patients at time of injury and in recovery.Methods
Data Acquisition: Three patients with AKI Stage 3 (1M; 29-51yrs, no pre-existing kidney disease) were scanned 2–5 days and 3 months following peak AKI, and will be assessed again at 1 year. 7 healthy volunteers (HV) were scanned as a reference. Serum creatinine and eGFR measures were acquired at each visit. Scanning was performed on a 3T Philips Ingenia scanner (Multi-Transmit, dStream). Localiser bTFE scans were acquired in three orthogonal planes for planning and organ volume measures. ASL, T1, and DWI data were acquired in matched space (FOV 288x288mm, resolution 3x3x5mm, SENSE 2) using respiratory-triggered schemes with 5 coronal-oblique slices collected using a spin-echo EPI readout. ASL was collected using a flow alternating inversion recovery (FAIR) scheme (in-plane pre- and post-saturation, post-label delay 1800ms, selective(S)/non-selective(NS) thickness 45/400mm, 25 pairs). Inversion recovery T1 data was acquired at 13 inversion times with a SE-EPI readout. DWI data was acquired with 8 b-values. T2* data was acquired with an mFFE scheme with 16 echo times (TE 1.4ms, echo spacing 1.4ms, voxel resolution1x1x5mm and FOV 350x350mm). T1 measures were also obtained using a bFFE readout at higher resolution (1.5x1.5mm). PC-MRI was used to assess renal artery blood flow with bTRANCE angiography to ensure measurements were taken prior to any bifurcations.
Data Analysis: Kidney volumes were calculated from bTFE scans (Analyze9). All multiparametric maps were generated using Matlab. Inversion recovery data was fit to form T1 maps. Perfusion maps were formed from the average perfusion weighted images (S-NS) normalised to a base magnetisation image which were fit to a kinetic model to calculate perfusion maps. mFFE data was fit to compute T2* maps. DWI data was fit to both an ADC and an IVIM model to calculate D, D* and perfusion fraction. Cortex and medulla masks were created from the T1 maps. All measures are the mode of histogram analysis. Vessel flow was analysed using Philips ViewForum Qflow software, and used to compute global kidney perfusion by combining with kidney volume.
Results
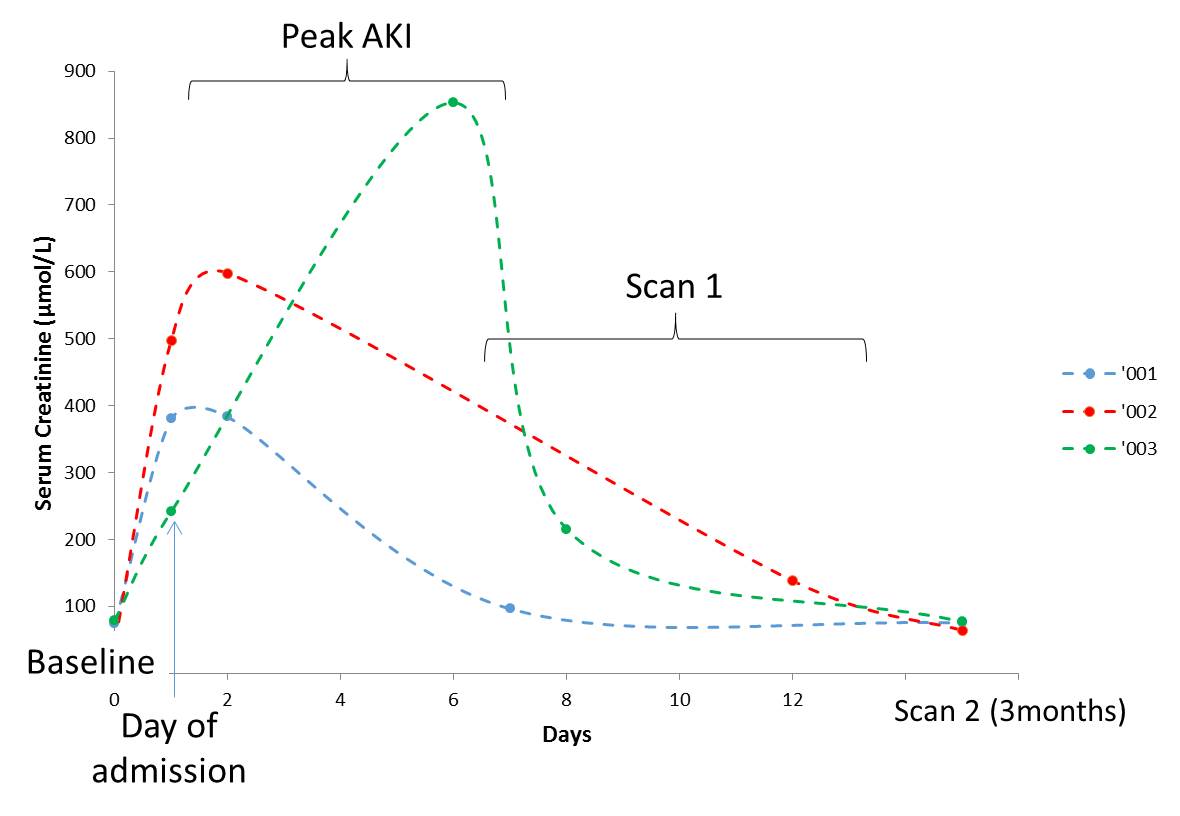
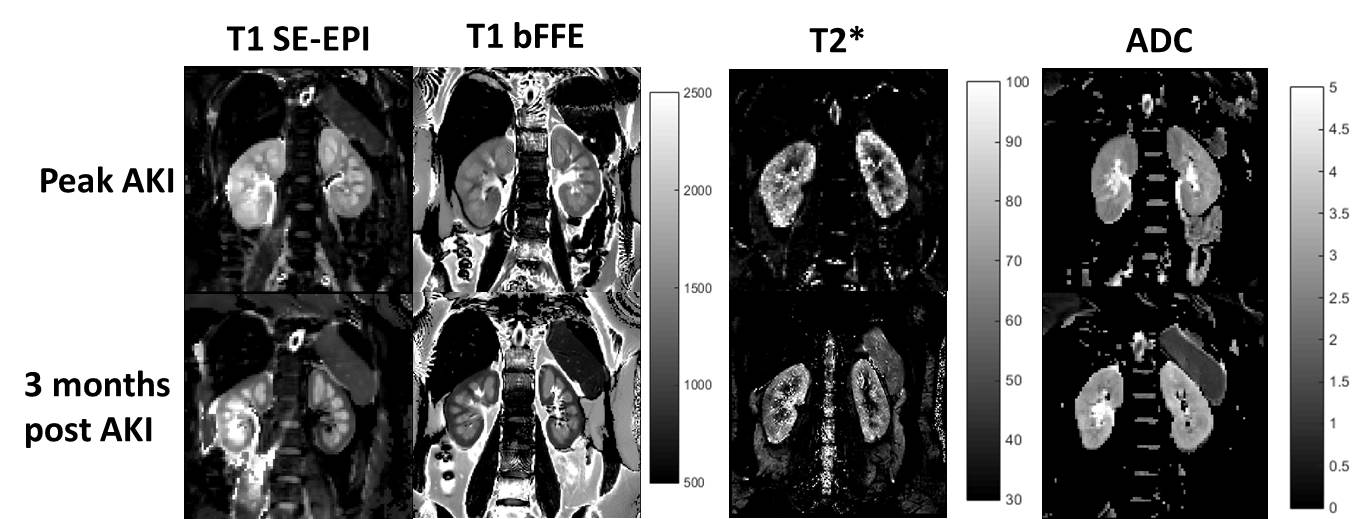
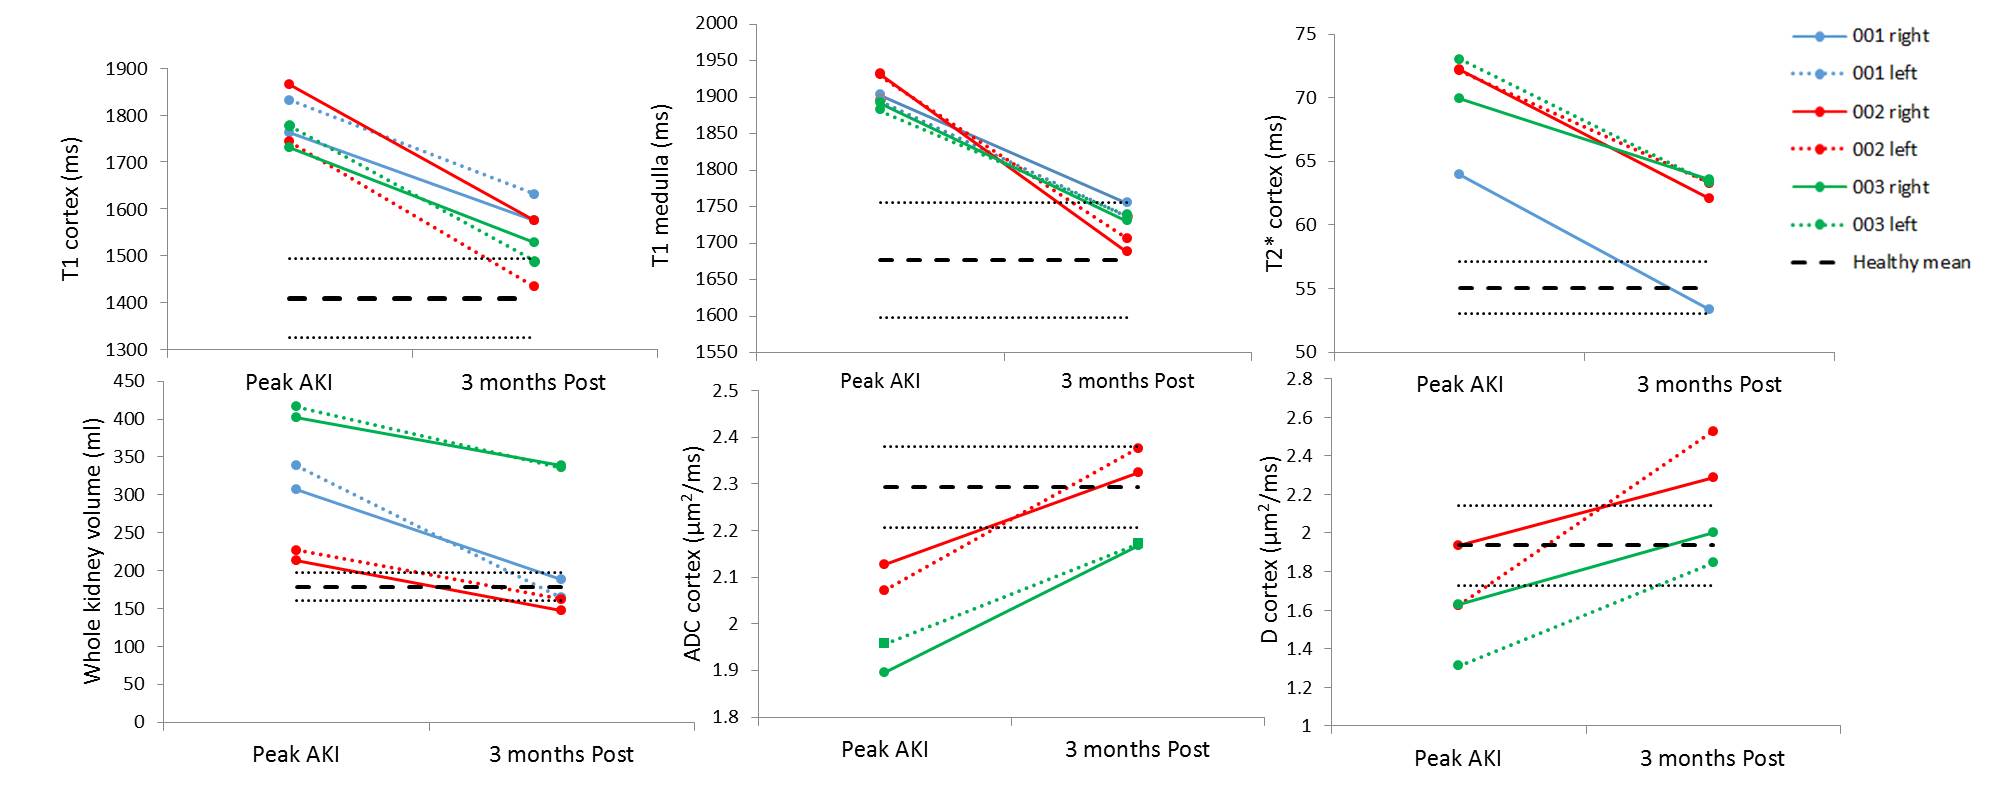
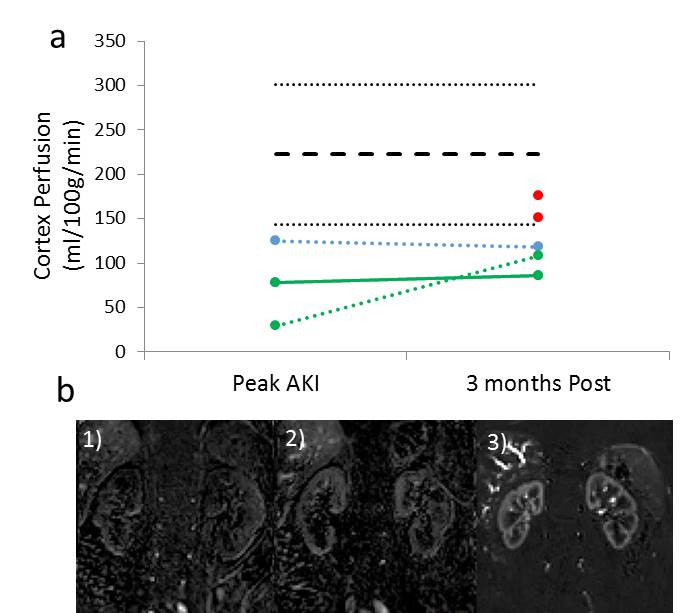
Figure 1 shows the serum creatinine levels for each of the AKI patients. Example T1, T2* and ADC maps in AKI are shown in Figure 2. At peak AKI, renal volume was seen to increase in comparison to HVs, this was also true for renal cortex T2* and T1 values, while ADC, D and perfusion were reduced (Figure 3-4). Comparing patients between peak and 3 months post AKI, cortical ADC and D returned to normal levels, whilst T2* and renal volumes were elevated in some and perfusion still reduced. T1 maps showed a pronounced increase at time of AKI with reduced corticomedullary differentiation (103 ± 48 ms Peak AKI, 206 ± 42 ms 3 months), and whilst these values reduced at 3 months, T1 values remained higher than for HVs.Discussion
This is the first human study to use multi-parametric MRI to assess kidney function and structure during an episode of AKI. The acute phase of AKI is associated with inflammation of the renal parenchyma4 with associated cell swelling and interstitial oedema leading to water accumulation in intracellular and extracellular space. The pronounced increase in T1 and decrease in ADC and D during peak AKI are consistent with this, with values above normal range at 3 months. Any persistent increase at 3 months is potentially related to renal fibrosis following AKI. Perfusion was reduced during the AKI phase showing renal impairment, whilst T2* increased. Our findings are in-line with animal models.1-3 Importantly, significant changes were detectable with MRI measures despite return of serum creatinine values to within normal range (clinical approach to determine recovery post-AKI). Results suggest MRI provides valuable measures to understand the mechanisms underlying AKI and has the potential to identify the prognosis of AKI patients, evaluate therapies to prevent/ameliorate AKI, and predict progression to chronic kidney disease.Acknowledgements
This work was funded by the MRC Confidence in Concept Award.References
1. Hueper K, Peperhove M, Rong S, et al. T1-mapping for assessment of ischemia-induced acute kidney injury and prediction of chronic kidney disease in mice. Eur. Radiol. 2014;24:2252–60.
2. Hueper K, Gutberlet M, Rong S, et al. Acute Kidney Injury: Arterial Spin Labeling to Monitor Renal Perfusion Impairment in Mice—Comparison with Histopathologic Results and Renal Function. Radiology, 2013;270:117-124
3. Heuper K, Rong S, Gutberlet M, et al, T2 Relaxation Time and Apparent Diffusion Coefficient for Noninvasive Assessment of Renal Pathology After Acute Kidney Injury in Mice: Comparison With Histopathology. Invest. Radiol 2013;48: 834-82
4. Rabb H, Griffin MD, McKay DB, et al. Inflammation in AKI: Current Understanding, Key Questions, and Knowledge Gaps. J Am Soc Nephrol. 2016;27(2):371-9.
Figures