3287
Reproducibilty of Multiparametric Assessment of Chronic Kidney Disease1Sir Peter Mansfield Imaging Centre, University of Nottingham, Nottingham, United Kingdom, 2Centre for Kidney Research and Innovation, University of Nottingham, Nottingham, United Kingdom
Synopsis
Chronic kidney disease (CKD) is a heterogeneous disease, with previous studies showing conflicting changes in MR parameters. Here, we use multi-parametric MRI of DWI, T1 and T2* mapping and ASL to assess haemodynamic and structural changes in Stage 3 and 4 CKD patients and examine the reproducibility of these measures. A significant reduction in renal cortex ADC and perfusion was found between CKD patients and healthy volunteers. In contrast, renal cortex and medulla T1 values increased in CKD, with a reduction in corticomedullary differentiation. MR measures in CKD patients were found to be highly reproducible between scan sessions.
Purpose
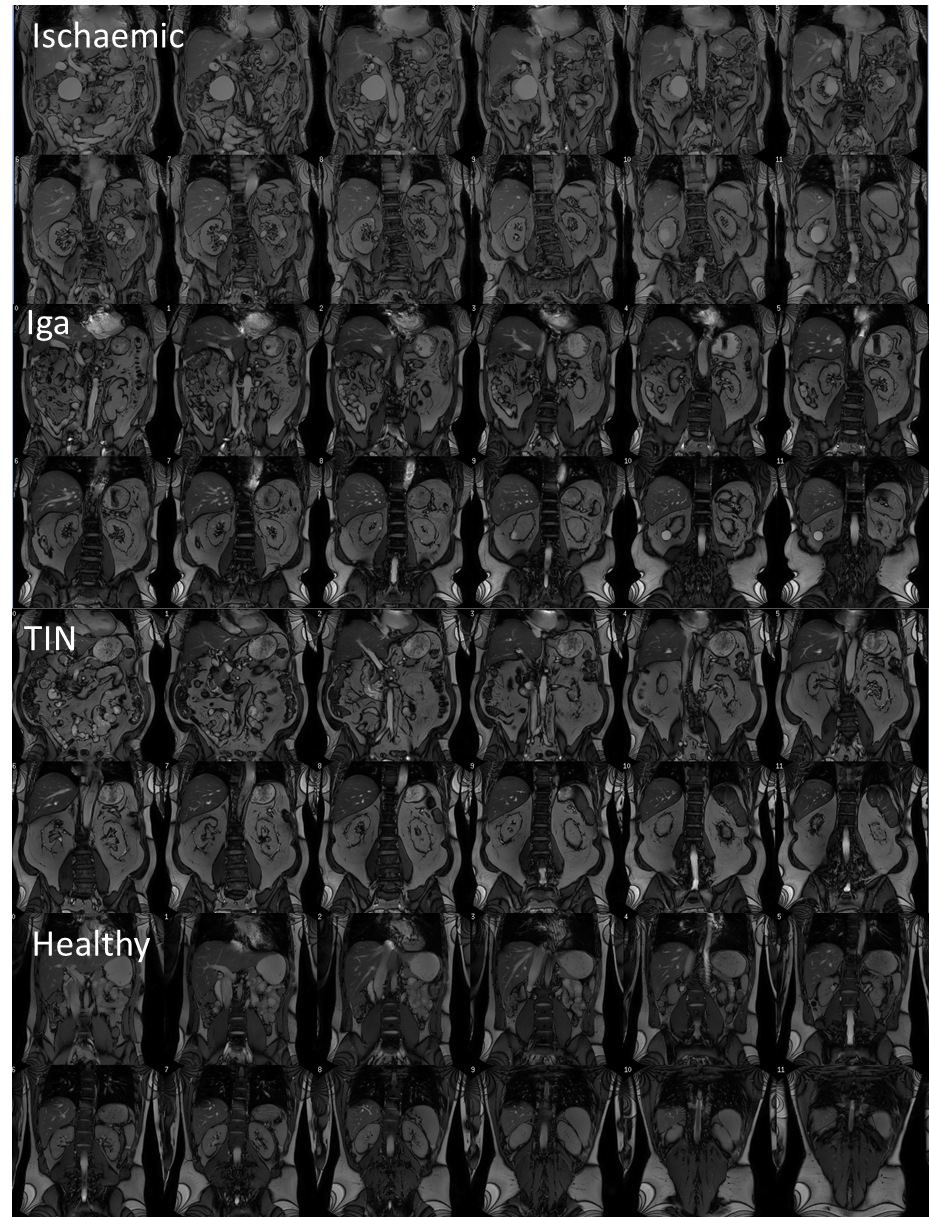
Chronic kidney disease (CKD) is a heterogeneous disease and structural MR images of kidneys vary widely (Figure 1). Previous studies have shown conflicting changes in CKD, with some groups reporting a reduction in oxygenation in CKD, whilst others report no differences in cortical or medullary R2*.1 Others have shown cortical perfusion levels to be lower in CKD than healthy subjects,2,3 and an increase in longitudinal (T1) relaxation time in CKD.4 Further, diffusion-weighted imaging (DWI) ADC values have been shown to reduce in CKD compared to healthy subjects.5 A recent study has demonstrated changes in both kidney ADC and T1 in animal models.6 Here, we use multi-parametric MRI to assess haemodynamic and structural changes in CKD patients and examine the reproducibility of these measures.Methods
All patients were CKD Stage 3 or 4 (eGFR range 23–51 ml/minute/1.73 m2) with a renal biopsy as part of routine clinical care; four patients were diagnosed with tubulointerstitial disease (TID), six patients with ischaemic nephropathy (Ischaemic) and four with glomerulonephritis (Iga).
Data Acquisition: 14 CKD patients (10M/4F, 56±19 years) were scanned twice, a maximum of two weeks apart to assess reproducibility of MRI measures. In addition, data was collected on 7 healthy volunteers (HV) (6M/1F). Scanning was performed on a 3T Philips Ingenia scanner (Multi-Transmit, d-Stream). Localiser bFFE scans were acquired in three orthogonal planes for organ volume measures. ASL, T1, and DWI data were acquired in matched space (FOV 288x288mm, 3x3x5mm voxels, SENSE-factor 2) using respiratory-triggered schemes with 5 coronal-oblique slices collected using a spin-echo EPI readout. ASL employed a flow alternating inversion recovery (FAIR) scheme (in-plane pre- and post-saturation, post-label delay 1800ms, Selective(S)/non-selective(NS) thickness 45/400mm, 25 pairs) with corresponding inversion recovery T1 data acquired at 13 inversion times. DWI data was acquired with 8 b-values. In addition, T2* data was acquired with an mFFE scheme with 16 echo times (TE/ΔTE 1.4/1.4ms, 1x1x5mm voxels, FOV 350x350mm). T1 measures were also obtained using a higher spatial in-plane resolution bFFE readout (1.5x1.5mm voxels).
Data Analysis: Kidney volumes were calculated from the bTFE localiser (Analyze9). All multi-parametric maps were generated using Matlab. Inversion recovery data was fit to form T1 maps. Perfusion maps were formed from the average perfusion-weighted images (S-NS) normalised to a base magnetisation image and fit using the kinetic model to estimate renal perfusion maps. The mFFE data was fit to compute T2* maps. DWI data was fit to both an ADC model and an IVIM model to calculate D, D* and perfusion fraction. Cortex and medulla masks were created. All values reported reflect the mode of histogram analysis of multi-parametric maps. To assess reproducibility, the coefficient of variance (CoV) of all measures was computed between sessions.
Results
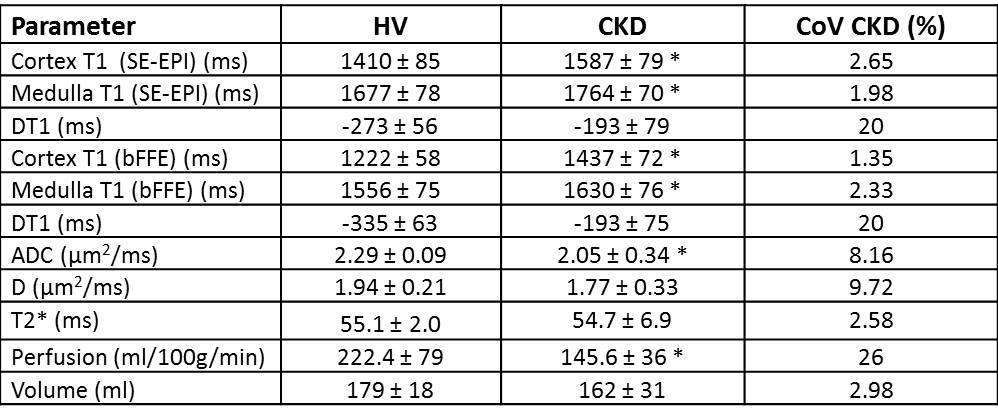
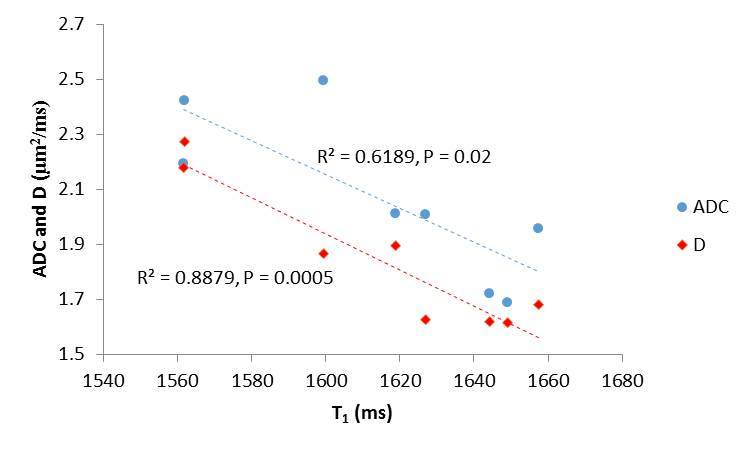
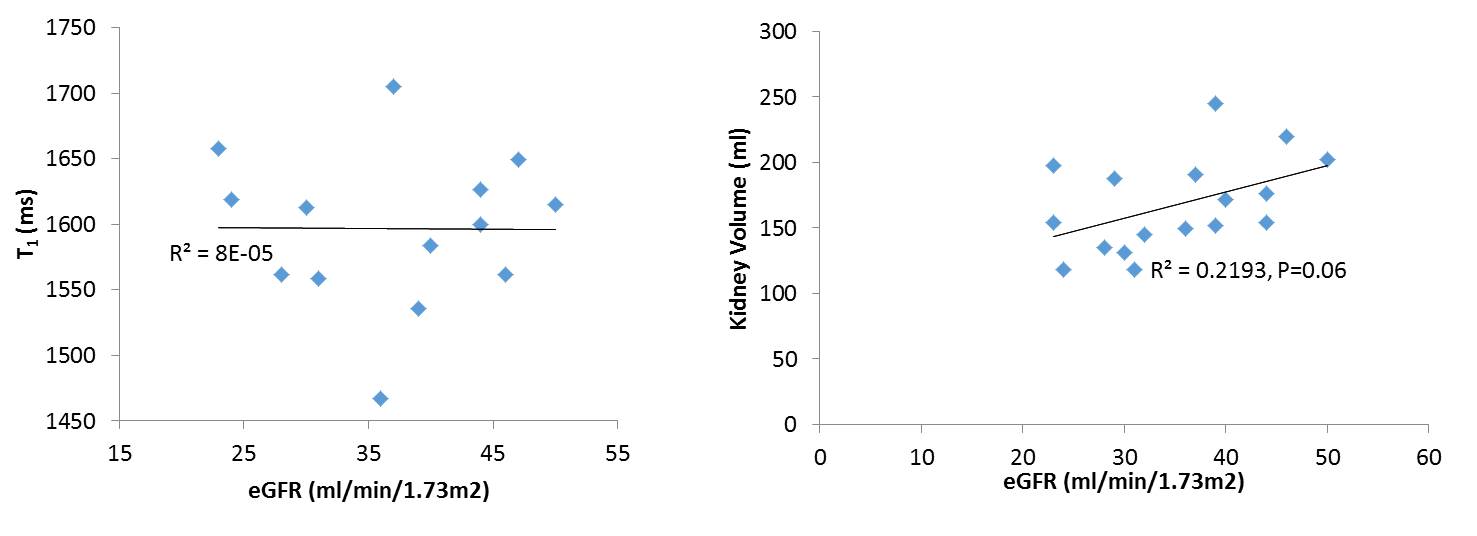
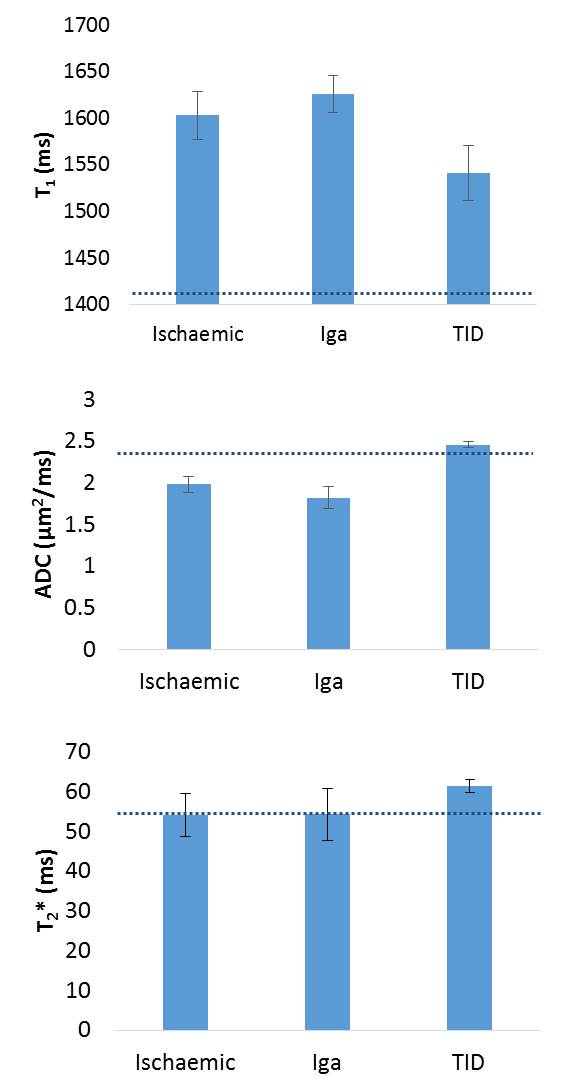
FIgure 2 shows values of total kidney volume, cortex and medulla T1 (SE-EPI and bFFE), DWI (ADC and D) and perfusion for the CKD group and their associated CoV, and a comparison with HV measures. T1 was significantly increased in CKD patients compared to HVs (P<0.001), with measures having a low CoV. Corticomedullary differentiation in T1 (ΔT1) was lower in CKD patients (P<0.001). ADC and D were reduced in CKD patients (P=0.01, 0.2 respectively) with a CoV of less than 10%, and perfusion was lower in CKD patients than HVs (P=0.003). There was no significant difference in kidney volume (P=0.4) or T2* (P=0.9) between the groups despite a low CoV in these measures. A significant correlation was seen with increasing T1 (SE-EPI) associated with a reduction in ADC and D, Figure 3. No significant correlation was found between any MR parameters with eGFR over this narrow range of CKD patient eGFR values, Figure 4. When separating patients into the three CKD aetiologies (Ischaemia, Iga and TID), the TID group evidenced a distinct pattern of abnormalities, Figure 5.Discussion
This study has assessed the differences in multi-parametric measures between CKD patients and HVs. Significant differences were seen in perfusion, T1 and ADC values between CKD patients and HVs. Reproducibility in measures was assessed in CKD patients; T1, T2*, volume and ADC measures were found to be highly reproducible with CoV<10%. When separating the CKD patients into three groups (Ischemia, Iga and TID), a difference was observed across several parameters for TID patients, suggesting distinct pathophysiological mechanisms in this diagnosis. This difference will be further explored via the assessment of histology from the patient biopsies.Acknowledgements
This work was funded by the MRC Confidence in Concept Award and the Dr Hadwen Trust. The Dr Hadwen Trust (DHT) is the UK’s leading non-animal biomedical research charity that exclusively funds and promotes human-relevant research that replaces the use of animals whilst supporting the progress of medicine.References
1. Pruijm M, Hofmann L et al. Determinants of renal tissue oxygenation as measured with BOLD-MRI in Chronic Kidney Disease and hypertension in humans. PLoS ONE 2014 9(4)
2. Rossi C, Artunc F et al. Histogram analysis of renal arterial spin labeling perfusion data reveals differences between volunteers and patients with mild chronic kidney disease. Invest Radiol, 2012; 47(8); 490-6.
3. Tan H, Koktzoglou I, Prasad PV. Renal perfusion imaging with two-dimensional navigator gated arterial spin labeling. Magn Reson Medl 2014 Febl 71(2) 570-9.
4. Gillis KA, McComb C, Patel RK. Non-contrast magnetic resonance imaging to assess perfusion and corticomedullary differentiation in health and chronic kidney disease. Nephron, 2016; 133(3) 183-92
5. Goyal A, Sharma R, Bhalia AS et al. Diffusion-weighted MRI in assessment of renal dysfunction. Indian J Radiol Imaging; 2012l Jul; 22(3);155-9.
6. Friedli I, Crowe LA, Berchtold et al. New magnetic resonance imaging index for renal fibrosis assessment: a comparison between diffusion weighted imaging and T1 mapping with histological validation. Nature scientific reports; 2016; 10.1038.
Figures