3277
Optimized 2D-PACE for aorta blood flow gating and its application in T1W morphological cMRI1Siemens Shenzhen Magnetic Resonance Ltd., ShenZhen, People's Republic of China
Synopsis
Electrocardiogram gating is commonly used in clinical cardiac MRI. However, it takes time to attach ECG electrodes and gating signals can be easily affected. In this abstract, the 2D-PACE technique is optimized for blood flow monitoring to explore its potential as an alternative to ECG gating. A new protocol triggered by 2D-PACE for T1W cardiac morphology was also proposed. Our results showed that the optimized 2D-PACE was robust for blood flow peak detection. And combining with our new protocol, it provided comparable image quality to those from ECG gated conventional protocol, which showed a great potential for cardiac triggering.
Purpose
One of the most important factors for successful cardiac MRI (cMRI) is the accurate synchronization of data acquisition with respect to motion of the heart beating. To date, electrocardiogram (ECG) gating has been the most commonly used synchronization technique in clinical cMRI application1. However, it takes time to attach the ECG electrodes onto the patient body, and gating signals can be easily affected by several factors, including blood flow, magnetic field, imaging sequence and etc. 2D-PACE (Prospective Acquisition CorrEction)2 has been widely used for respiratory monitoring and triggering. In this abstract, however, we optimized 2D-PACE for blood flow monitoring to explore its potential as an alternative to ECG gating. Its application for T1 weighted cardiac morphology imaging was also evaluated.Methods
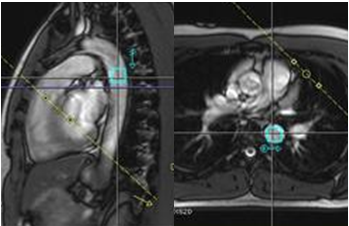
2D-PACE is optimized for cardiac synchronization by means of monitoring blood flow. First, the temporal resolution of PACE scout is reduced to 20ms per frame by increasing the readout bandwidth and decreasing phase encoding lines and preparation scans. Second, PACE scout ROI is placed at the descending aorta3 (Fig.1). The readout is along the blood flow direction. Thus the phase sensitivity to blood flow is maximized by the bipolar readout gradient. Third, coronal view is preferred for positioning the ROI, in order to minimize the signal pollution from the heart. Based on the above, the phase information of the blood flow in descending aorta can be acquired and interpreted into flow curve for gating.
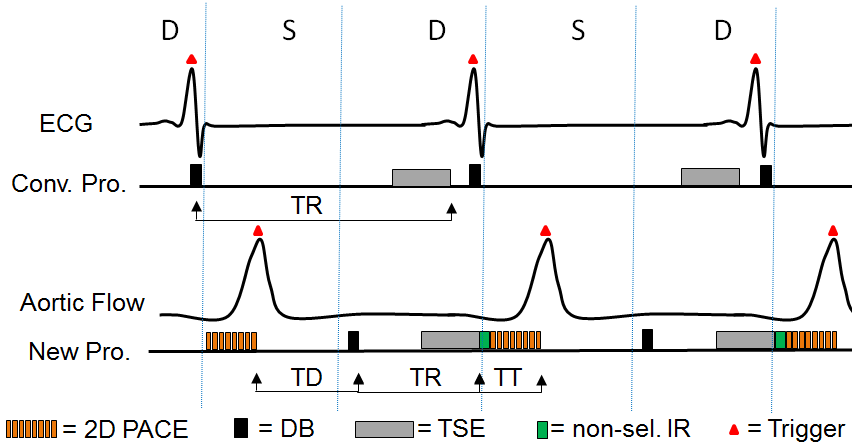
Fig.2 illustrates the conventional (Conv.) and our new T1W TSE protocols in synchronization with ECG gating and 2D-PACE respectively. Comparing to ECG gating which triggers at R-peak during end of diastole, PACE triggers at the aortic flow peak during systole4. Therefore, with the dark blood (DB) preparation applied in the immediate diastole, the TR of the new protocol is much shorter than that of Conv. protocol. Besides, to avoid the signal loss due to cardiac motion if ever DB situated in systole, the DB thickness is set to 300% for the new protocol. While it remains 200% for the conventional. Given trigger delay (TD) = RR interval – TT – TR, where TT is the execution time for the triggering sequence. For the new protocol, TR = 300ms, TD (300 ~500ms) are subject to individual variants; for conventional, TR is set by default according to RR interval, Max.TR = 750ms, TD = 0. Note that due to short TR and the prior non-slice selective IR in DB, in the new protocol a non-slice selective IR pulse needs to be applied after the TSE sequence to flip negative Mzblood back to +z axis. It is important to keep the direction of Mzblood the same before each 2D-PACE to avoid unexpected phase variations in the latter.
All the data were acquired at a 1.5T MR system (MAGNETOM Aera, Siemens Healthineers, Germany) with 18 channel body array coil and 24 channel spine array coil. Three sets of data were acquired for comparison: ECG triggered Conv. protocol, PACE triggered new protocol and ECG triggered new protocol. Except above mentioned, all imaging parameters are the same for Conv. and new protocols: TE = 24 ms, BW = 850Hz/Px, FOV = 276mm×340mm, acquisition matrix = 126×256, slice thickness = 5 mm, GRAPPA = 2.
Results and Discussion
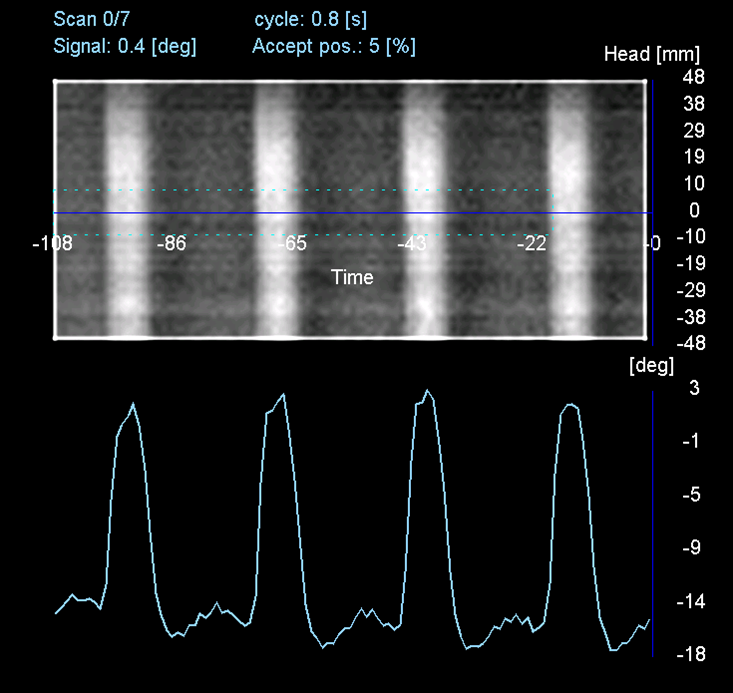
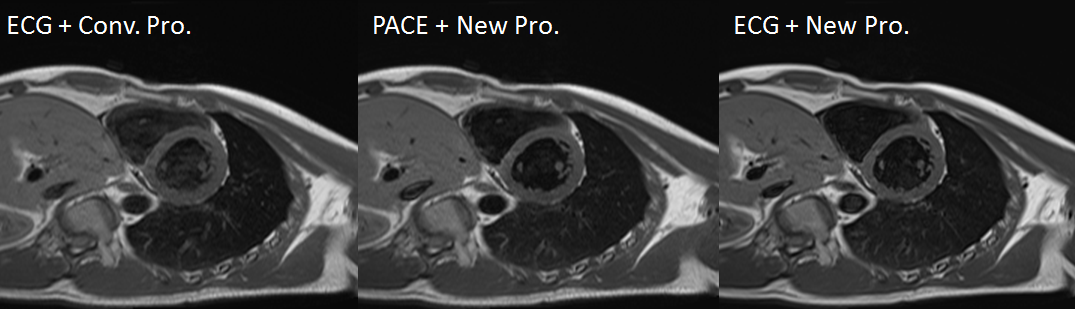
As shown in Fig.3, the signal derived from 2D-PACE was clean, with fine temporal resolution depicting flow curve, and thus is robust for peak detection and cardiac triggering. Representative images are shown in Fig.4. While the image acquired with Conv. protocol triggered by ECG displayed blurring and insufficient dark blood, the image acquired with new protocol triggered either by 2D-PACE or ECG gating demonstrated superior image quality in terms of less blurring and better blood suppression. Our results suggested that the new protocol with shorter TR outperformed the conventional one, while 2D-PACE triggering itself didn’t seem to affect the image quality.Conclusion
Images acquired with new protocol using either 2D-PACE or ECG triggering showed comparable, if not superior image quality to those acquired with Conv. protocol using ECG triggering. We can conclude that firstly the new protocol can be an alternative to Conv. protocol; secondly, 2D-PACE monitoring aorta blood flow is an effective triggering method working with the new protocol. Therefore, with much simplified patient preparation, our optimized 2D-PACE proved to be a viable alternative to external physiological signal detection devices. Future work will focus on developing protocols in work with 2D-PACE for a broader range of cardiac MRI applications.
Acknowledgements
No acknowledgement found.References
1. Lanzer P, Barta C, Botvinick EH, et al. ECG-synchronized cardiac MR imaging: method and evaluation. Radiology. 1985; 155:681-686.
2. Morita S, Ueno E, Suzuki K, et al. Navigator-Triggered Prospective Acquisition Correction (PACE) Technique vs. Conventional Respiratory-Triggered Technique for Free Breathing 3D MRCP: An Initial Prospective Comparative Study Using Healthy Volunteers. JMRI. 2008; 28:673–677.
3. Shreyas S, Vasanawala TS, Sachs JH, et al. Prospective MR Signal-Based Cardiac Triggering. MRM. 1999; 42:82-86.
4. Milnor WR. Hemodynamics. 2nd ed. 1989; 145.
Figures