3274
Improving Shear Wave Signal-to-Noise Ratio in 3D High Frequency Cardiac Magnetic Resonance Elastography with Subjects in Prone Position1Radiology, Mayo Clinic, Rochester, MN, United States, 2Cardiovascular Diseases, Mayo Clinic, Rochester, MN, United States, 3Biomedical Engineering and Physiology, Mayo Clinic, Rochester, MN, United States
Synopsis
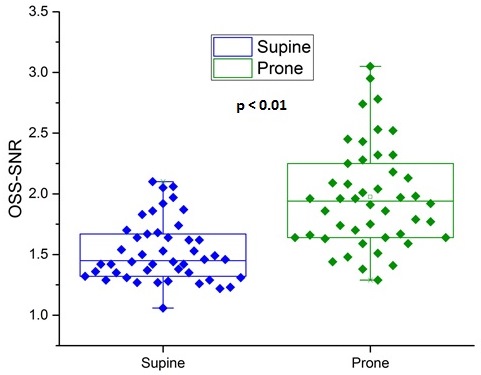
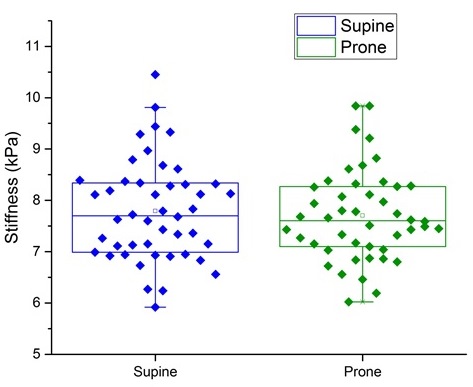
Myocardial stiffness is a novel biomarker for diagnosing a variety of cardiac diseases. Our recent work demonstrated the feasibility of measuring in-vivo myocardial stiffness using 3D high frequency cardiac MR elastography (MRE) in normal volunteers using octahedral signal-to-noise ratio (OSS-SNR) as a shear wave quality metric. The purpose of this work is to determine whether scanning subjects in prone position can improve the OSS-SNR compared to supine position. 47 healthy volunteers were enrolled and OSS-SNR in prone position (mean: 1.98) was significantly higher (p < 0.01) than the OSS-SNR in supine position (mean: 1.52) with comparable mean stiffness.
Purpose
Left ventricular (LV) pump function can be impaired with abnormal increase in myocardial stiffness which can lead to a variety of cardiac diseases (1, 2). The feasibility of a 3D high frequency cardiac MRE technique at 140 Hz to measure in-vivo myocardial stiffness with adequate octahedral signal-to-noise ratio (OSS-SNR) was recently demonstrated (3). A high level of agreement of 3D MRE derived stiffness with dynamic material testing (intra-class correlation coefficient up to 0.99) was demonstrated provided sufficient OSS-SNR and adequate spatial resolution are available (4).However, in a clinical setting, achieving higher OSS-SNR can be challenging, in particular for cardiac MRE, due to the dynamic nature of the heart and the influence of other motion noise. The purpose of this work was to determine whether OSS-SNR can be improved by scanning subjects in prone position compared to supine for 3D high frequency cardiac MRE in a cohort of healthy volunteers.Methods
Forty seven healthy volunteers (Male = 20; Female = 27) between ages 18-35 were enrolled with institutional review board (IRB) approval and informed consent was obtained from all the participants. Cardiac MRE was performed at 140 Hz vibration frequency as previously described (3) with subjects in both supine and prone position for this study, which also included a “no-motion” scan for noise discrimination. Shear wave quality in prone and supine position was assessed by calculating the octahedral shear strain signal to noise ratio (OSS-SNR) (5). A threshold value for OSS-SNR was established for this study to ensure adequate signal for stiffness estimation to be two standard deviations from the mean OSS-SNR value of the “no-motion” scans. MRE stiffness was obtained by applying curl to the 3D displacement field and performing 3D Local Frequency Estimation (LFE) (6) on the segmented LV.Results
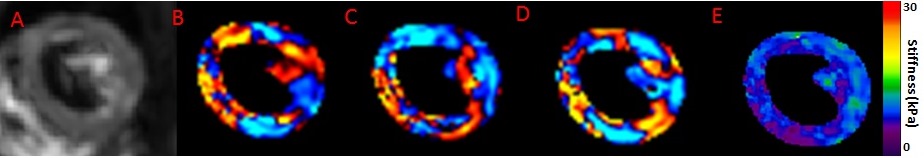
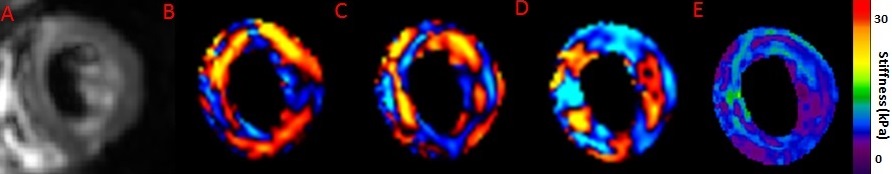
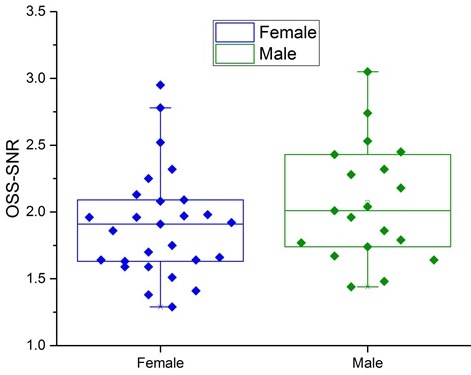
With a mean “no-motion” OSS-SNR of 0.82 an approximate threshold of 1.1 was estimated to discriminate noisy scans, which resulted in only one excluded exam. Figure 1 shows the MRE images from a 26 year old male healthy volunteer in supine position and Figure 2 shows the images from the same volunteer in prone position. Figure 3 shows that the mean OSS-SNR is significantly higher (p<0.01) in normal volunteers in prone (mean: 1.98) than supine (mean: 1.52) position. Figure 4 shows the MRE shear stiffness in normal volunteers in supine (mean: 7.79 kpa) and prone position (mean: 7.70 kPa). Figure 5 shows that the mean OSS-SNR for males in prone position (mean: 2.07) is slightly higher than for females (mean: 1.91).Discussion and Conclusions
The results from this study demonstrate that cardiac MRE scans in prone position yield higher OSS-SNR, which is important for reliable stiffness estimation. These results motivate further validation of this finding as a promising approach for clinical cardiac MRE scans in the future.Acknowledgements
This work was supported by National Institutes of Health (NIH) grants 5R01HL115144 and EB001981 and Mayo Clinic Department of Radiology internal funding.References
1. Holmes JW, Borg TK, Covell JW. Structure and mechanics of healing myocardial infarcts. Annual review of biomedical engineering 2005;7:223-253.
2. Zile MR, Baicu CF, Gaasch WH. Diastolic heart failure--abnormalities in active relaxation and passive stiffness of the left ventricle. The New England journal of medicine 2004;350(19):1953-1959.
3. Arani A, Glaser KL, Arunachalam SP, Rossman PJ, Lake DS, Trzasko JD, Manduca A, McGee KP, Ehman RL, Araoz PA. In vivo, high-frequency three-dimensional cardiac MR elastography: Feasibility in normal volunteers. Magnetic resonance in medicine : official journal of the Society of Magnetic Resonance in Medicine / Society of Magnetic Resonance in Medicine 2016.
4. Arunachalam SP, Rossman PJ, Arani A, Lake DS, Glaser KJ, Trzasko JD, Manduca A, McGee KP, Ehman RL, Araoz PA. Quantitative 3D magnetic resonance elastography: Comparison with dynamic mechanical analysis. Magnetic resonance in medicine : official journal of the Society of Magnetic Resonance in Medicine / Society of Magnetic Resonance in Medicine 2016.
5. McGarry MD, Van Houten EE, Perrinez PR, Pattison AJ, Weaver JB, Paulsen KD. An octahedral shear strain-based measure of SNR for 3D MR elastography. Physics in medicine and biology 2011;56(13):N153-164.
6. Manduca A, Muthupillai, R., Rossman, P. J., Greenleaf, J. F., & Ehman, R. L. . Local wavelength estimation for magnetic resonance elastography. In Image Processing, 1996 Proceedings, International Conference on 1996;3:527-530.
Figures