3271
Statistical paradigm for composite MR Angiography generated from multi-contrast MRI1Department of Physics, University of Wisconsin - Madison, Madison, WI, United States, 2Department of Medical Physics, University of Wisconsin - Madison, Madison, WI, United States, 3Department of Radiology, University of Wisconsin - Madison, Madison, WI, United States, 4Department of Biomedical Engineering, University of Wisconsin - Madison, Madison, WI, United States
Synopsis
We present an innovative paradigm to overcome artifacts of individual MR angiography techniques by utilizing complimentary information existing across multi-contrast MR images. This technique applies Bayesian statistics to extract vessel likelihoods from each image type and generates a single ‘composite’ angiogram. Composite angiograms are computed utilizing black blood (BB), contrast enhanced MRA (CE-MRA), and phase contrast MRA (PC-MRA) images acquired in subjects with known neurovascular disease. The composite angiogram is demonstrated to improve vessel lumen depiction overcoming artifacts in individual source images from background enhancement, air cavities, and flow in CE-MRA, BB, and PC-MRA, respectively.
Purpose
MR angiography is an important tool for the non-invasive evaluation of cerebrovascular disease, but the diagnostic quality of common approaches can be compromised by artifacts. Non-contrast MRA can suffer from signal loss in regions of slow or turbulent blood flow, while contrast-enhanced MR angiography (CE-MRA) can suffer from overlapping venous structures, as in the cavernous sinuses. Here, we present a paradigm to overcome the shortcomings of individual MRA methods by utilizing complimentary information existing across black blood (BB), CE-MRA, and phase contrast (PC)-MRA of differing contrasts. This technique applies Bayesian statistics to extract vessel likelihoods from each image type and to generate a single ‘composite’ angiogram with improved characteristics for vessel lumen assessment.Theory
The proposed method determines the probability that a particular voxel is a vessel ($$$v$$$) given its intensity values in BB ($$$X_{\text{BB}}$$$), CE-MRA ($$$X_{\text{CE}}$$$), and PC-MRA ($$$X_{\text{PC}}$$$) images, namely $$$P(v|X_{\text{BB}}X_{\text{CE}}X_{\text{PC}})$$$. This probability is not readily available but Bayesian statistics allows its calculation in terms of more available probabilities:
$$P(v|X_{\text{BB}}X_{\text{CE}}X_{\text{PC}})=P(v)\frac{l(v|X_{\text{BB}})l(v|X_{\text{CE}})l(v|X_{\text{PC}})}{P(X_{\text{BB}})P(X_{\text{CE}})P(X_{\text{PC}})}$$
where P(v) is the prior probability of vessels, and $$$l(v|X)$$$’s are the vessel likelihoods given intensity X in the corresponding image. Unlike $$$P(v|X_{\text{BB}}X_{\text{CE}}X_{\text{PC}})$$$, $$$l(v|X)$$$'s can be easily estimated with known locations of vessels in training data sets, obtained either through manual or unbiased automatic segmentation. The final vessel probability reflects vessel likelihoods given by each MR image considered, and yields improved angiogram which fully extracts complimentary information among them.
Methods
High resolution BB, CE-MRA, and 4D-flow intracranial scans were performed on 7 human subjects with known neurovascular disease, using a 3T scanner (MR750, GE Healthcare, WI, USA) with a 32-channel head coil (Nova Medical, MA, USA). 3D BB were collected utilizing a DANTE1 prepared spin echo sequence with 0.75x0.8x0.8mm3 resolution, while CE-MRA and 4D flow MRI were acquired with center out 3D radial sequences2-3 with 0.6mm isotropic spatial resolution. BB and CE-MRA images were first registered to the 4D-flow magnitude images using 3D rigid registration with a mutual information (MI) metric4 (ANTs5). BB, CE-MRA, and PC-MRA images of all subjects were scaled to have the same intensity scales by matching cumulative distribution functions (CDF) for each image type.
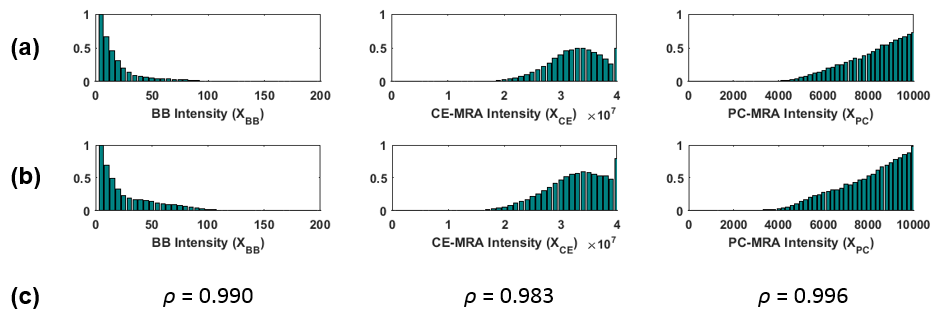
In one subject, likelihood statistics were compared between exhaustive manual segmentation and semi-automatic sampling of vessels based on CE-MRA and PC-MRA images. Manual segmentation was accomplished with custom multi-contrast segmentation tool developed in MATLAB (Mathworks, Natick, MA, USA). For the semi-automatic sampling, vessels were sampled based on histogram thresholding. PC-MRA images were used to yield CE-MRA likelihoods, CE-MRA images to yield PC-MRA likelihoods, and CE-MRA and PC-MRA to yield BB likelihoods. This assumes the artifacts in the images to be independent from one another.
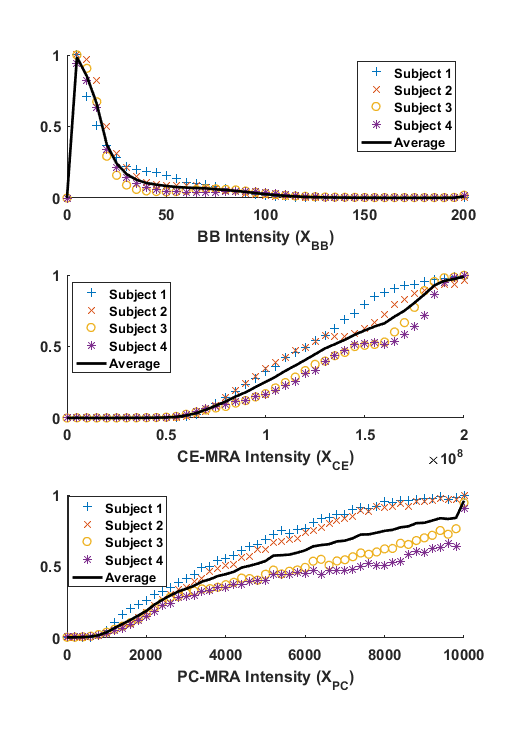
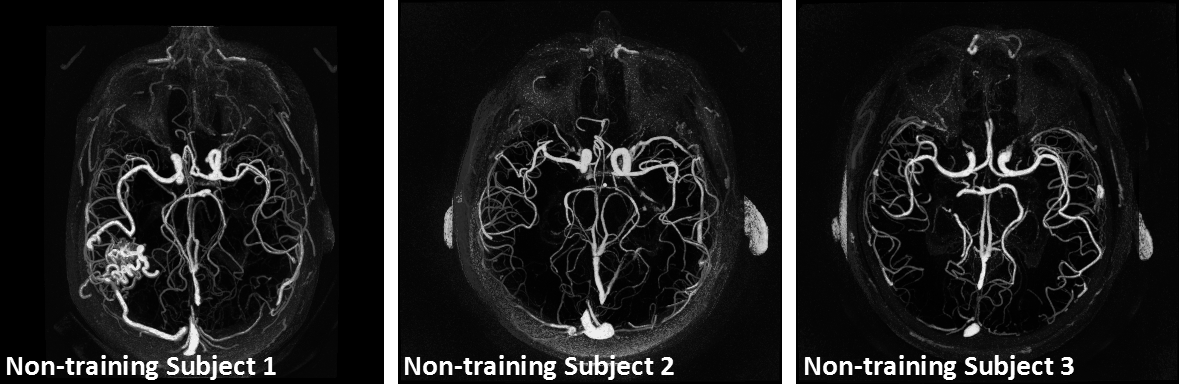
Likelihood statistics were then obtained and averaged from 4 subjects comprising the training set using automatically sampled vessels. Composite angiograms were obtained for the training-group subjects by computing vessel probabilities as well as the remaining 3 non-training datasets. Images were interrogated for image artifacts and qualitatively assessed for overall image quality.
Results
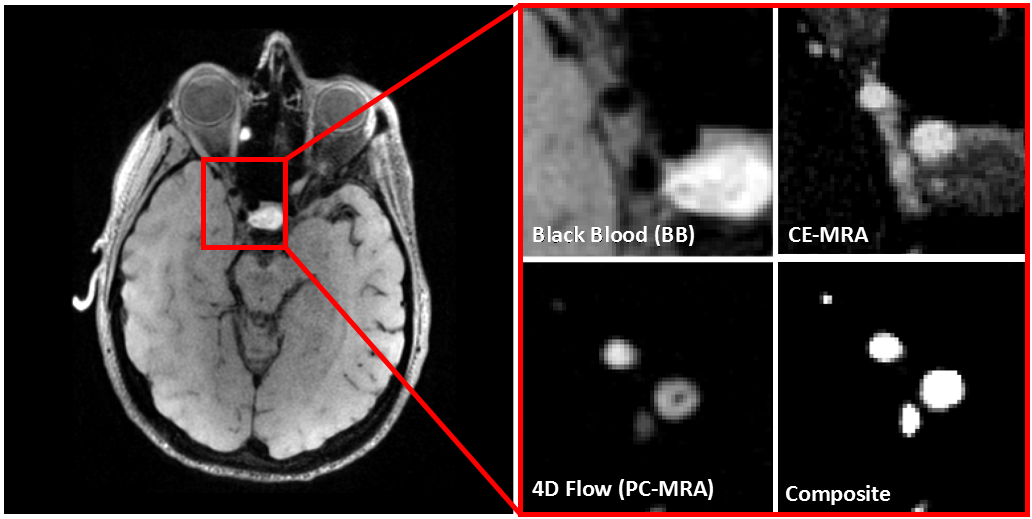
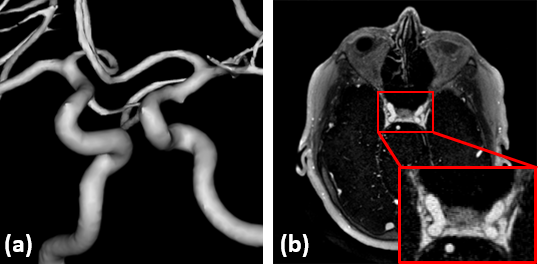
Likelihood statistics computed from the manually segmented vessels (Fig.1a) show increasing vessel likelihoods at low BB intensity, high CE-MRA intensity, and high PC-MRA intensity, as expected. Likelihood statistics obtained from automatically sampled vessels (Fig.1b) were nearly identical with the manually segmented case, suggesting their equivalence. Vessel likelihoods show similar values and patterns for all subjects in the training group (Fig 2), justifying the use of CDF matching to scale intensity among different cases and the use of their averages for subsequent vessel segmentations. Examples of angiograms in the internal carotid artery, where CE-MRA is challenging due to uptake in the cavernous sinuses, are shown in Fig. 3 for one subject in the training-group. Composite angiograms correctly depict just the artery excluding the venous pool, in contrast to CE-MRA, BB, and PC angiograms suffering from artefacts caused by background enhancement, air cavities, and flow artifact respectively. Images across subjects in the non-training data (Fig 4) demonstrate general applicability of the method, resulting in high-contrast MRA images.Discussion and Conclusion
The composite angiogram reflects vessel likelihoods from all available MR images, fully extracting the complimentary information with reduced sensitivities from technique-specific artifacts. The equivalence of statistics obtained from manual segmentation and automatic sampling indicates the required statistics can be automatically computed from large cohorts. Established likelihood statistics can be continuously applied on new subjects, as demonstrated by successful segmentation in non-training subjects using training-group statistics (Fig.4). This proposed angiographic paradigm may prove useful in applications that require reliable segmentation of vessels, such as quantification of wall sheer stress from 4D-flow MRI data.Acknowledgements
No acknowledgement found.References
1. Xie Y, Yang Q, Xie G, Pang J, Fan Z, Li D. Magn Reson Med. 2016;75(6):2286-2294.
2. Johnson KM, Lum DP, Turski PA, Block WF, Mistretta CA, Wieben O. Improved 3D phase contrast MRI with off-resonance corrected dual echo VIPR. Magn Reson Med. 2008;60(6):1329-1336.
3. Johnson KM, Fain SB, Schiebler ML, Nagle S. Optimized 3D Ultrashort Echo Time Pulmonary MRI. Magn Reson Med. 2013;70(5):1241–1250.
4. Kim D, Hoffman C, Wieben O, Johnson KM. Flow and structure with simultaneous visualization of registered 4D flow and black blood MRI. ISMRM 24th Annual Meeting & Exhibition 2006; 2701.
5. Avants BB, Tustison NJ, Song G, Cook PA, Klein A, Gee JC. A reproducible evaluation of ANTs similarity metric performance in brain image registration. Neuroimage. 2011;54(3)2033-2044
Figures