3269
Computational modeling of arterial wall strain in a rabbit model of atherosclerosis using an elastin-specific MR contrast agent1Imaging Sciences & Biomedical Engineering, King's College London, London, United Kingdom
Synopsis
Vulnerable plaque rupture is a major cause of common clinical events such as heart attacks and strokes. Plaques form in the arterial wall due to atherosclerosis, however not all plaques that do develop are at risk from rupture. Risk stratification is a major clinical need. This study combines elastin-specific MR contrast agent and CINE MR data from a rabbit model of atherosclerosis with finite element modeling. This combination allows the biomechanics of the arterial wall to be compared with morphological and biological indicators. Wall strains were shown to vary depending on the wall thickness and elastin content.
INTRODUCTION
Atherosclerosis is a major cause of morbidity and mortality worldwide. Clinical events, such as heart attacks are typically caused by rupture of a “high-risk/unstable or vulnerable” plaque. Identification of these plaques remains an unmet clinical need. Thus development of new methods for identifying vulnerable plaque is urgently needed in order to improve diagnosis and risk stratification. Vessel wall remodeling and the deposition of de-novo synthesized elastin has been linked to vulnerable plaque1. Increase in vessel wall elastin affects the mechanical properties of the wall and may be crucial for the mechanical stability. Here we developed a non-invasive approach to determine arterial wall strain, and its potential role in plaque rupture, in a rabbit model of atherosclerosis by combining biomechanical modeling and molecular imaging using an elastin-specific MR contrast agent. In the long-term this combined imaging and modeling approach could aid the detection of detect high-risk lesions in patients prior to clinical complications.METHODS
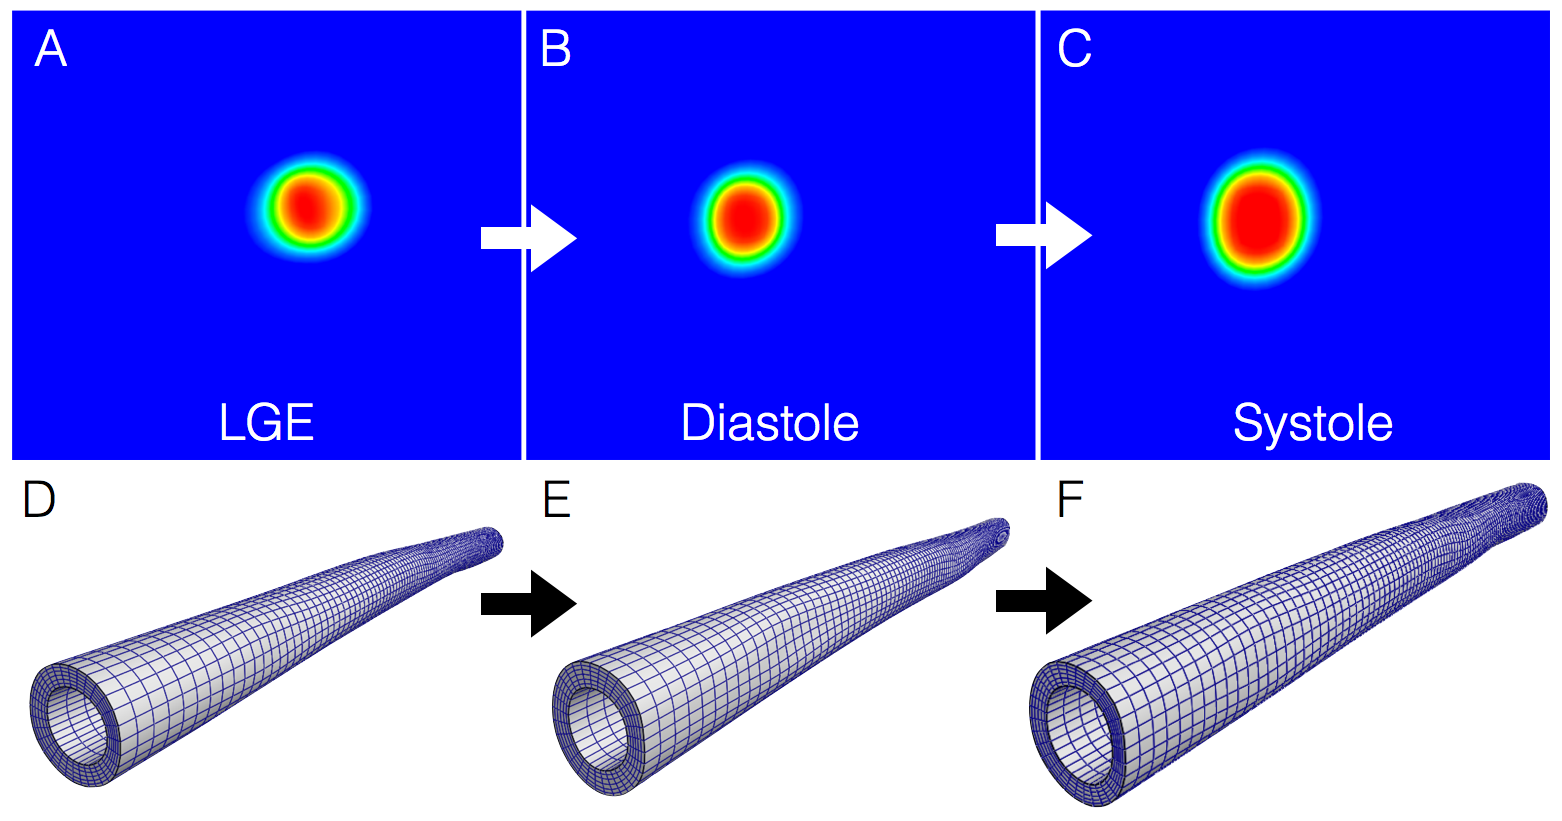
An existing MR dataset of 14 New Zealand White rabbits with atherosclerosis induced by high cholesterol diet was utilized. Animals were imaged with a 3T MR scanner in supine position. Late gadolinium enhancement (LGE) inversion-recovery images were obtained 2 hours after administration of 0.2 mmol/kg of an elastin-specific contrast agent, ESMA. Plaque disruption was triggered with Russell’s viper venom and histamine. A sub-group of six abdominal aortic walls (one control and five diseased animals - cases 1-5) were segmented from ESMA data (0.23 × 0.23-mm resolution; 4-mm-thick slices; 25 slices; range: renal arteries to aortic bifurcation). CINE MR data of the aorta (EGC triggered SSFP images; TR/TE=7.8/3.9ms, FA =60°, resolution=0.5x0.5mm, slice thickness=5mm, slices=11, phases=18) from the same animals were used to determine the luminal shape at peak- systole and end-diastole. From these data, arterial wall strain was determined using hyperelastic warping in the finite element software, FEBio2. Hyperelastic warping is a registration approach that utilizes image intensity differences between diastolic and systolic CINE images, and applies this as a force to deform a finite element discretization of the segmented aortic wall geometry (LGE images), thus allowing biomechanical data to be ascertained (e.g. strain/stress). Figure 1 shows the basics of the methodology. Strain distributions in the simulated aortas were compared with wall thickness and local elastin content - identified from the contrast-to-noise ratio (CNR) of the ESMA data.RESULTS & DISCUSSION
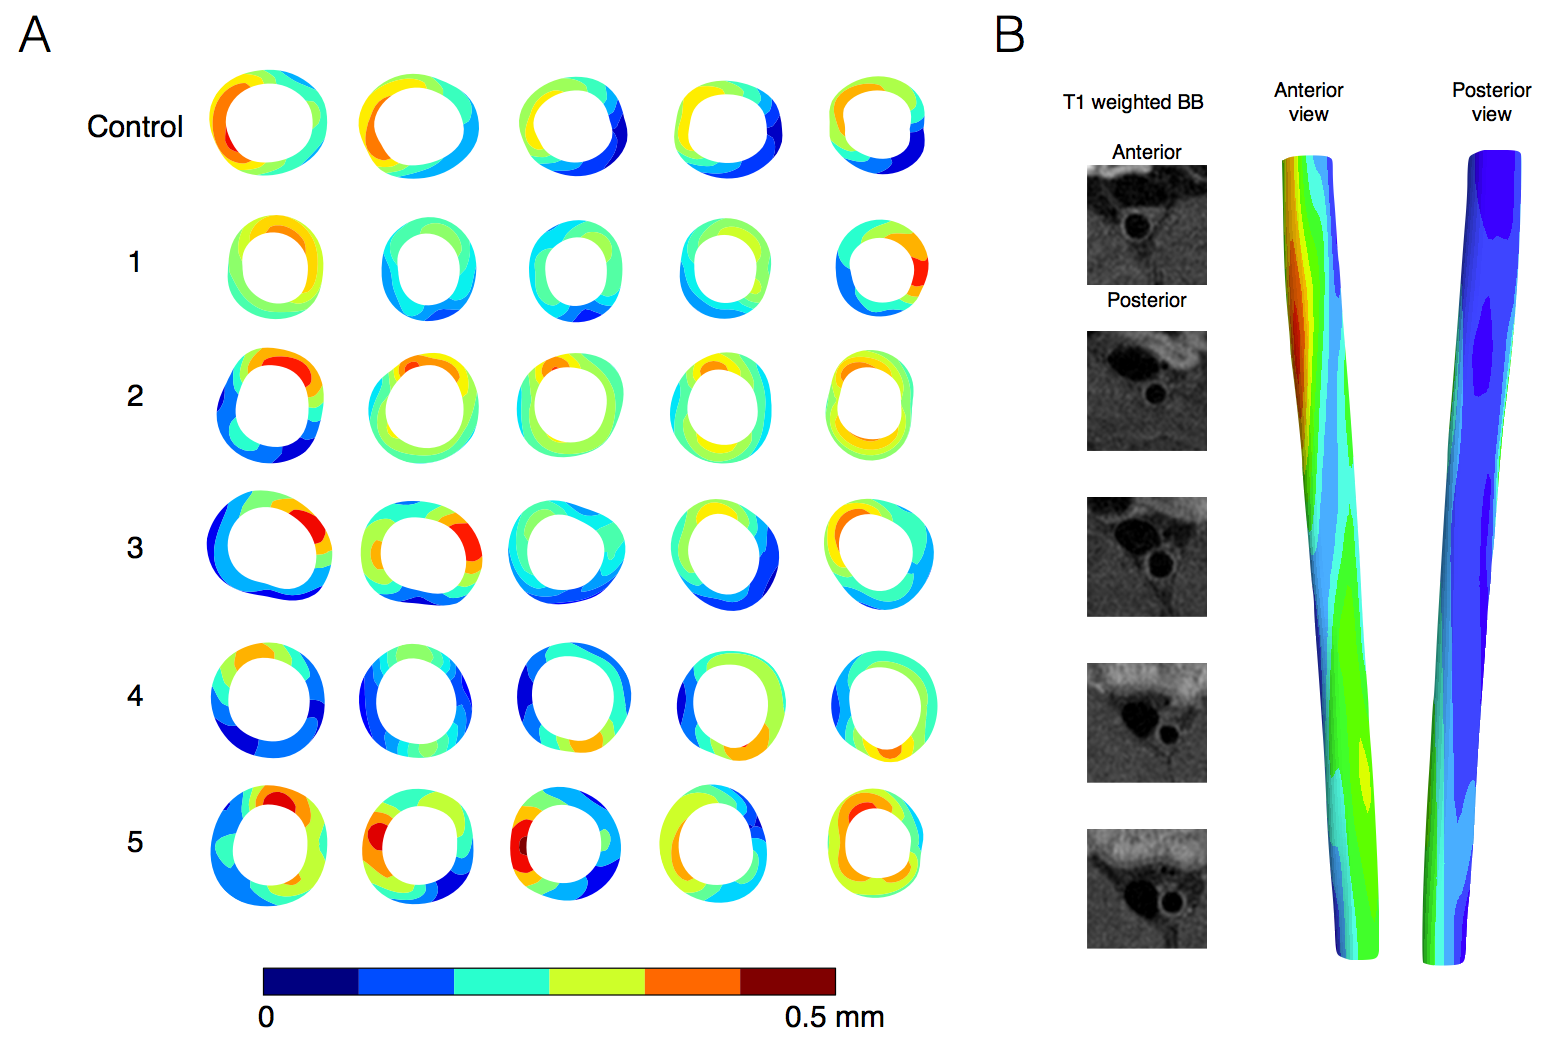
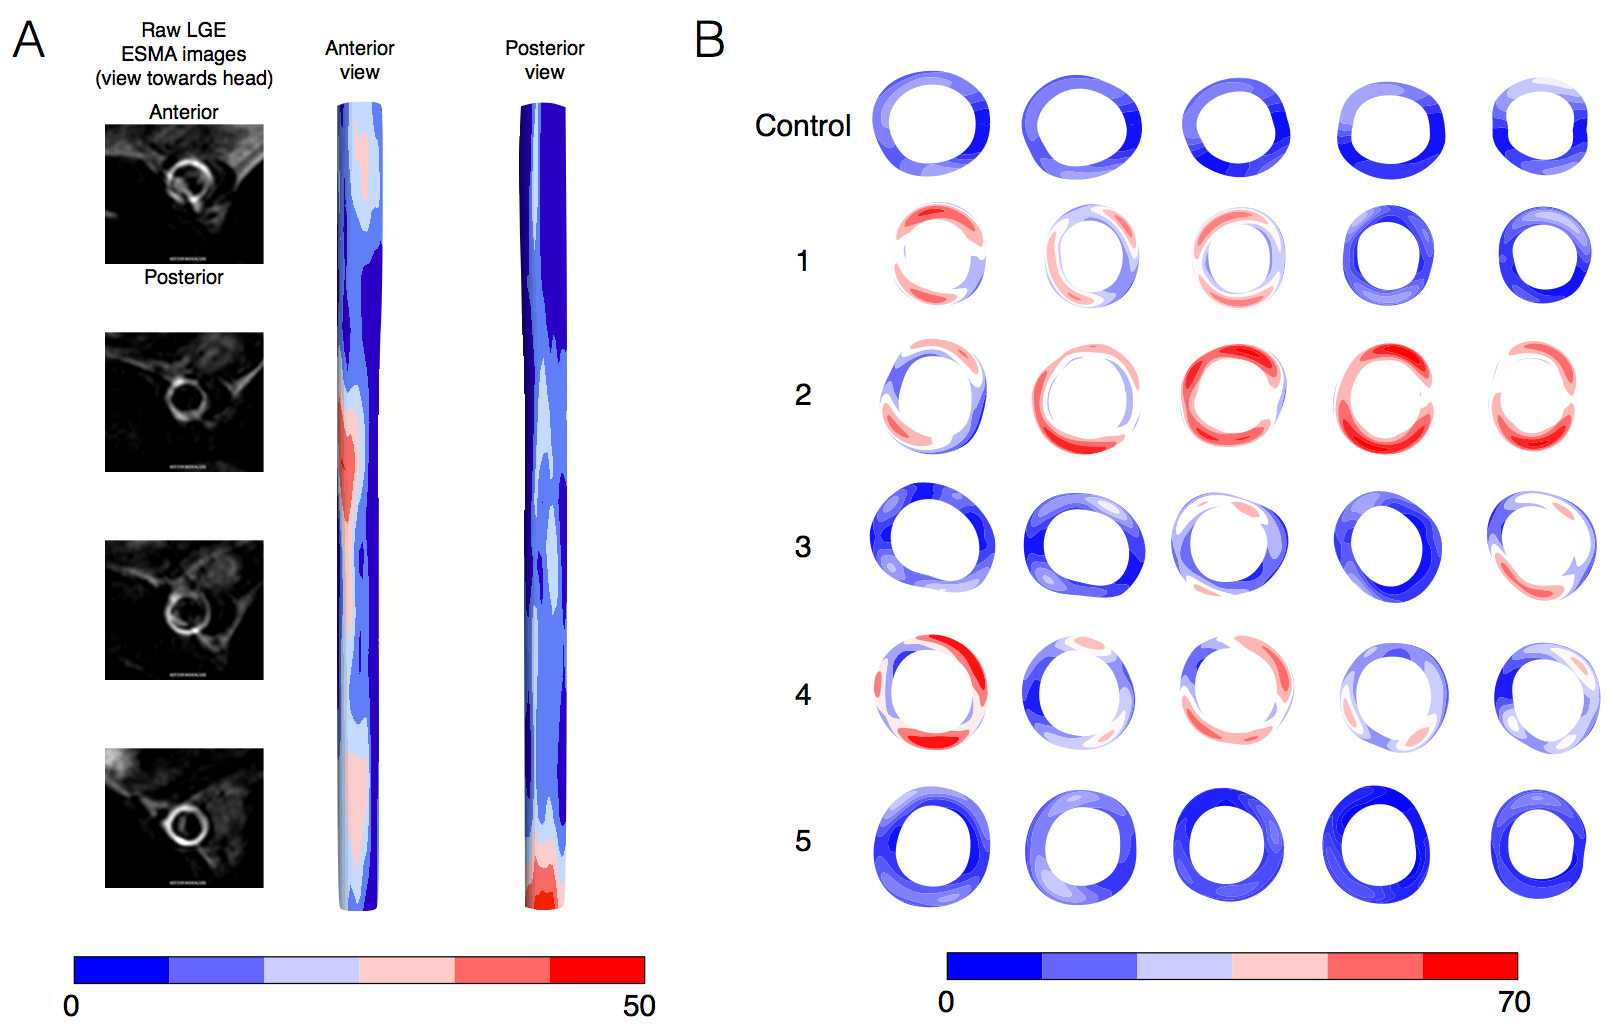
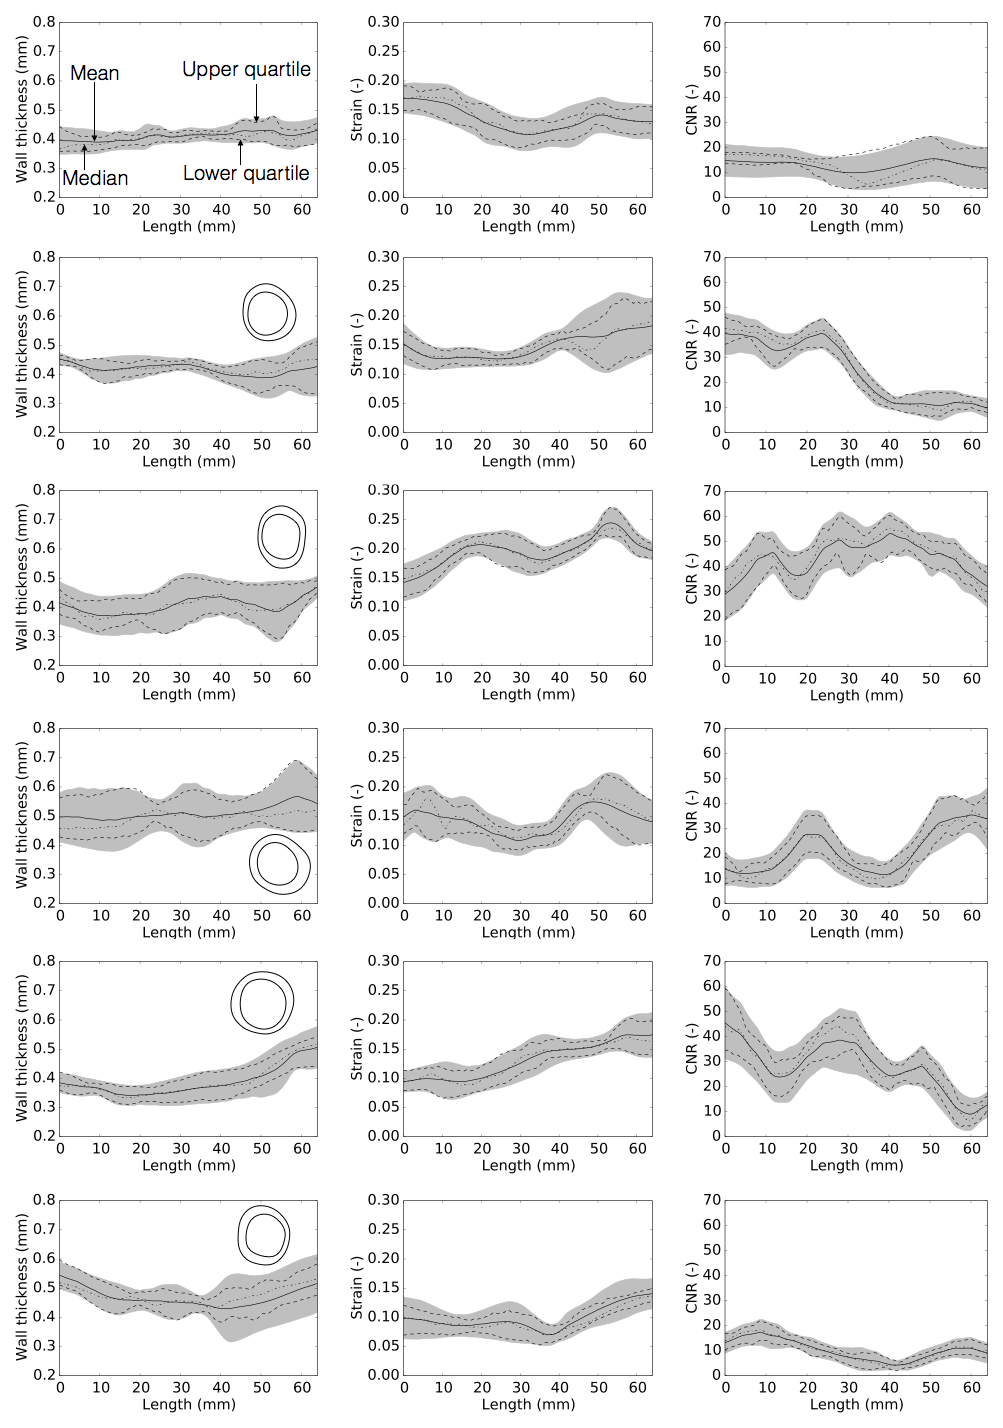
Figure 2 shows the deformation in the arterial wall derived from the CINE-MR and the ESMA data. The deformation of vessel wall tissue was highly dependent on the surrounding tissue and the proximity of the vena cava or support by the perivascular muscle. Wall thickness in the six animals was variable, which also depended on tissue support. Figure 3 shows the wall strain due to the deformation calculated using hyperelastic warping. The strain showed local elevations at sites of high curvature and was aligned predominantly in the circumferential vessel direction. Mean strains for control and diseased animals 1-5 were E=0.14, 0.15, 0.20, 0.14, 0.13, 0.10, respectively. Figure 4 shows the CNR information for the six animals. Red color-coding highlights regions of elevated compared to baseline elastin values measured in the control animal. Comparing figures 3 & 4, the control animal showed good agreement between regions of elevated strain and CNR. As diseased developed (animals 1,2,3 & 4), local elastin content increased and this relationship diminished. For these animals, high strain tended to occur at the peripheral parts of these elevated elastin regions where positive remodeling has occurred. This localization was more consistent for animal 2, which was the only animal where thrombus occurred. Figure 5 shows wall thickness, mean radial strain and CNR along each of the aortas. Wall thickness increased for all diseased animals. Wall remodeling varied between more symmetric (case 1 – closer to the renal branch) and asymmetric thickening (animals 2-5). The latter elevates strain more. It is hypothesized that animals 2-4 exhibit a different disease progression compared to animals 1 and 5. This was hypothesized from the low CNR for animals 5 and 1 (>40mm), even though wall thickening had occurred.CONCLUSION
Our computational modeling based assessment of arterial wall strain based on MR imaging with an elastin specific contrast agent shows much promise. Currently a clear relationship is difficult to ascertain due to the differences in wall thickness and elastin content between the cases suggesting the problem is a complex relationship between strain, elastin and wall thickness. The dataset is continuously being expanded to build a more concrete picture. Additionally, new scans will also include a novel contrast agent that detects elastogenesis3.Acknowledgements
NIHR Cardiovascular Healthcare Technology Co-operative (HTC)References
1. Phinikaridou A, Andia ME, Indermuehle A, Onthank DC, Cesati RR, Smith A, Robinson SP, Saha P, Botnar RM. Vascular remodeling and plaque vulnerability in a rabbit model of atherosclerosis: Comparison of delayed-enhancement MR imaging with an elastin-specific contrast agent and unenhanced black-blood MR imaging. Radiology. 2014 Jan 10;271(2):390-9.
2. Maas SA, Ellis BJ, Ateshian GA, Weiss JA. FEBio: finite elements for biomechanics. Journal of biomechanical engineering. 2012 Jan 1;134(1):011005.
3. Phinikaridou A, Lacerda S, Andia ME, Botnar R. Development of a tropoelastin-binding MR contrast agent for in vivo imaging of impaired elastogenesis in atherosclerosis. Journal of Cardiovascular Magnetic Resonance. 2015 Feb 3;17(1):1.
Figures