3265
Free-breathing navigator 3D Cardiac Quantitative Susceptibility Mapping (QSM): initial experience at 1.5T and 3T.1Meinig School of Biomedical Engineering, Cornell University, New York, NY, United States, 2Radiology, Weill Cornell Medicine, New York, NY, United States, 3Medicine, Weill Cornell Medicine, New York, NY, United States
Synopsis
To improve signal-to-noise ratio (SNR) in cardiac QSM (cQSM), we introduce here 3D acquisition that is more SNR efficient than previous 2D acquisition. Respiratory motion artifacts during the long 3D acquisition are compensated using navigator gating. We also investigated potential SNR gain at 3T over previous 1.5T. Our initial results seem to suggest possible issues at 3T that prevent the realization of potential cQSM improvement at from 1.5T to 3T in terms of SNR and contrast.
INTRODUCTION
Cardiac quantitative Susceptibility Mapping (cQSM) promises to be useful for non-invasively quantify SvO2, that is widely used to manage critically ill patients. One challenge in cQSM is the lack of SNR, which can be improved by going from previous 2D acquisition to 3D acquisition, and further SNR improvement can be achieved by increasing field strength from 1.5T to 3T. 3D acquisition is too long for a breath hold. So, we introduce here a navigator gated 3D cQSM sequence, and we evaluate its performance at 1.5T and 3T.METHODS
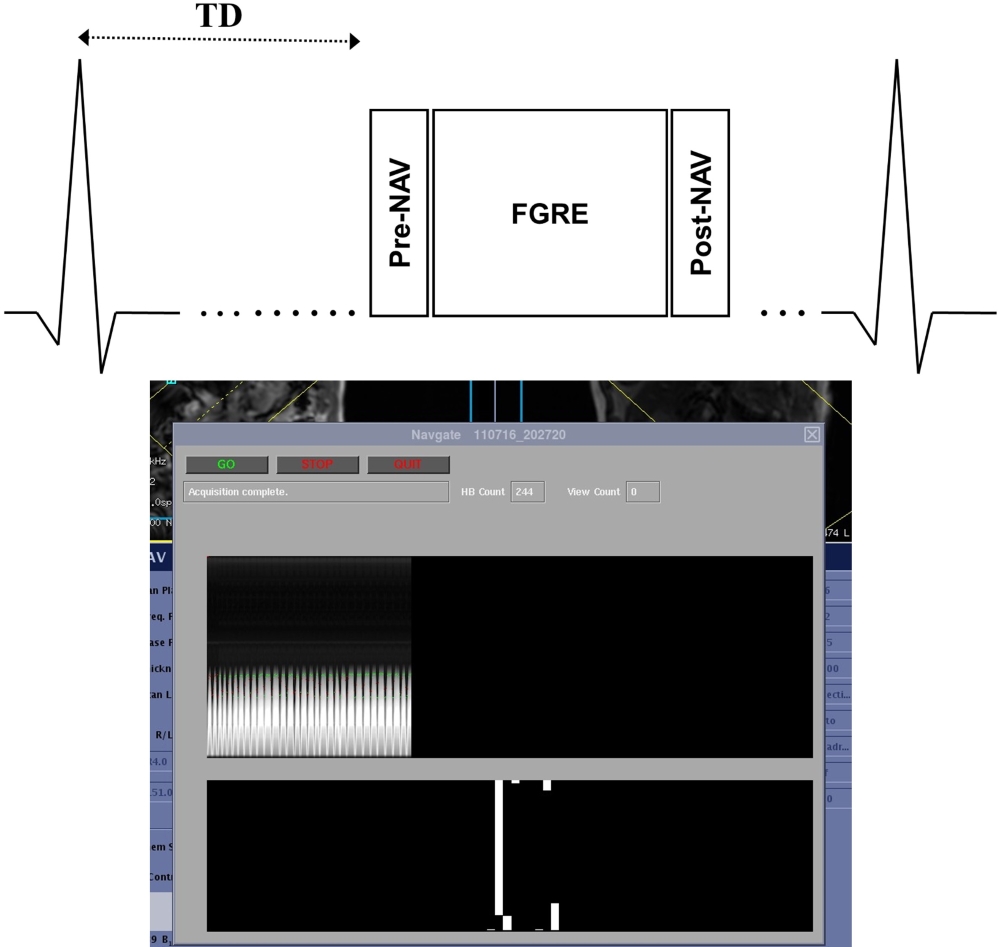
We developed an ECG-triggered navigator gated multi-echo 3D FGRE sequence for cardiac QSM on both 1.5T and 3T scanner (GE Healthcare), along with a graphical user display for displaying acquisition information in real time, as shown in figure 1. A pencil beam navigator echo was used to detect the diaphragm position, and an efficient 2-bin phase-ordered automatic window selection (PAWS) gating algorithm1 was used to control the data acquisition based on the diaphragm position in real time.
QSM sequences generally require long TR, resulting in long acquisition window, which makes the sequence more susceptible to motion artifacts. To address for large motion during acquisition in each heartbeat, a navigator echo was played out both before and after each acquisition within a given heartbeat. If the displacement between the two detected diaphragm positions within a single heartbeat was greater than 2mm, then the data from this heartbeat are rejected.
Scan parameters on 1.5T were: 5 echoes, first TE≈1.7ms, DTE≈2.3ms, TR≈15ms, bandwidth is ±62.5kHz, acquisition resolution = 192x192, 24 slices, 5mm slice thickness, 10 views per heartbeat,75% phase FOV, 75% partial readout, and 80% partial slice encoding. The scan parameter on 3T is the same as 1.5T except that the readout resolution was 256, the bandwidth was ±50kHz, and DTE≈3.5ms. We chose 3.5ms DTE such that water and fat signals can be differential for accurate water-fat separation.
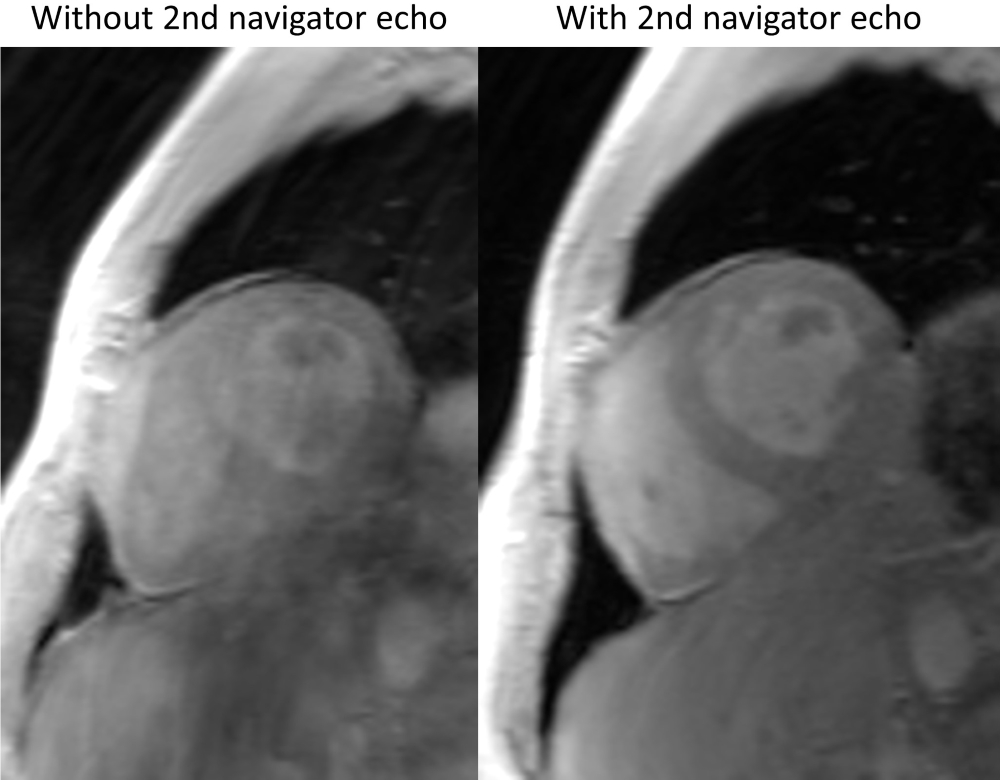
A graph cut based phase unwrapping and fat-water separation method2 combined with a chemical shift update method3 was used to compute the total field from the complex data. A Total Field Inversion method4 was used to obtain the final susceptibility map from the total field. Four healthy volunteers, each consented with IRB approved protocol, were scanned with the proposed free-breath cardiac QSM sequence on both 1.5T and 3T GE scanner. To demonstrate the benefit of playing a second navigator echo after acquisition in each heartbeat to avoid large motion, a third scan was done on one volunteer on 3T without the second navigator echo.
RESULTS
As shown in figure 2, when all data are accepted regardless of motion during each acquisition, the resulting image quality was degraded by ghosting artifacts, with score of 3.5 (0=very minimal ghosting, 1=minimal ghosting, 2=moderate ghosting, 3=severe ghosting, 4=excess ghosting). Using the dual navigator protocol, the resulting image quality was significantly improved, with a score of 2.6 on 1.5T and 2.5 on 3T.
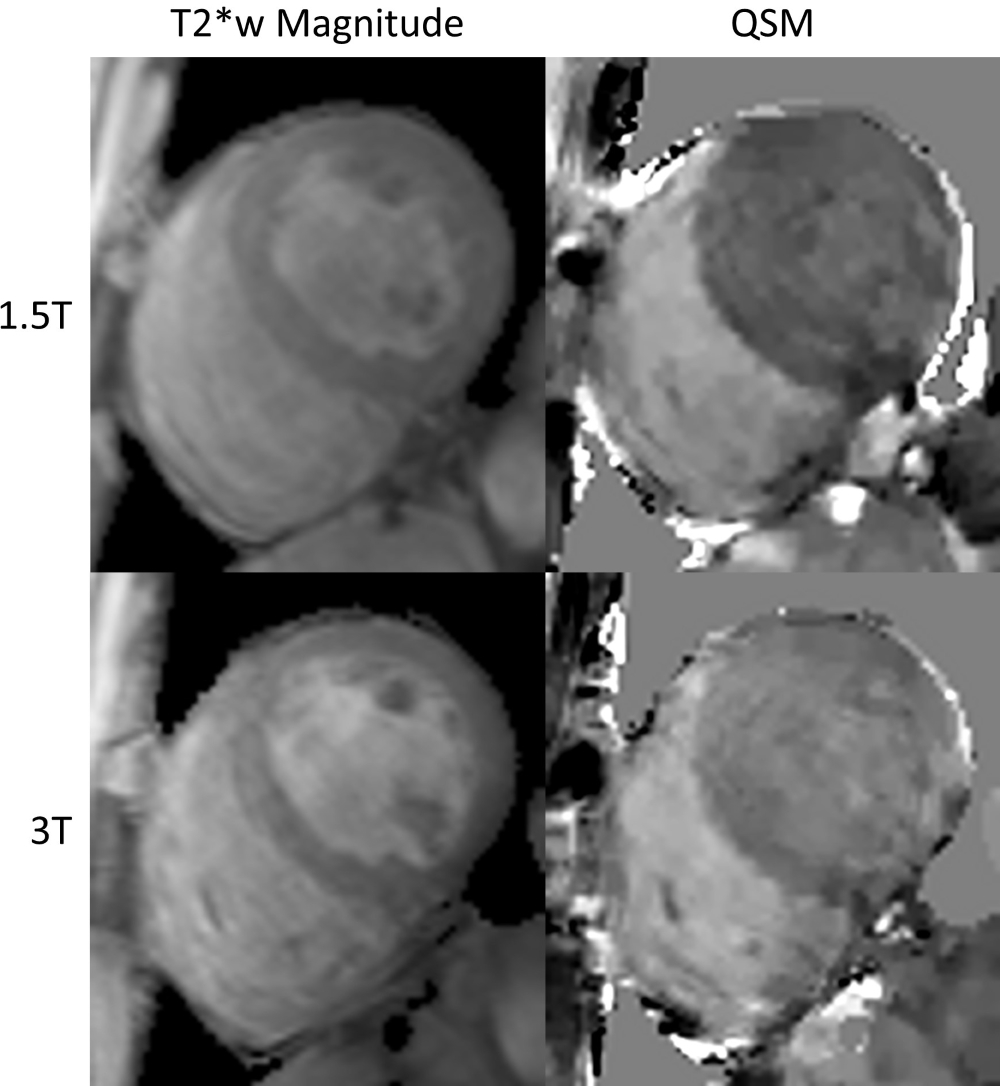
As shown in figure 3, the image qualities of the magnitude images are similar on both 1.5T and 3T. However, the QSM from 1.5T has better contrast between LV and RV than the QSM from 3T does. The average susceptibility difference between right ventricular and left ventricular blood pool on the four volunteers was 255±3ppb on 1.5T and 230±4ppb on 3T, which translate to an 80.6±.2% SvO2 on 1.5T and 82.2±.3% SvO2 on 3T.
DISCUSSION
The proposed free-breathing navigator QSM sequence has increased robustness to motion by playing a second navigator echo right after each heartbeat’s acquisition to detect and reject data acquired during large motion. Our preliminary data showed that the QSM from 1.5T has better contrast than the QSM from 3T, this can cause by higher field inhomogeneity on 3T, which may lead to increased field estimation error due to flow dephasing5. 1.5T also has the advantage of having a shorter TR (15ms) as oppose to 3T (20ms) for the same number of readout echoes. This is because the echo spacing for 3T was increase from 2.3ms to 3.5ms so that water and fat and be separated in post-processing. The average SvO2 measured on both 1.5T and 3T in the four volunteers are higher than expected (70%). The corresponding underestimation in QSM can be attributed to flow artifacts and residual motion.CONCLUSION
This work demonstrated the feasibility of the free-breathing navigator sequence for cardiac QSM. Future research will focus on understanding and correcting for the issues that prevent the expected improvements in QSM when going from 1.5T to 3T.Acknowledgements
We acknowledge support from NIH grants R01NS072370, R01NS090464, and R01NS095562.References
1. Jhooti P, Gatehouse P, Keegan J, Bunce N, Taylor A, Firmin D. Phase ordering with automatic window selection (PAWS): A novel motion-resistant technique for 3D coronary imaging. MRM. 2000;43:470-480.
2. Dong J, Liu T, Chen F, Zhou D, Dimov A, Raj A, Cheng Q, Spincemaille P, Wang Y., "Simultaneous Phase Unwrapping and Removal of Chemical Shift (SPURS) Using Graph Cuts: Application in Quantitative Susceptibility Mapping," in Medical Imaging, IEEE Transactions on , 2015. 34(2), 531-540.
3. Dimov A. V., Liu T., Spincemaille P., Ecanow J. S., Tan H., Edelman R. R. and Wang Y., Joint estimation of chemical shift and quantitative susceptibility mapping (chemical QSM). Magn Reson Med, 2015, 73: 2100–2110.
4. Liu Z, Kee Y, Zhou D, Spincemaille P, Wang Y. Preconditioned total field inversion (TFI) method for quantitative susceptibility mapping. MRM. doi:10.1002/mrm.26331
5. Xu B, Liu T, Spincemaille P, Prince M, Wang Y. Flow Compensated Quantitative Susceptibility Mapping for Venous Oxygenation Imaging. MRM. 72: 438-445
Figures