3258
Effects of a Gadolinium Based Contrast Agent on the Myocardial R2* Relaxation Rate in Patients with Chronic Myocardial Infarction1St Francis Hospital, Roslyn, NY, United States, 2Yale University, New Haven, CT, United States
Synopsis
In this proof-of-concept study, we studied the effects of a contrast agent on R2*/T2* relaxation in dense myocardial fibrosis. A significant change in myocardial R2* was found after contrast and an R2* difference existed after contrast agent administration between fibrosis and remote myocardium. On average, viable myocardial R2* increased by 4.5 Hz while infarcted increased by 9.3 Hz at 1.5T with a clinical contrast agent.
Purpose:
The effect of gadolinium based contrast agents (GBCA) on the T1 relaxation time in fibrosis has been well studied with inversion recovery and T1 mapping techniques. The purpose of this study was to assess the effects of GBCAs on viable and infarcted myocardial R2* relaxation rates.Methods
Twenty-nine subjects with known chronic myocardial infarction (26 men; age, 62.8±10.0 years) were studied at 1.5T with R2* mapping as well as conventional CINE and late gadolinium-enhancement (LGE) imaging. Myocardial infarct age was 12.1±8.6 years. Additionally, seventeen healthy subjects (10 men; age, 60.8±9.0 years) were imaged with pre-contrast R2* mapping. R2* mapping was performed using a dark blood double inversion recovery multiple spoiled gradient-echo sequence (TR = 20 ms; 12 echo times: 2.4 - 15.5 ms, flip angle = 20 degrees, 2.3 x 1.7 x 8 mm3) [1]. A joint water-fat separation reconstruction [2] was performed yielding water, fat, B0 and R2* images. The technique provides high resolution pixel R2* maps corrected for the effects of macroscopic magnetic field variations. Both pre- and post-contrast R2* mapping were performed in long and short-axis views. Post-contrast R2* mapping was performed 5-10 minutes after bolus contrast agent administration (0.15 mmol/kg gadopentetate dimeglumine) and LGE at 15 minutes after injection. Region-of-interests (ROIs) were drawn in hyper-enhanced (infarcted) and remote (viable) myocardium based on LGE imaging. Mean R2* as well as ROI anatomical locations were recorded to study location bias. In normal control subjects, ROIs were drawn in four segments of a mid-short-axis image to determine normal values and further evaluate possible anatomical location bias. ANOVA and paired statistical tests were used to determine the effect of the contrast agent and fibrosis on the measured R2* relaxation rate. ANOVA was used to determine if there was a bias due to anatomical location.Results:
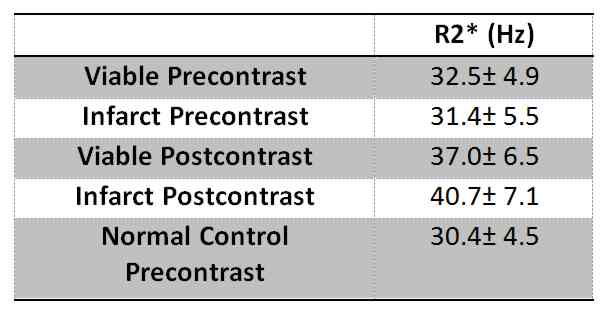
There were 14 inferior, 5 lateral, 6 anterior and 4 septal myocardial infarctions. There was no significant association of pre-contrast R2* with anatomical location in normal or chronic MI patients (p=0.148). Ejection fraction was lower in the MI subjects when compared to the normal controls: 42.0 %±9.1 vs 56.9 %±5.5 (p<0.001) and LV mass was larger: 71.1 (g/m2) ±10.9 vs 56.5 ±12.7 (p<0.001). Before contrast agent administration, the R2*’s of infarcted and remote viable myocardium were not statistically different from each other or the normal controls (Figure 2, Table 1). After contrast agent injection, there was a significant increase of both infarcted and remote myocardial R2* relaxation rates (p<0.001). Additionally, the relaxation rate of infarcted myocardium showed a greater increase compared to viable myocardium in the same subject. An example is shown in Figure 1. On average after contrast agent administration, viable myocardial R2* increased by 4.5 Hz and infarcted myocardial R2* by 9.3 Hz (Figure 2 and Table 1).
Discussion:
Detection of myocardial fibrosis using the LGE technique is visualized based on a relative T1 relaxation difference between fibrotic and normal myocardium resulting from an extracellular volume expansion and an increased concentration of GBCA. We hypothesized that this contrast agent difference between viable and infarcted myocardium would also create a measurable R2*/T2* relaxation difference, for the same reasons. R2* mapping has matured through research on iron overload and fat/water separation [2] into a practical method, with many reports of R2* measurement without contrast agents. Although normal values of R2*/T2* vary [3], our pre-contrast values of about 30ms for T2* of normal, remote and infarcted myocardium agree with these prior reports. However, we are unaware of a report showing reference values for post-contrast R2* in normal and fibrotic tissue. This proof-of-concept study shows that not only R1, but R2* and presumably R2 have the potential to be used to obtain post-contrast image contrast differences in fibrotic myocardial disease. However, the T2* difference is small, i.e. 27ms for post-contrast infarcted regions, and 24 ms for post-contrast remote regions. This corresponds to a 1% signal difference for a TE=2ms, although the difference could be greater in an optimized protocol. The results of this study provide reference values to determine the implications of R2*/T2* changes for emerging MR relaxation parameter mapping, image synthesis and MR fingerprinting methods.Conclusion
Similar to T1 relaxation, R2* relaxation rates change significantly with conventional contrast agent doses. The relative greater GBCA concentration due to an increased extracellular volume in myocardial infarction yields a faster R2* relaxation rate in fibrosis relative to neighboring viable myocardium.Acknowledgements
No acknowledgement found.References
1. He T, Gatehouse PD, Kirk P, Tanner MA, Smith GC, Keegan J, Mohiaddin RH, Pennell DJ, Firmin DN. Black-blood T2* technique for myocardial iron measurement in thalassemia. J Magn Reson Imaging 2007;25(6):1205-1209.
2. Hernando D, Kellman P, Haldar JP, Liang ZP. Robust water/fat separation in the presence of large field inhomogeneities using a graph cut algorithm. Magn Reson Med 2010;63(1):79-90.
3. Kawel-Boehm N, Maceira A, Valsangiacomo-Buechel ER, Vogel-Claussen J, Turkbey EB, Williams R, Plein S, Tee M, Eng J, Bluemke DA. Normal values for cardiovascular magnetic resonance in adults and children. J Cardiovasc Magn Reson 2015;17:29.
Figures
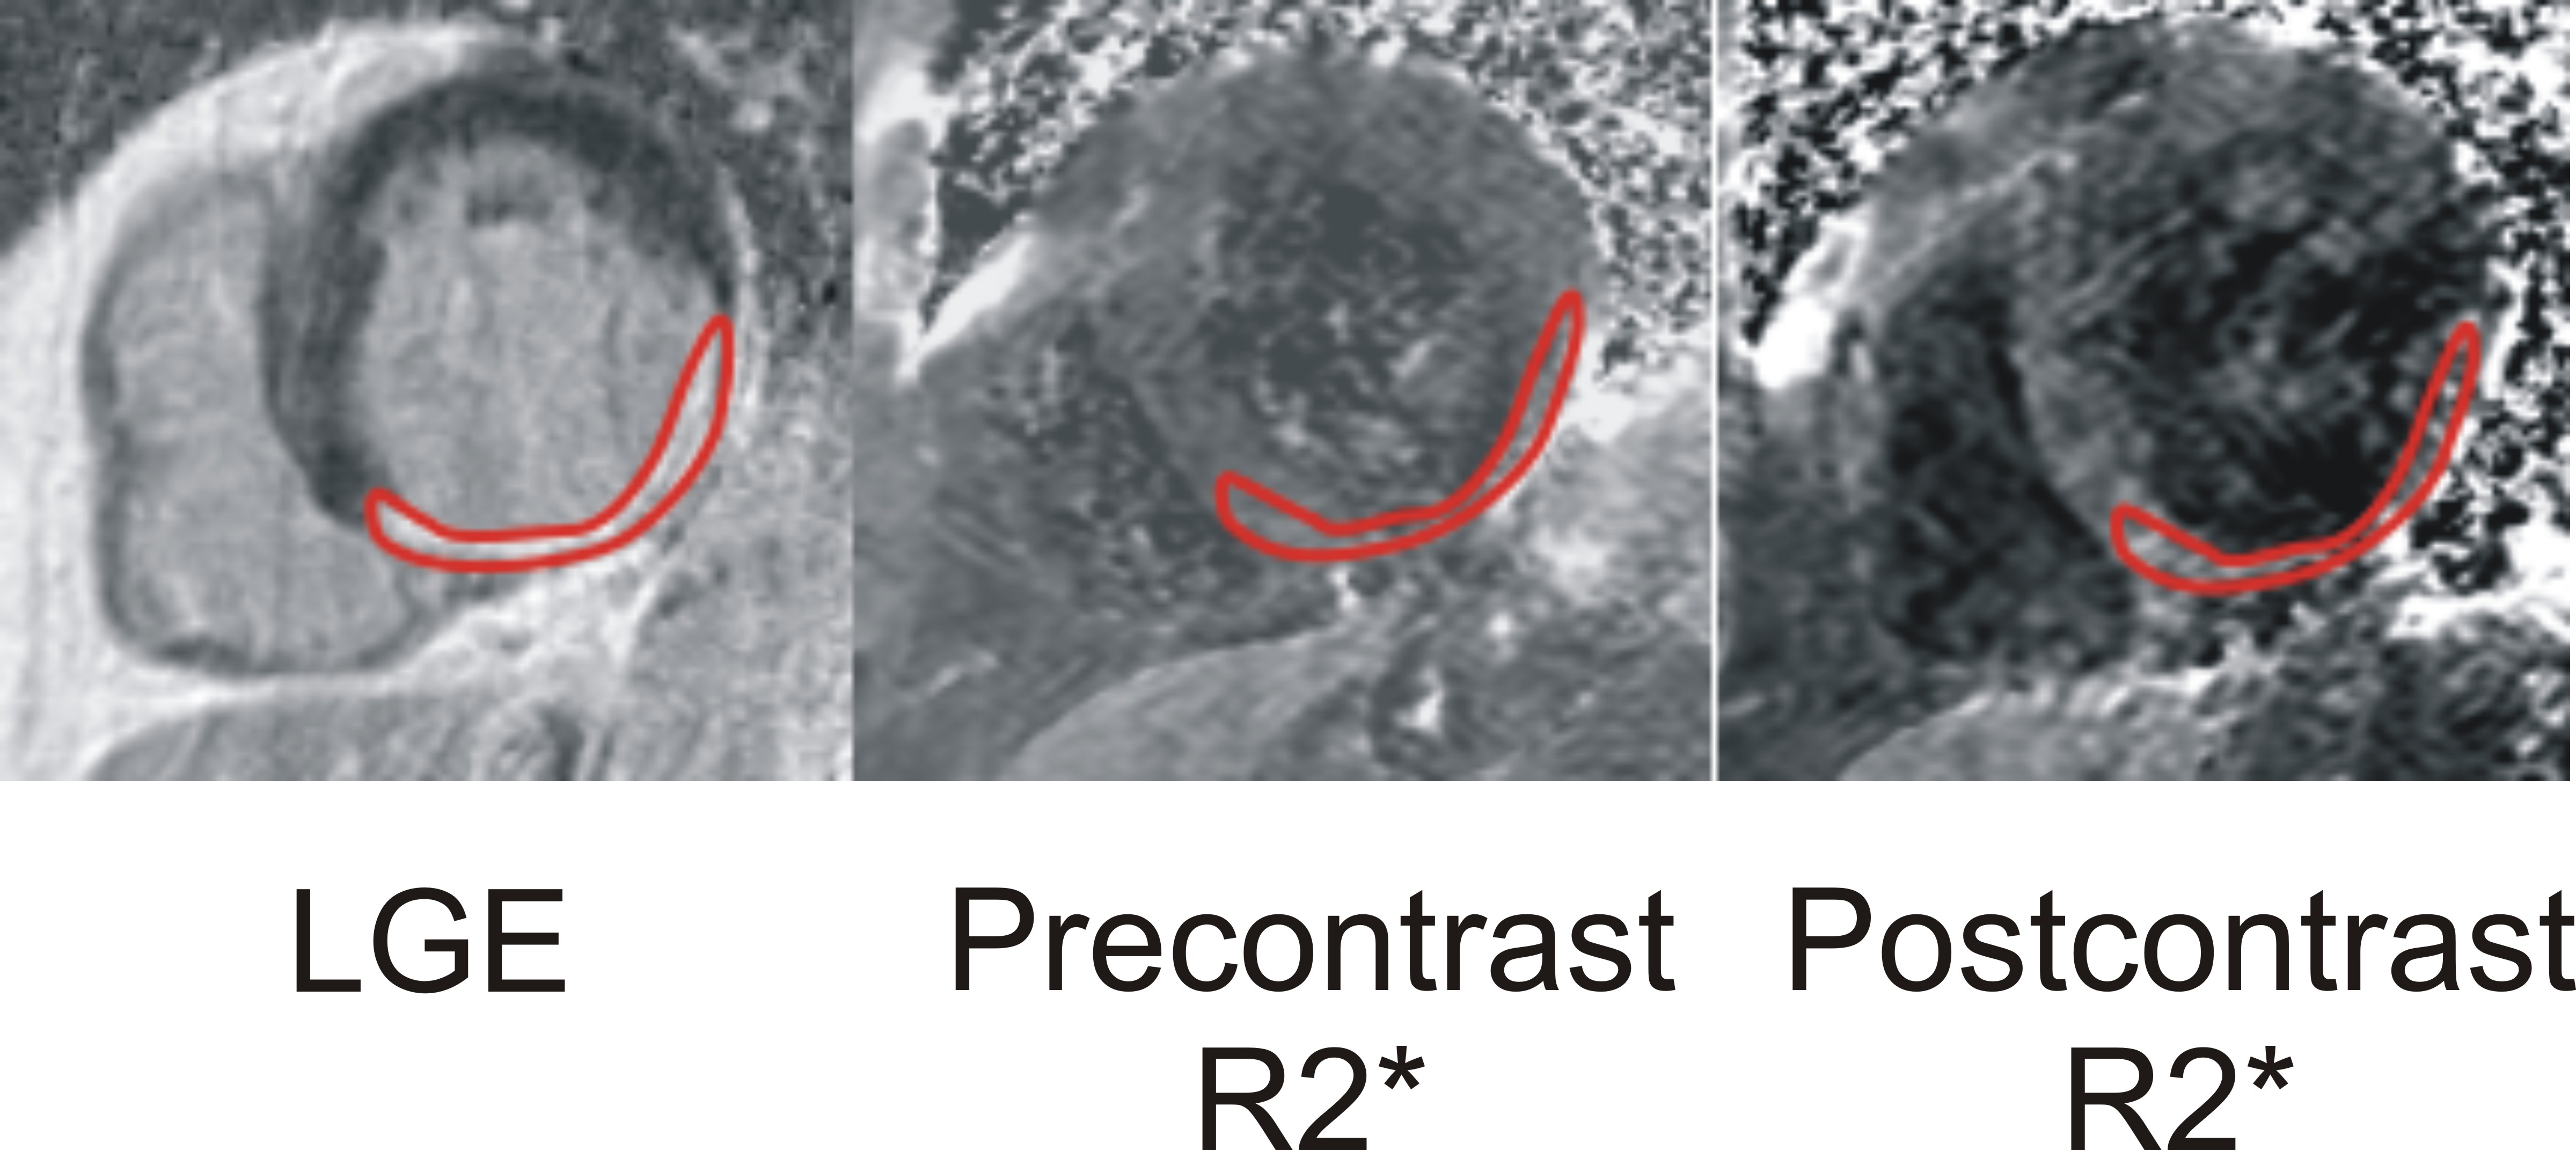
Figure 1. Example LGE and pre and postcontrast R2* maps in a subject with an inferior chronic myocardial infarction. Precontrast: R2*(infarct) =29.3 Hz, R2*(viable)=28.7 Hz; Postcontrast: R2*(infarct) =40.2 Hz, R2*(viable)=33.4 Hz