3251
BOLD Effect of Oxygen-Inhalation T2-star MRI Surrogates Systemic and Myocardial Oxygen Consumption in Heart Failure and Myocardial Infarction1Diagnostic Imaging & Nuclear Medicine, Tokyo Women's Medical University, Tokyo, Japan, 2Clinical Radiology, Kyushu University, 3Cardiovascular Medicine, Kyushu University, 4Philips Electronics Japan
Synopsis
Measurement of oxygen consumption (OC) has been less than satisfactory in patients with heart failure. This has necessitated the invasive techniques to measure the total oxygen demand with cardiopulmonary exercise (CPX). The present study proposes a novel method to quantify OC using BOLD effect of oxygen-inhalation T2* MRI. Difference between oxygen-T2* and room-air-T2* (ΔT2*) was identified as an estimate of OC. ΔT2* was significantly correlated with systematic and myocardial OC expressed as the results of CPX and myocardial fatty acid scintigraphy. Our method allows assessing non-invasively OC in vivo. ΔT2* could be used as an imaging biomarker for heart failure.
PURPOSE
Patients
with cardiomyopathy present with heterogeneous left ventricular (LV) damage,
and consequently they have LV dysfunction and a high-energy demand throughout
the dilated ventricle. Measurement of myocardial oxygen consumption has been
less than satisfactory in patients with dilatation and congestive heart failure
(HF) (1). This has necessitated the use of invasive techniques to measure
oxygen consumption directly or the determination of the total oxygen demand
with tests such as the cardiopulmonary exercise (CPX) (2).
T2*-weighted blood-oxygen-level-dependent (BOLD) MRI was
able to visualize the perivascular signal change due to the bulk susceptibility
effect related to the ratio of diamagnetic oxy-hemoglobin (Oxy-Hb) and
paramagnetic deoxy-hemoglobin (Deoxy-Hb) in small vessels, parallel to the
brain surface (3). Our aim was to use the BOLD effect in oxygen-enhanced T2*
cardiac MRI to evaluate the transitional myocardial response to inhalation of
supplemental oxygen, and to investigate its relationship with systematic and
myocardial oxygen consumption evaluated using the CPX in patients with
refractory HF and myocardial fatty acid scintigraphy in patients with acute
myocardial infarction (MI).
METHOD
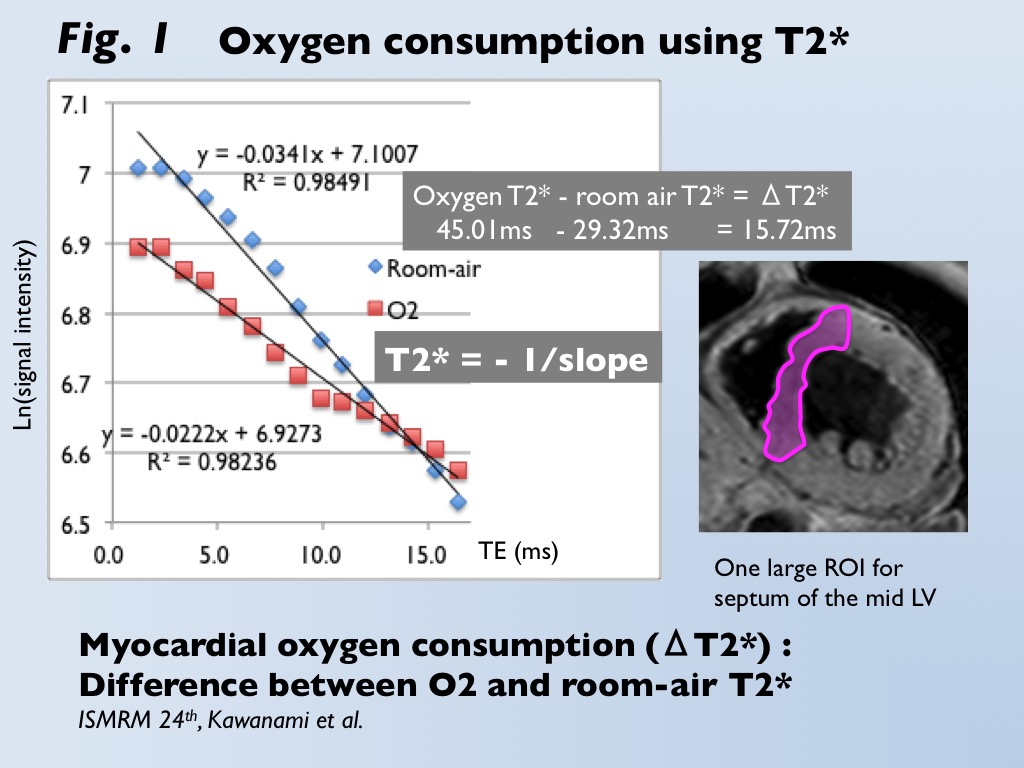
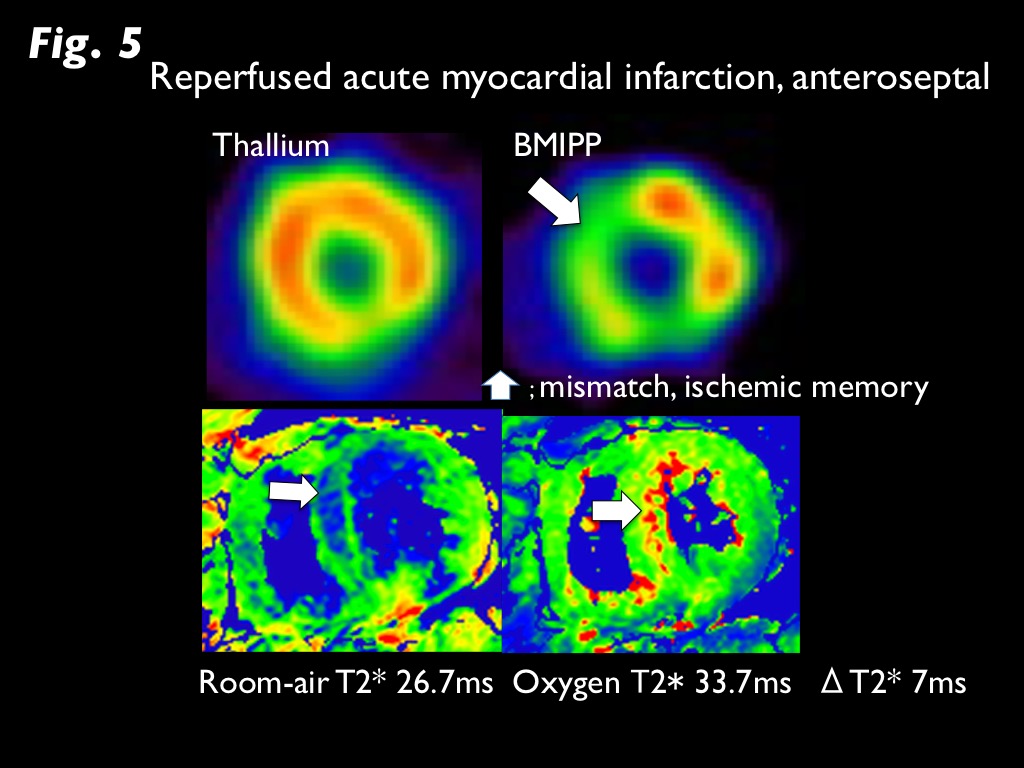
T2* CMR Oxygen Consumption: Myocardial T2* (M-T2*) imaging was accomplished using 3-Tesla scanner (Achieva 3T Quasar Dual; Philips Healthcare) equipped with dual-source parallel radiofrequency transmission, 32-element cardiac phased-array coils, and cardiac gating with a 4-lead vector electrocardiogram, the black blood, breath-hold, and multi-echo gradient-echo sequence (TE=2.3 to 16.4 ms). M-T2* was calculated by fitting the signal intensity data for the mid-left ventricular septum to a decay curve (Fig. 1) (4). During 10 minutes inhalation of oxygen at the flow rate of 10 l/min, M-T2* was measured under room-air and oxygen inhalation. Oxygen consumption (ΔT2*, ms) was defined as the difference between the two conditions. Systematic Oxygen Consumption: Thirty non-ischemic refractory HF patients who underwent CMR and cardiopulmonary exercise (CPX) test for heart transplant were enrolled (mean age, 46 year-old). Peak VO2 and O2 pulse from CPX test were used as estimates of systematic oxygen consumption. In addition, 24 patients with suspected cardiomyopathy who had normal left ventricular function (LVEF >50%) on CMR were enrolled as control (mean age, 54 year-old). Myocardial Oxygen Consumption: Fifteen patients with reperfused acute MI who underwent dual SPECT of 201-Thallium (TL) and 123-I-Beta-methy-p-iodophenyl pentadecanoic acid (BMIPP) were enrolled (mean age, 61 year-old). BMIPP was used for the assessment of myocardial fatty acid metabolism, which directly links to oxidative metabolism. The mismatch of BMIPP and TL represents the ischemic memory in the salvage area after reperfusion therapy. The summed mismatch score of TL and BMIPP accumulations on the AHA 17-segment model was identified as an estimate of myocardial oxygen consumption (5). Statistical Analysis: Changes in T2* between room-air and O2 inhalation was analyzed by paired t-test. Comparison of ΔT2* between HF and controls was analyzed by Mann-Whitney u-test. Correlations between ΔT2* and CPX (peak VO2, O2 pulse) and between ΔT2* and BMIPP/TL mismatch score was analyzed by Pearson coefficient.RESULTS
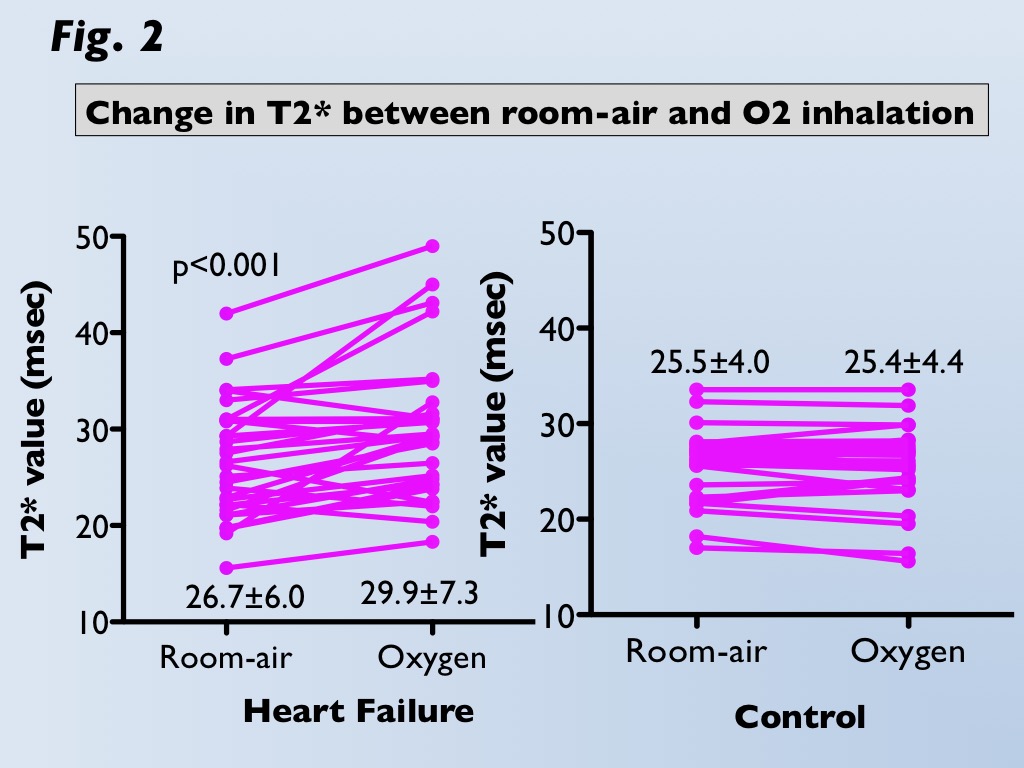
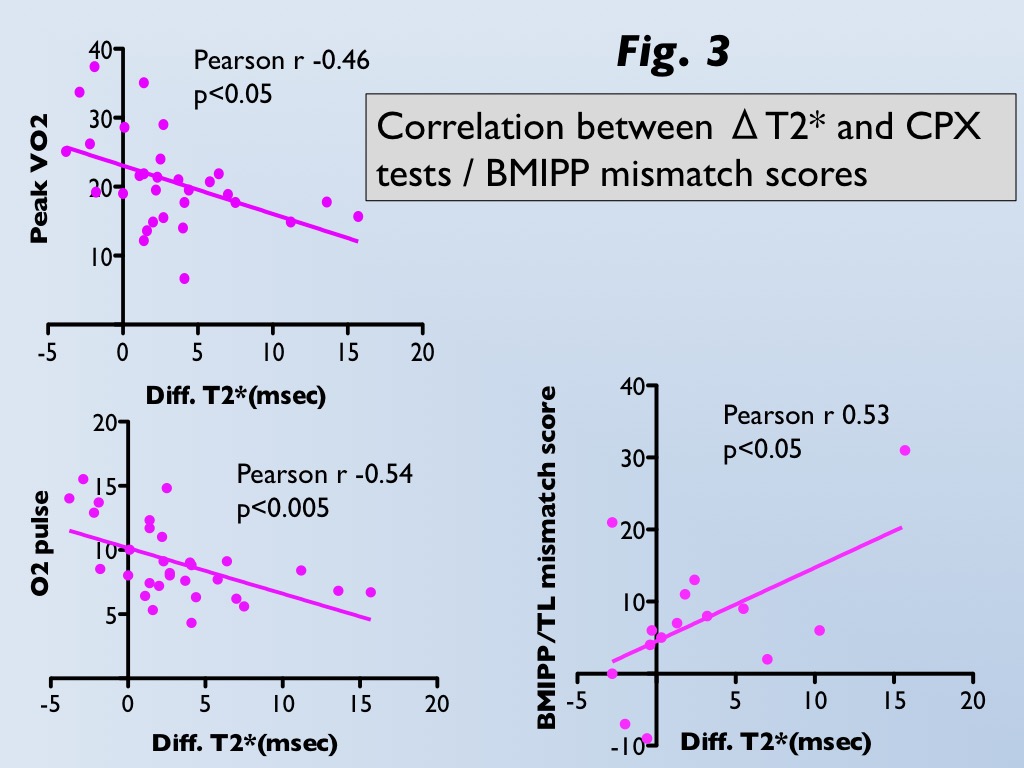
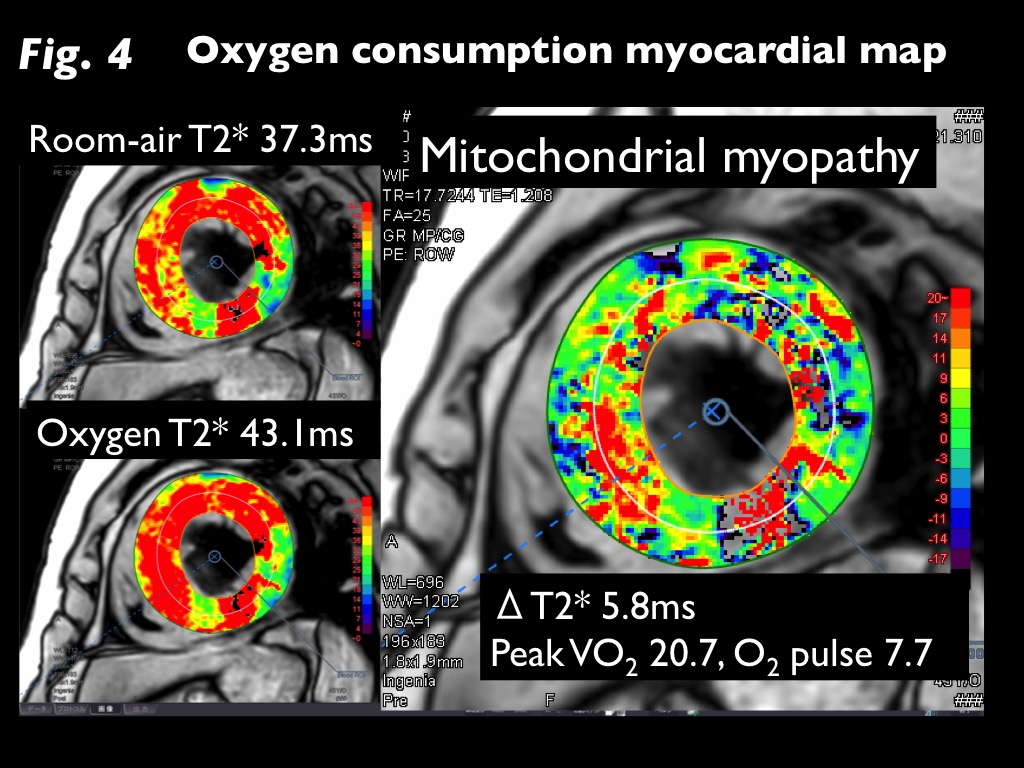
M-T2* was significantly greater under oxygen inhalation than room-air in HF (29.9±7.3ms vs. 26.7±6.0ms, p<0.001), whereas there was no difference in controls (25.5±4.0ms vs. 25.4±4.4ms; Fig 2). ΔT2* was significantly greater for HF than controls (3.2±4.5ms vs. -0.1±1.3ms, p<0.001). Significant correlations between ΔT2* and CPX tests (peak VO2, r=-0.46, p<0.05; O2 pulse, r=-0.54, p<0.005) in HF and between ΔT2* and BMIPP/TL mismatch scores (r=0.53, p<0.05) in acute MI were observed (Fig 3). T2*-air, T2*-oxy, and ΔT2* maps for representative HF and acute MI cases are presented in Figures 4 and 5.DISCUSSION
Cause of increased ΔT2* in patients with HF and acute MI 1. The increase of the diamagnetic property of Oxy-Hb in myocardial vessels may be explained by the lower oxygen consumption in the myocardium due to dysfunction of the mitochondria (6). 2. An increase in Oxy-Hb levels contributes to T2*-prolongation caused by impaired vasoconstriction under oxygen stress in injury myocardium (7). 3. In the failing dilated heart, the interstitial component of cardiac tissue with richer fibrosis and capillary beds relatively increases in the myocardium (8). These pathological alterations result in a sustained increase in Oxy-Hb levels in capillary beds.CONCLUSION
In conclusion, both ΔT2* and T2*-oxy are increased in patients with HF, and ΔT2* is correlated with systematic oxygen metabolism during exercise, as measured by the CPX test. In reperfused acute MI, ΔT2* is correlated with the extent of ischemia as expressed by the mismatch of BMIPP and TL. Our method is a novel imaging technique to non-invasively quantify systematic and myocardial oxygen consumption. ΔT2* can be used as an imaging biomarker for cardiac functional reserve and potential ischemic damage.Acknowledgements
This work was supported by the Japan Society for the Promotion of Science (JSPS) KAKENHI (16K10321).References
1. Agostini D, Iida H, Takahashi A, Tamura Y, Amar MH, Ono Y. Regional myocardial metabolic rate of oxygen measured by O2-15 inhalation and positron emission tomography in patients with cardiomyopathy. Clin Nucl Med 2001; 26: 41–49.
2. Imamura T, Kinugawa K, Nitta D, Inaba T, Maki H, Hatano M, et al. Novel scoring system using cardiopulmonary exercise testing predicts prognosis in heart failure patients receiving guideline-directed medical therapy. Circ J 2015; 79: 1068–1075.
3. Ogawa SL, TM., Kay, AR. Tank, DW. Brain magnetic resonance imaging with contrast dependent on blood oxygenation. Proc NatI Acad Sci USA 1990; 87: 9868–9872.
4. Nagao M, Matsuo Y, Kamitani T, Yonezawa M, Yamasaki Y, Kawanami S, et al. Quantification of myocardial iron deficiency in nonischemic heart failure by cardiac T2* magnetic resonance imaging. Am J Cardiol 2014; 113: 1024–1030.
5. Mochizuki T, Murase K, Higashino H, Miyagawa M, Sugawara Y, Kikuchi K et al. Ischemic “memory image” in acute myocardial infarction of 123-I-BMIPP after reperfusion therapy: a comparison with 99m-Tc-pyrophosphate and 201-Tl dual isotope SPECT. Ann Nucl Med 2002; 16: 563-568.
6. Huss JM, Kelly DP. Mitochondrial energy metabolism in heart failure: a question of balance. J Clin Invest 2005;115:547–555.
7. Moradkhan R, Sinoway LI. Revisiting the role of oxygen therapy in cardiac patients. J Am Coll Cardiol 2010; 56 :1013–1016.
8. Meloni A, Pepe A, Positano V, Favilli B, Maggio A, Capra M, et al. Influence of myocardial fibrosis and blood oxygenation on heart T2* values in thalassemia patients. J Magn Reson Imaging 2009; 29 :832–837.
Figures