3249
Quantitative MRI measurement of the interplay between myocardial function, perfusion, structure and metabolism during acute and chronic remodeling in a porcine model of myocardial infarction1Translational Biomarkers, Merck Sharp & Dohme, Singapore, Singapore, 2Translational Biomarkers, Merck Sharp & Dohme, Singapore, 3Advanced Imaging Research Center, Oregon Health and Science University, Portland, OR, United States, 4Cardiovascular Research Institute, National University Heart Center, Singapore, 5Department of Surgery, Yong Loo Lin School of Medicine, National University of Singapore, Singapore, 6Comparative Medicine Imaging Facility, Center for Life Sciences, National University of Singapore, Singapore, 7Department of Biomedical Engineering, National University of Singapore, Singapore, 8Translational Biomarkers, Merck & Co., Inc., West Point, PA, United States
Synopsis
We present a comprehensive characterization of LV structure,
function, perfusion and metabolism in a porcine animal model with myocardial
infarction with view to develop a translational platform for future testing of
safety and efficacy of novel heart failure therapeutics. Dynamic contrast enhanced MRI and tagging MRI
are employed to obtain non-invasive quantitative magnetic resonance imaging
(MRI) biomarkers for characterization.
Results demonstrate an acute decrease in function and perfusion in the infarct
region and functional compensation in the remote region with associated
increased metabolic activity. Chronic
remodeling is associated with decreased metabolic activity in the infarct
region along with increased fibrosis.
Purpose:
Heart failure is a growing epidemic with over 23 million patients suffering from this condition worldwide. Early detection coupled with therapeutic strategies that mitigate deleterious cardiac remodeling before irreversible structural change is critical to sustain long-term cure. Pre-clinical animal models afford a unique opportunity to understand disease biology through an in-depth characterization of disease progression and remodeling longitudinally using a range of quantitative biomarkers. Well characterized models can potentially serve as early translational platforms for the investigation of the safety and efficacy of novel experimental therapeutics. Herein, we characterized acute and chronic left ventricular (LV) remodeling in a porcine model of heart failure with a myocardial infarction (MI) insult, in which comprehensive non-invasive regional interrogation of myocardial metabolism, perfusion, function, and structure was conducted using quantitative magnetic resonance (MR) imaging biomarkers.Methods:
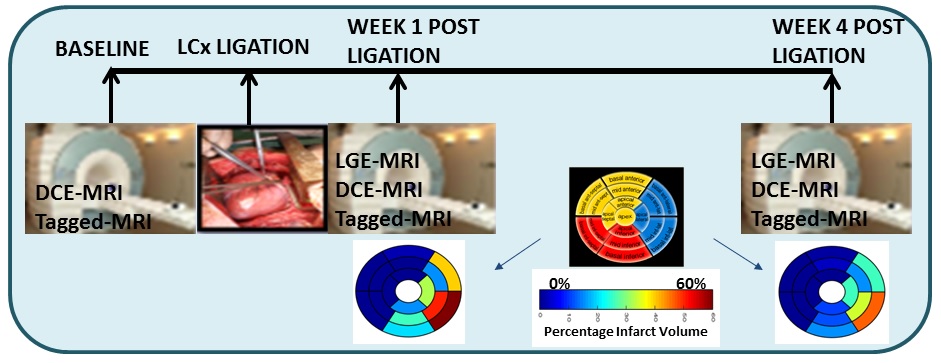
Animals and Equipment: All interventions and imaging experiments were reviewed and approved by IACUC at Merck & Co., Inc. (West Point, PA, USA) and at the National University of Singapore (NUS). Eight pigs (weight: 52±6 kg (mean±SD), age: 4-6 months) were imaged using a 3-T Skyra MR imaging scanner (Siemens Medical Solutions, Germany). The pigs were imaged at baseline and at 1 week and 4 weeks following the MI procedure (see Figure 1). MI was induced by left-circumflex coronary artery ligation following median sternotomy.
DCE MRI: A dual-bolus first pass perfusion protocol using contrast agent (CA) gadolinium-DTPA (Magnevist, Bayer Healthcare, Germany) was employed for DCE-MRI. The injection volumes were; low bolus: 0.005 mmol/kg and high bolus: 0.1 mmol/kg. During each bolus injection, a saturation recovery-FLASH pulse sequence was used to recursively acquire three short-axis (SA) LV slices (basal, mid, apical) for a total of one minute using the following imaging parameters: FOV: 340´255 mm2, imaging matrix: 192´154, slice thickness: 8 mm, averages: 1, bandwidth: ±113 KHz, TR/TE: 176.75 ms/0.99 ms, time delay from saturation pulse: 105 ms, flip angle: 10°, parallel imaging mode: GRAPPA, acceleration factor: 2, reference lines: 128.
The arterial input function (AIF) was constructed by averaging the LV blood pool signal from the low bolus images, while myocardial regional tissue output curves were obtained from ROI averages from the high bolus images. R1(t) was computed using the equation for steady-state signal from a gradient echo sequence 1,2 for both blood and tissue. The plasma contrast agent concentration time course Cp(t) or (AIF) was obtained through a linear relationship between R1(t) and Cp(t), assuming a hematocrit value of 0.45 [1,2]. Finally, with a scaled AIF for the high bolus experiment, the shutter speed pharmacokinetic model [1,2] was employed to fit the regional tissue R1 curves by optimizing the model parameters Ktrans, ve and ti.
Tagged MRI: A gradient-echo based SPAMM tagged MRI pulse sequence was used to acquire orthogonally tagged images for the three SA slices using the following imaging parameters: FOV: 290´290 mm2, imaging matrix: 224´179, slice thickness: 8 mm, averages: 1, bandwidth: ±50 KHz, TR/TE: 50.04 ms/2.65 ms, flip angle: 10°, tag separation: 8 mm. The HARP tracking method 3 was employed to track voxel based displacement trajectories, which were then used to obtain voxel-based Lagrangian circumferential strain (CS) 4. Regional averages of peak CS were then computed.
LGE MRI: Late gadolinium enhancement images were additionally acquired. The freely available software Segment v1.9 R3612 (http://segment.heiberg.se) 5 was used to segment infarct regions. Percentage infarct volume in regions was then computed.
Results and Discussion:
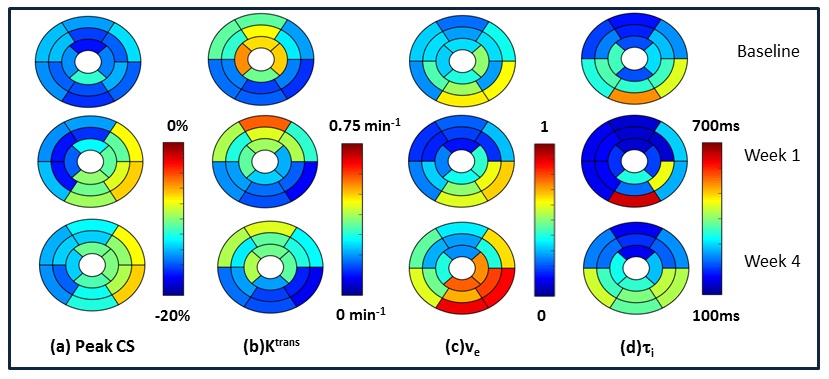
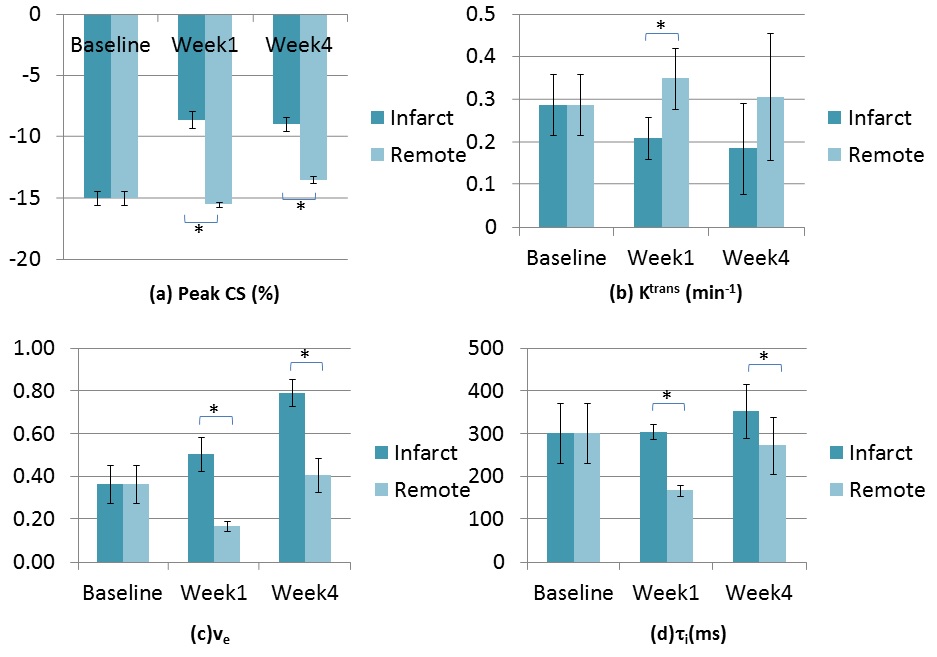
The MI was localized in the lateral, infero-lateral and inferior regions (see Bulls eye plots in Figure 1). Bulls eye plots of the mean biomarker value for 8 animals in 16 segments are shown in Figure 2. The bar plots in Figure 3 depict the mean and standard deviation of the biomarker for 8 animals in infarcted segments and remote segments. During acute remodeling, maintaining CS in the remote region is associated with a potential increase in cardiac metabolism (lower ti) 6,7 coupled with a decrease in extravascular extracellular volume fraction (lower ve) and increased perfusion (higher Ktrans) (partially due to vessel dilation in the remote regions) (see Figs 2&3). The infarct region is associated with lower CS and higher ve (likely due to myocyte injury). During chronic remodeling, the infarct region is associated with lower metabolic activity (higher ti) coupled with a persistent decline in CS and even higher ve (likely due to fibrosis). The over compensatory effects observed acutely in the remote regions appear to normalize.Conclusion:
Non-invasive quantitative MRI methods can be used to characterize the interplay of cardiac function, structure, metabolism and perfusion during post-infarct remodeling in a pre-clinical porcine animal model.Acknowledgements
No acknowledgement found.References
[1] Yankeelov TE, Rooney WD, Li X, et. al. Variation of the relaxographic “Shutter-Speed” for transcytolemmal water exchange affects the CR bolus-tracking curve shape. MRM. 2003;50:1151-1169.
[2] Tudorica A, Oh KY, Chui SY-C, et. al. Early prediction and evaluation of breast cancer response to neoadjuvant chemotherapy using quantitative DCE-MRI. Transational Oncology. 2016; 9(1):8-17.
[3] Osman NF, McVeigh ER, Prince JL. Imaging heart motion using harmonic phase MRI. IEEE TMI. 2000;19:186-202.
[4] Osman NF, Prince JL. Visualizing myocardial function using HARP MRI. Phys Med Biol. 2000;45: 1665-1682.
[5] Heiberg E, Sjorgren J, Ugander M, et. al. Design and validation of Segment-freely available software for cardiovascular image analysis. BMC Med Imaging. 2010;10:1.
[6] Zhang Y, Poirier-Quinot M, Springer CS, et. al. Active trans-plasma membrane water cycling in yeast is revealed by NMR. Biophys J. 2011; 101:2833-2842.
[7] Springer CS, Li X, Todorica LA, et. al. Intratumor mapping of intracellular water lifetime: metabolic images of breast cancer? NMR Biomed. 2014; 27:760-773.
Figures