3248
An analysis of radial sequence parameters in myocardial first-pass perfusion for optimised imaging1CBRU, Royal Brompton Hospital, London, United Kingdom, 2NHLI, Imperial College London, London, United Kingdom, 3UCAIR, University of Utah, UT, United States
Synopsis
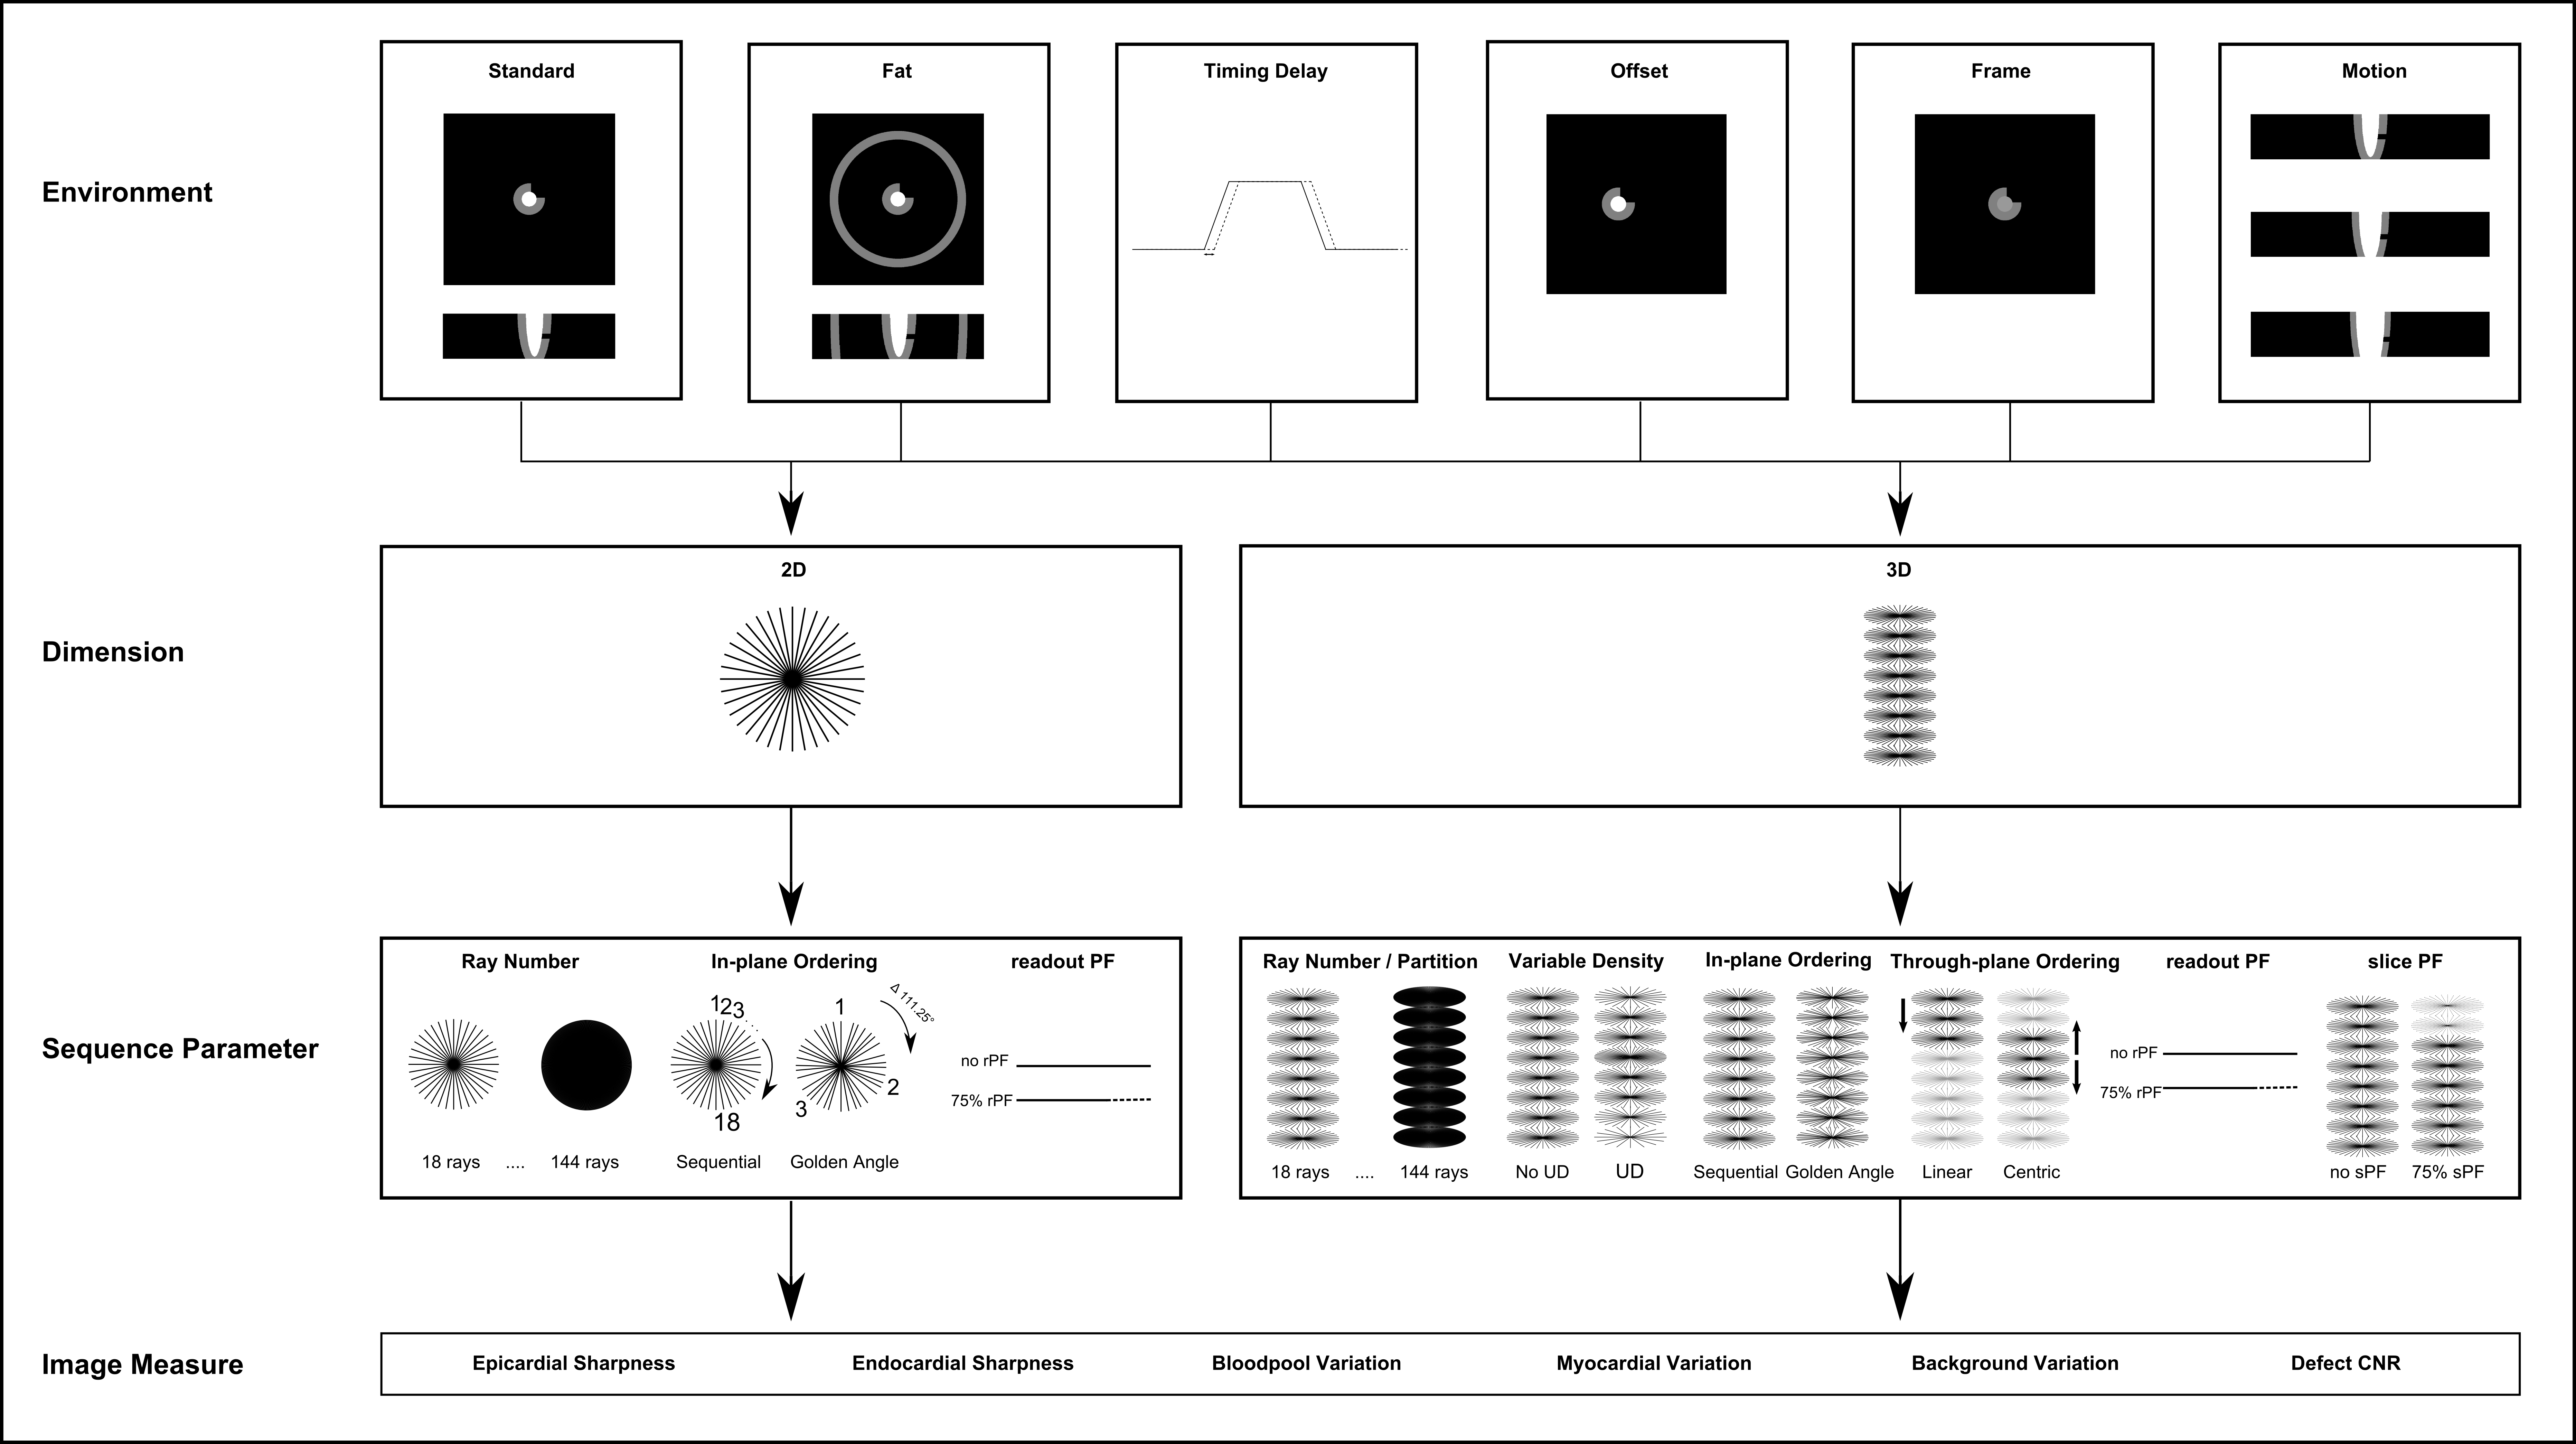
A simulation framework is devised to analyse sequence parameters in radial first-pass perfusion for optimised imaging. A model containing left-ventricular myocardium, bloodpool and defect was radially sampled in 2D and 3D under multiple sequence parameters variations, tested with differing imaging environments. Automatic measures of sharpness, signal variation and CNR were made on the N=1016 simulation reconstructed images and results of interest are presented.
Introduction
Myocardial first-pass perfusion (FPP) is well-established clinically1, with continuing improvements in resolution2 and coverage3 but is constrained by reduction of shot duration and artefacts. Radial imaging is potentially useful for its robustness to motion and undersampling. Cartesian and spiral trajectories in FPP have previously been optimised4,5, but detailed investigations have not appeared for radial FPP.
Controlled separation of contributory factors to image quality in vivo is difficult, requiring multiple contrast injections, and can be confounded by the imaging environment. This work aims to optimise radial FPP by simulating 2D and 3D sampling strategies, plus multiple “environmental” factors.
Methods
A simulation framework (Figure 1) was created in Matlab(Natick,CA) based on finely resolved 3D ellipsoids representing left ventricular myocardium and blood-pool. A segment of mid-ventricular myocardium was zeroed representing a local strong perfusion defect; locality aimed to test 3D partition fidelity although realistically in CAD it may continue apically. Saturation-recovery spoiled gradient-echo radial sampling of the object’s k-space was computed in 2D or 3D including Bloch simulations of first-pass T1 variations.
The following sequence parameters were tested: ray number (18,24,36,72,144[‘fully-sampled’]), in-plane ordering (sequential,golden angle), readout partial Fourier(off,75%) and, for 3D imaging, through-plane ordering (linear,centric), slice partial Fourier(off,75%) and variable undersampling (‘VU’) of ray number per partition (off, 100%(center kz)-33%(outer kz)).
Different environments (Figure 1), aiming to expose the relative importance of sequence parameters under differing imaging conditions, were as follows: an ellipsoidal shell representing bright subcutaneous fat (T1=250ms), timing difference between gradient axes “delay” (~2µs), offset of the heart from isocenter (3cm), altered blood/myocardium T1 combinations (peak,second-pass) during FPP, and cardiac filling motion during acquisition.
Image reconstruction was performed with a fixed gridding algorithm, using no further methods of undersampling correction. Partial Fourier acquisitions were zero-filled. The aim was to investigate factors impacting the basic acquired data, rather than differing reconstruction methods.
Six automatic measures of image quality were implemented per simulation: Sharpness of endocardial and epicardial borders; Normalised signal variation within blood-pool, myocardium and background; and defect CNR.
Simulations of combined sequence parameters were grouped by environmental conditions. Multiple regression analyses of the six quality measures were used separately per group for 2D (N=120) and 3D (N=896), aiming to identify relative contributions to image quality.
Results & Discussion
2D
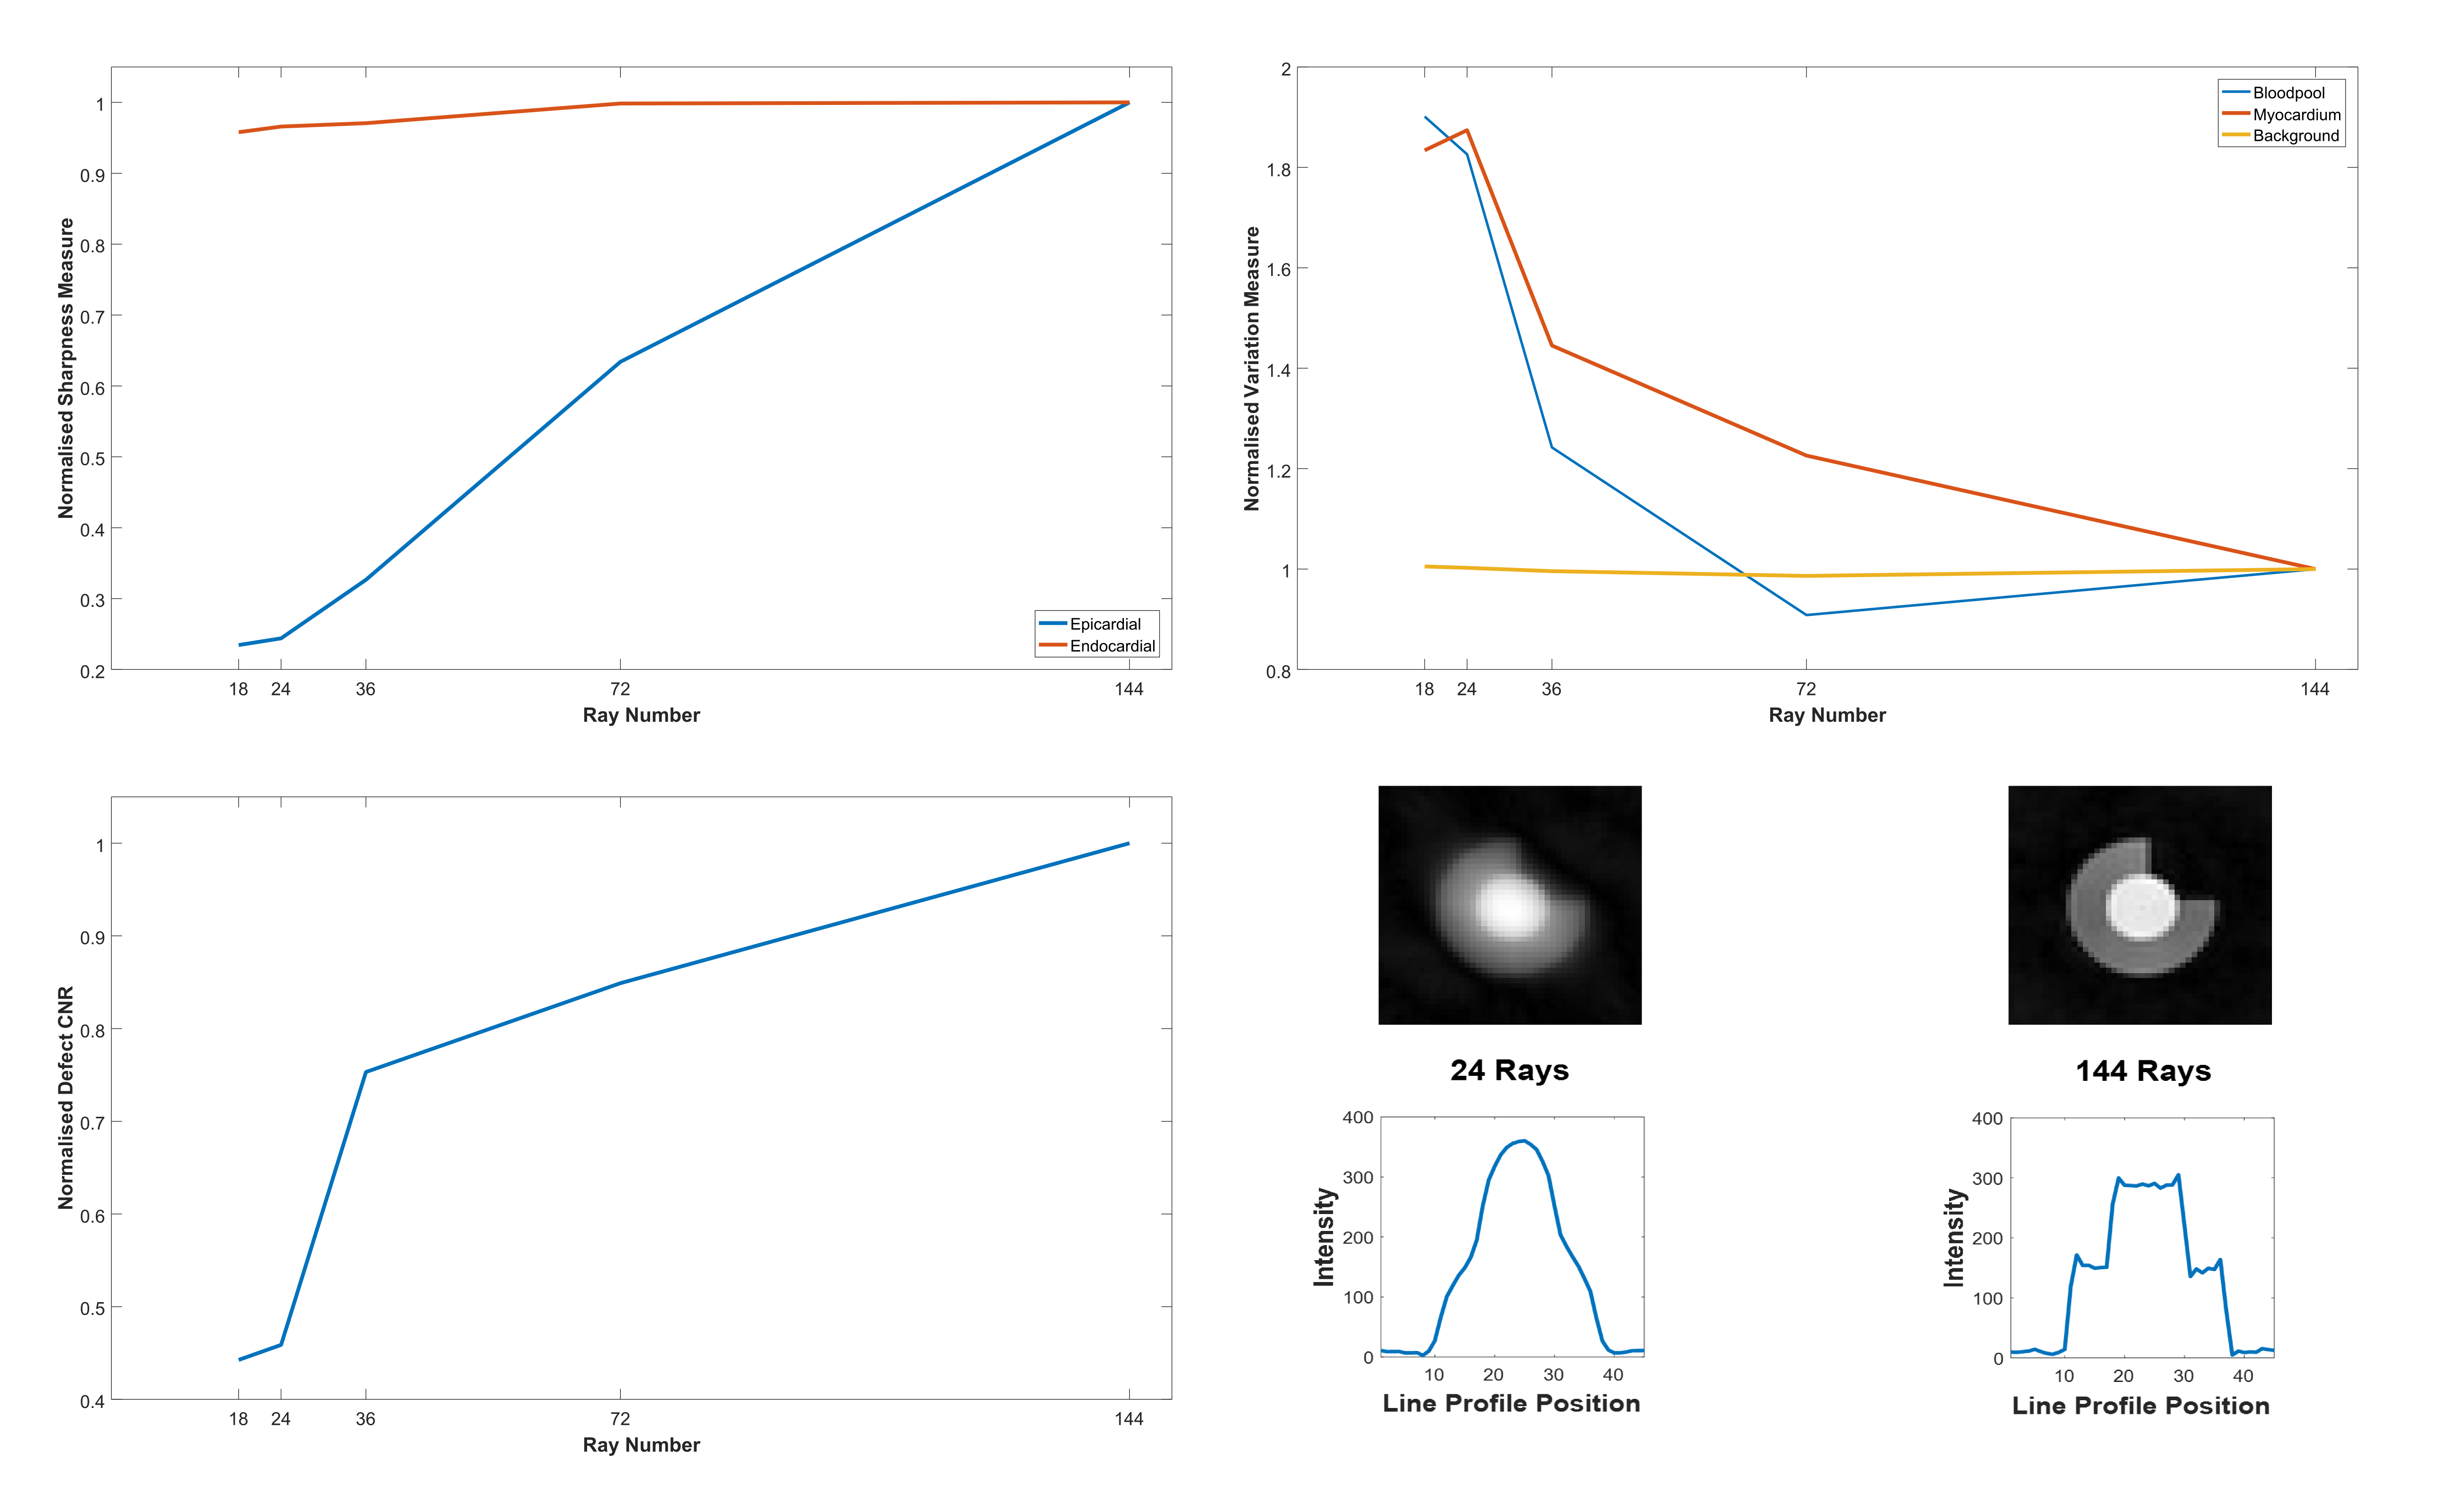
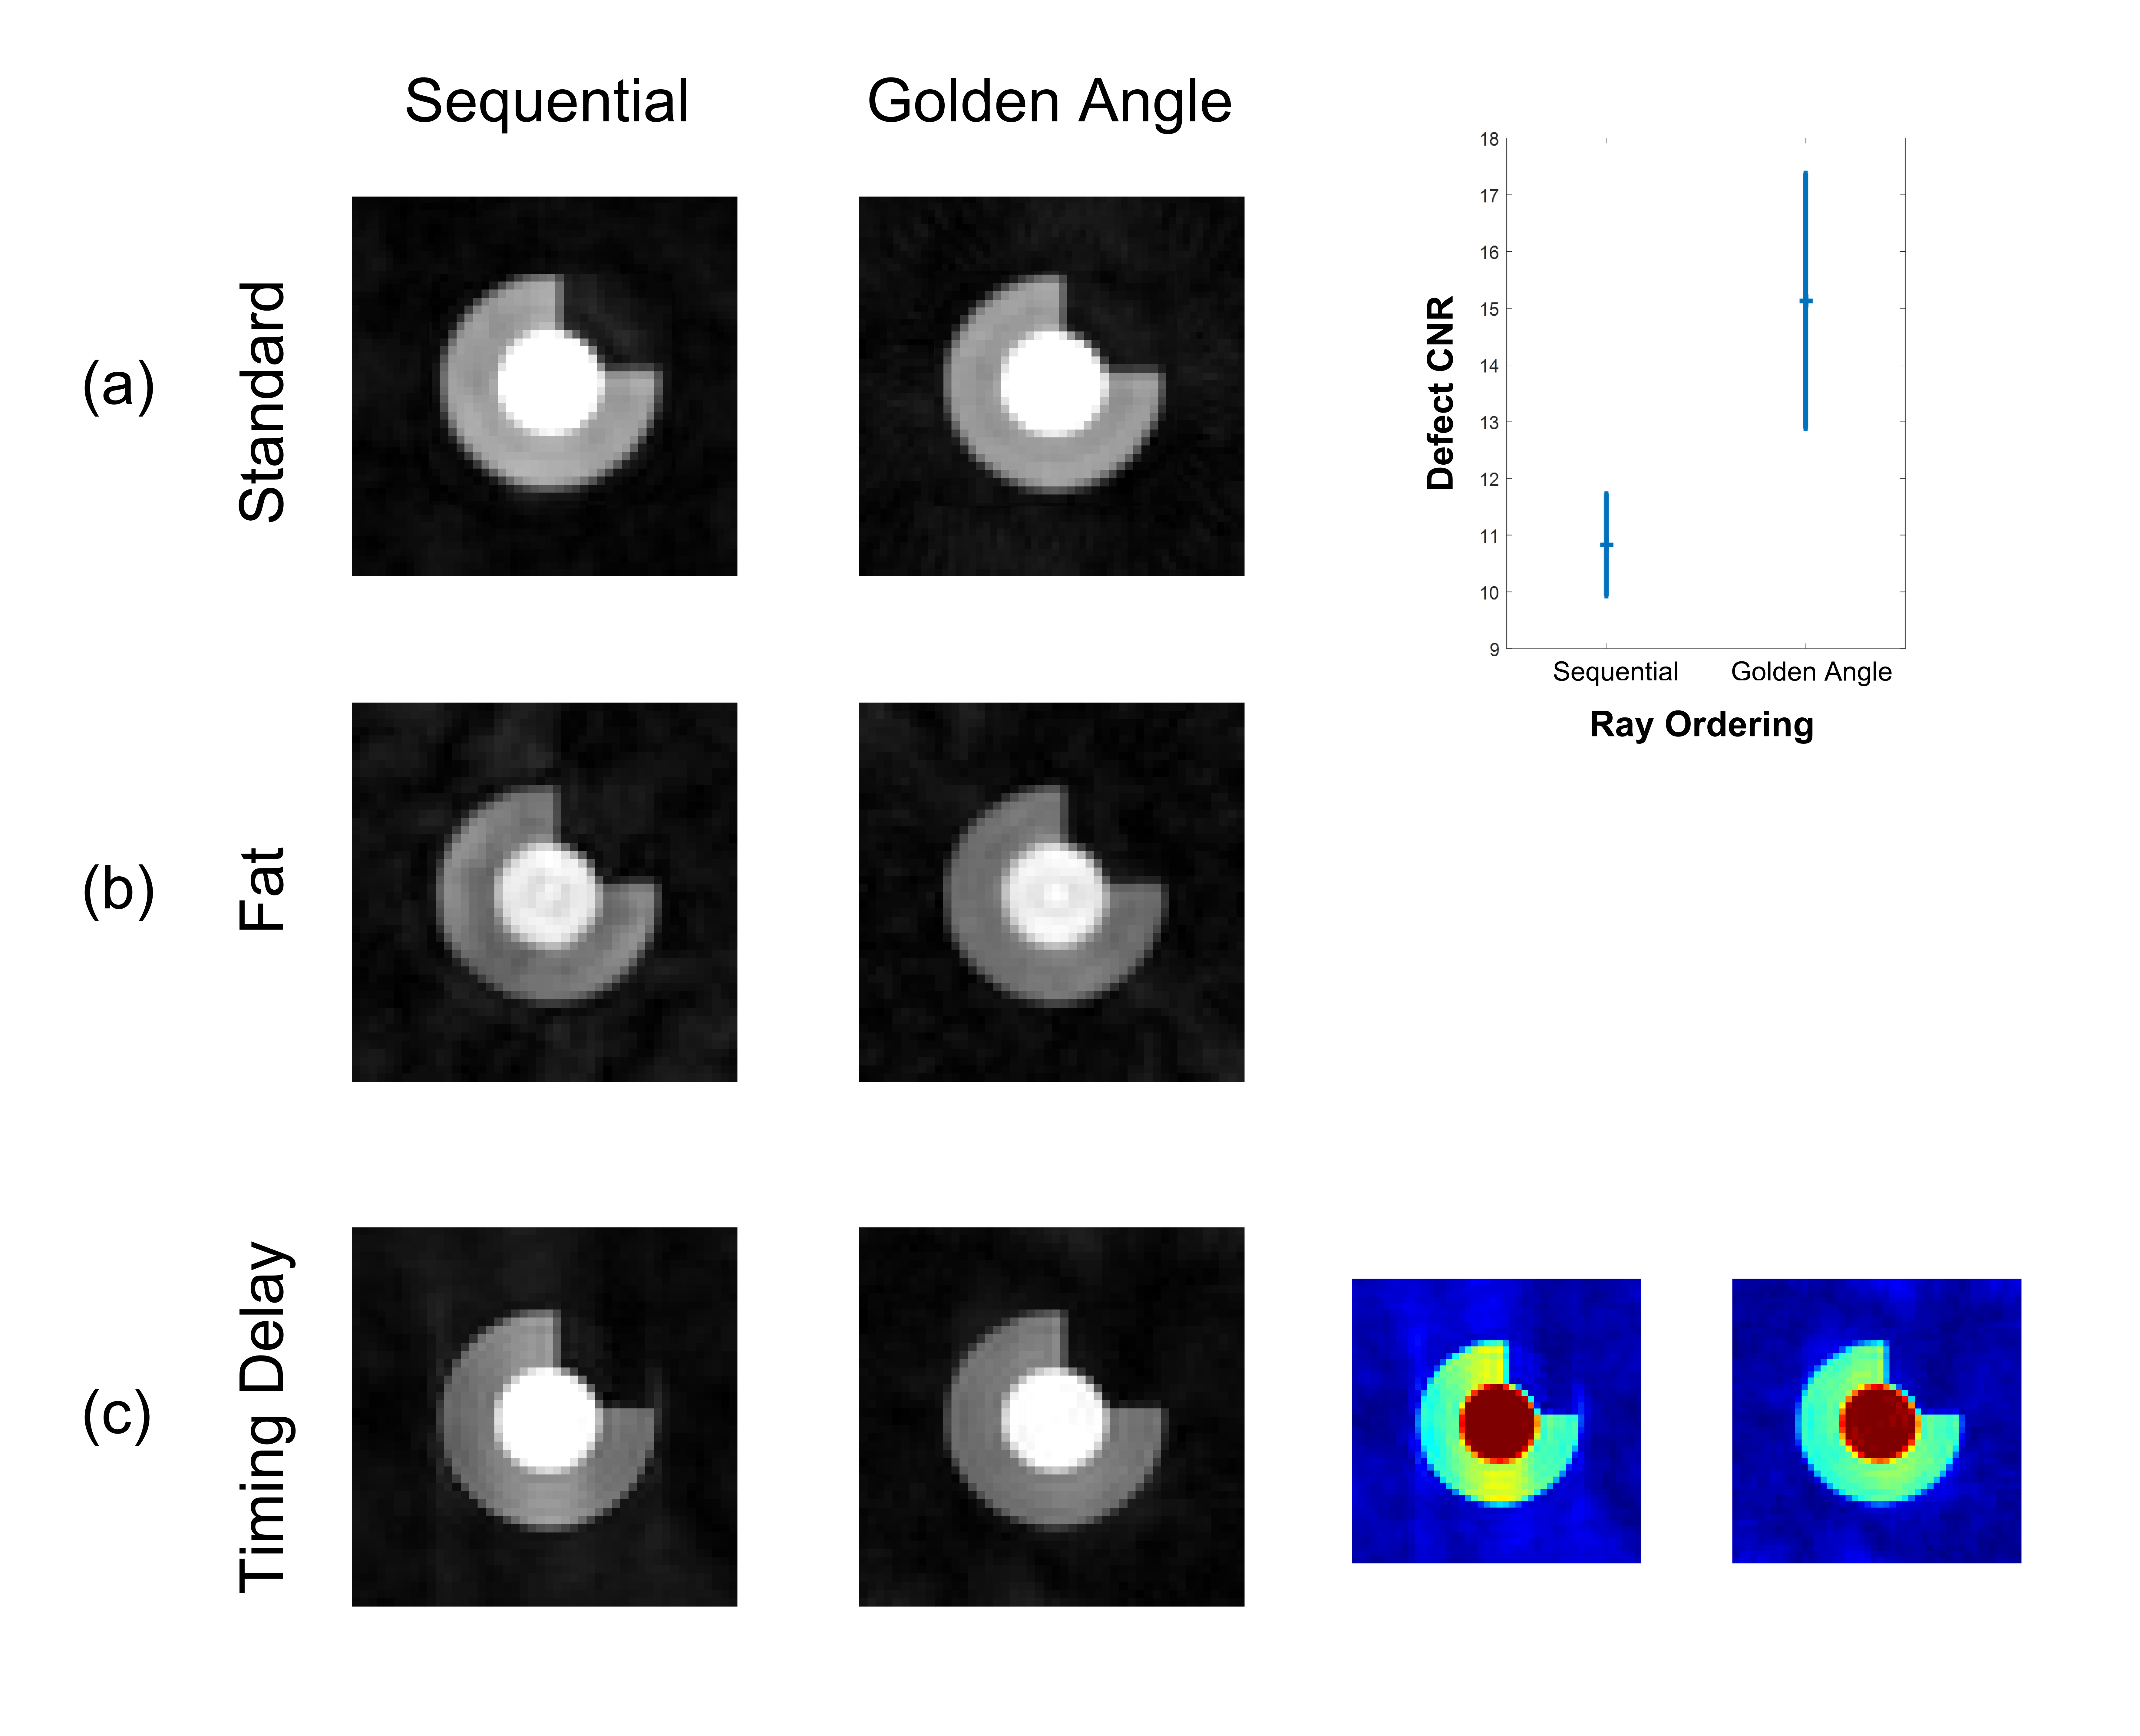
Standard: ray number predictably had a statistically significant effect on almost all image measures (Figure 2), especially epicardial sharpness and defect CNR, the latter showing non-linearity and a sharp drop around the ray numbers required for short FPP shot duration. Readout partial Fourier (rPF) significantly reduces epicardial sharpness. Golden angle ray ordering significantly improves myocardial signal variation and defect CNR compared to sequential (Figure 3a).
Modified Environments: Adding environmental modifications significantly altered many of the measures compared to the standard simulations (Figure 4). Separate analysis of individual variable contributions to these mean changes was performed for each group: Bright fat increased the intensity of streaking across the image with distribution affected by ray ordering, increasing its impact on myocardial variation and defect CNR (Figure 3b). Likewise, due to their different overall angular ranges, trajectory order significantly affected these measures in the presence of timing delay (Figure 3c) and, to a lesser extent, motion. The reduced bloodpool:myocardium contrast of the later perfusion frame resulted in fewer significant variables, only ray number remaining of large effect.
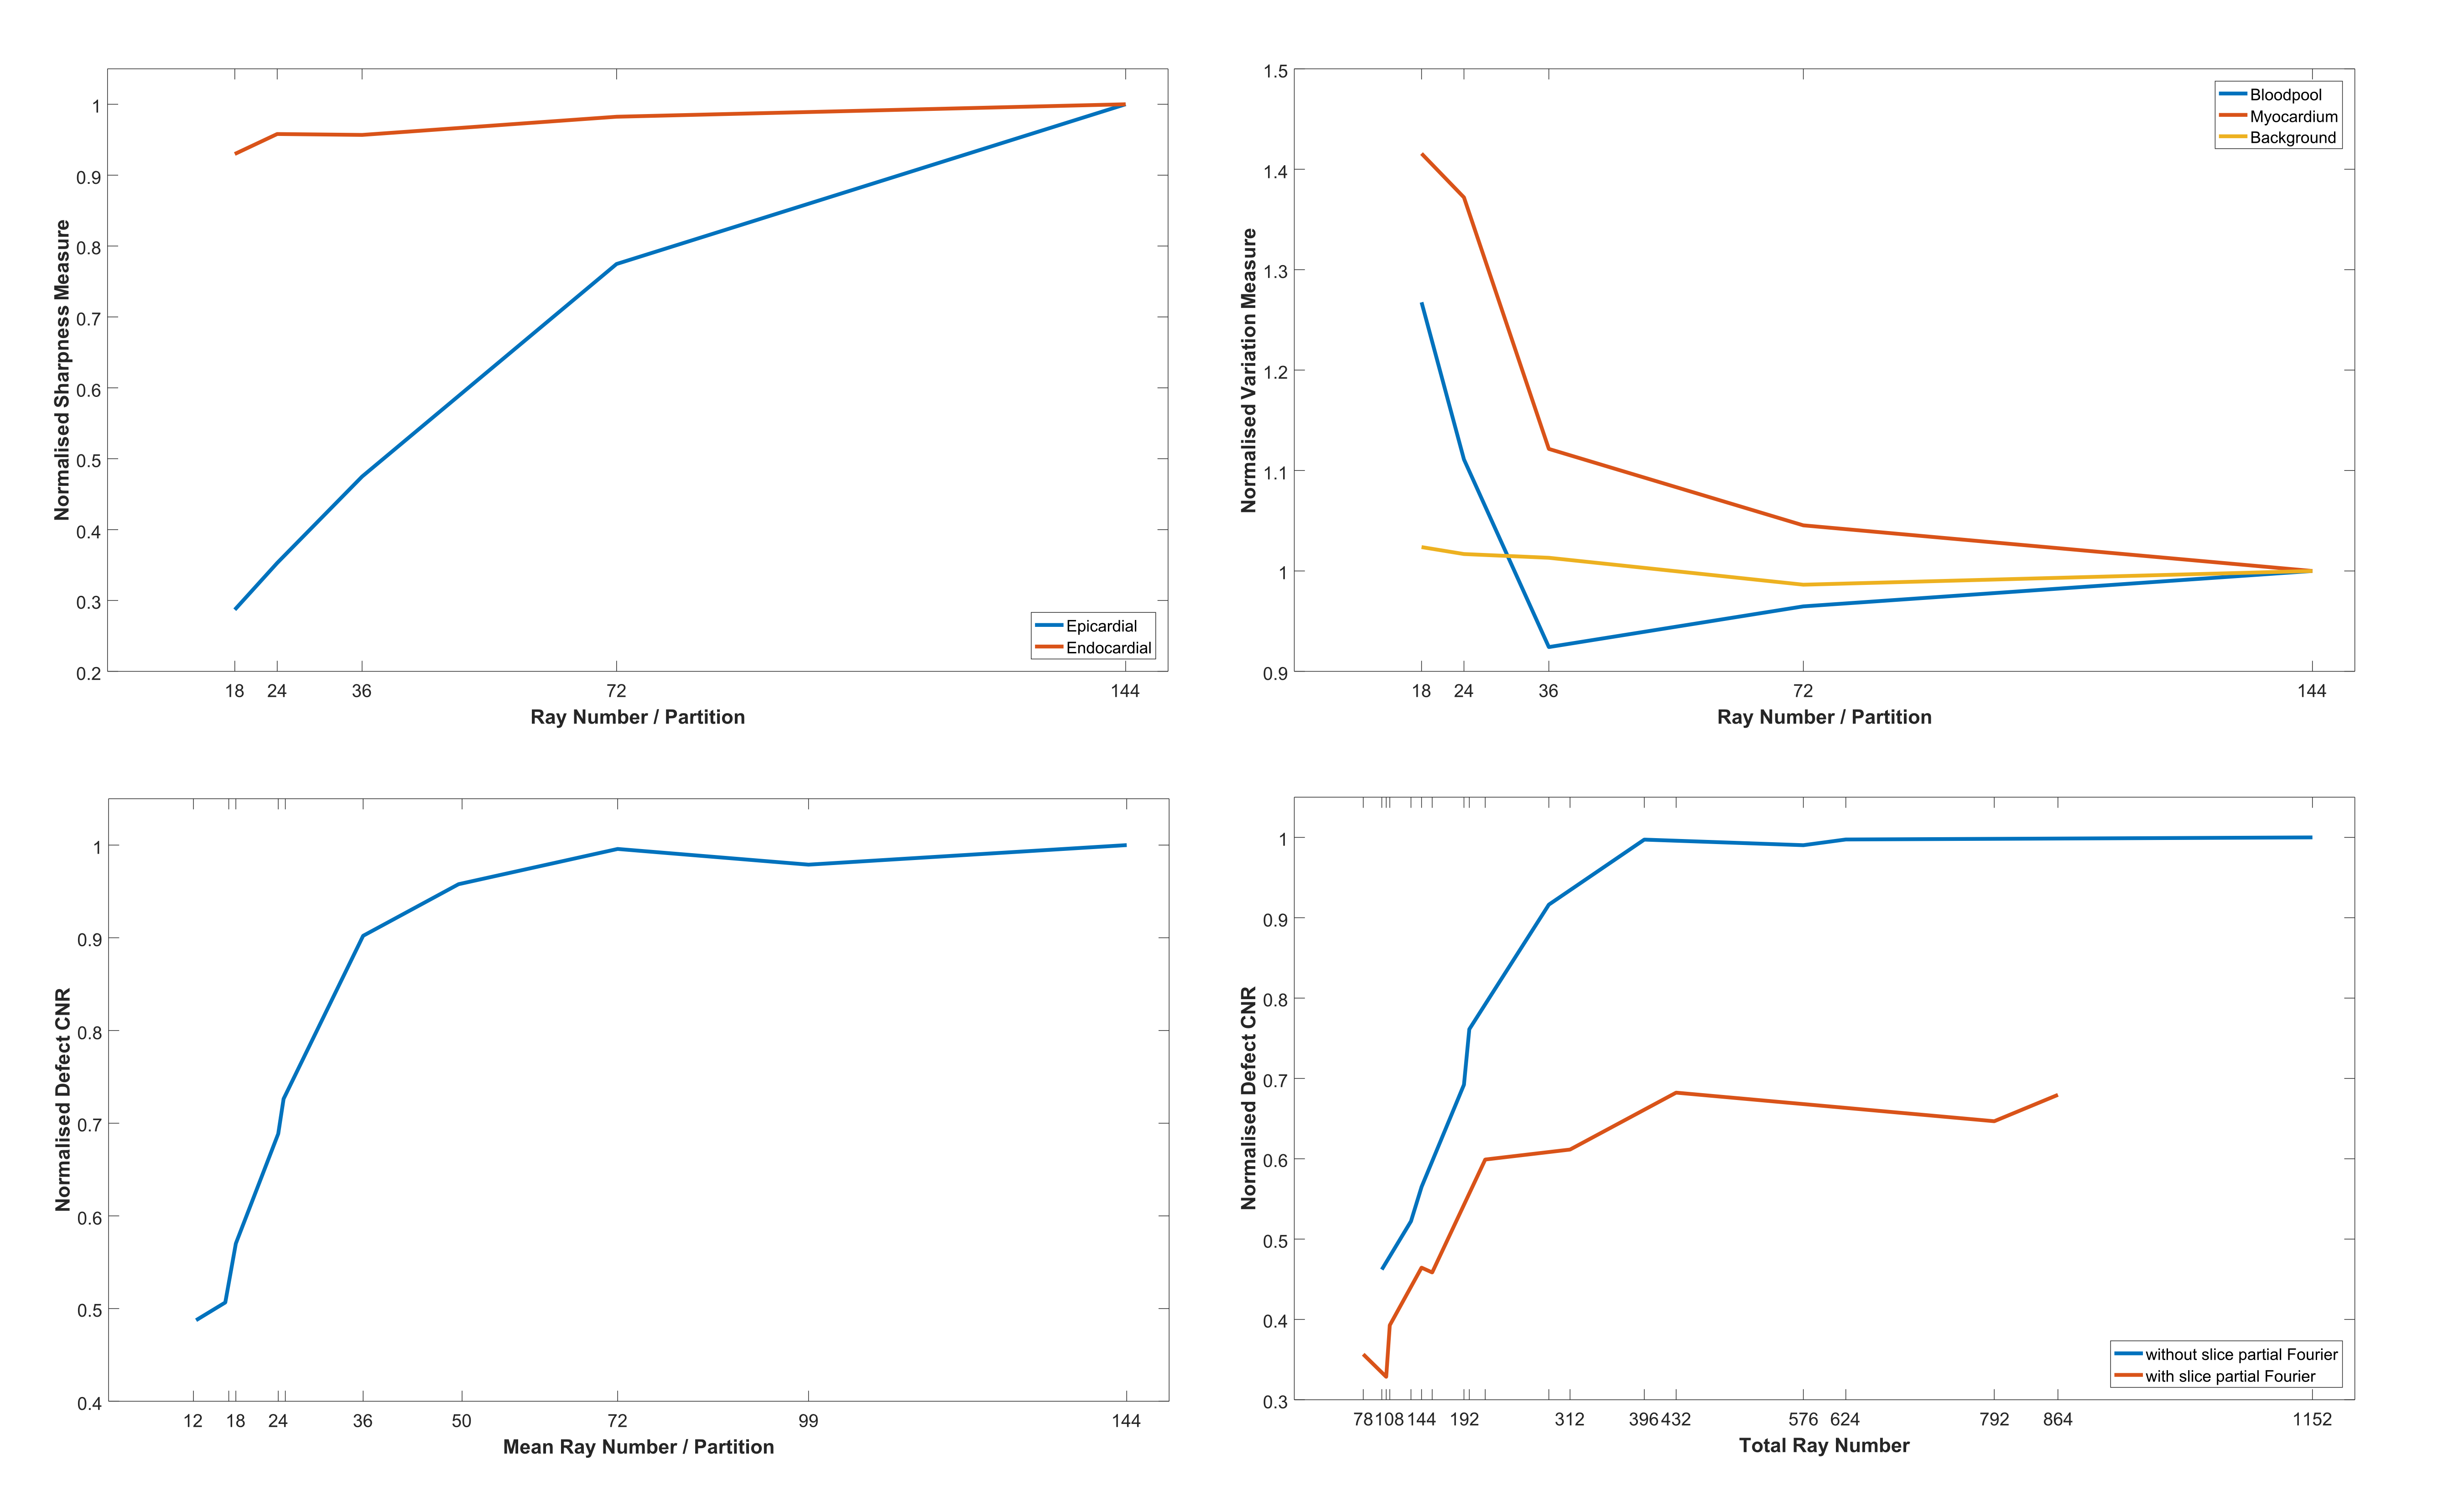
3D
Standard: Figure 5 shows similar results to 2D for ray number. Further including VU and sPF allowed plotting ray number at more positions along the defect CNR curve and enabled demonstration of the apparent benefit in using fewer rays per partition without sPF, compared against the same total number of rays by combining more per partition with sPF (Figure 5, bottom right). This difference weakens at total ray numbers realistically useful for 3D FPP, forming a compromise against other effects from fewer rays per partition. sPF significantly reduces defect CNR and including VU negatively impacted both defect CNR and myocardial uniformity; both parameters likely increase through-plane partial-volume errors.
Modified Environments: (Figure 4) The presence of fat or timing delay in 3D significantly impacted myocardial variation, although the strength of this effect appears distributed over the 3D variables. Defect CNR in these environments remained dominated by choice of sPF and Ray Number, as in standard 3D simulations. Motion showed strong negative impact with increasing ray number (total ray number restricted for reasonable 3D FPP shot duration).
Conclusions
The 2D and 3D FPP simulation framework enabled image quality comparisons for varying radial imaging parameters under modified environments. The results highlighted importance of particular variables, towards improved understanding and image quality in radial FPPAcknowledgements
This work was supported by the NIHR Cardiovascular Biomedical Research Unit of Royal Brompton and Harefield NHS Foundation Trust and Imperial College London, UK.
MF is funded by a British Heart Foundation (BHF) PhD Studentship Grant - FS/13/21/30143.
References
1. Schwitter J, Wacker CM, Wilke N, et al. Superior diagnostic performance of perfusion-cardiovascular magnetic resonance versus SPECT to detect coronary artery disease. J Cardiovasc Magn Reson. 2012;14(1):61.
2. Plein S, Salome R, Schwitter J, et al. Dynamic contrast-enhanced myocardial perfusion MRI accelerated with k-t sense. Magn Reson Med. 2007;58(4):777-785.
3. Manka R, Jahnke C, Kozerke S, et al. Dynamic 3-dimensional stress cardiac magnetic resonance perfusion imaging. J Am Coll Cardiol. 2011;57(4):437-444.
4. Salerno M, Sica CT, Kramer CM, et al. Optimization of spiral-based pulse sequences for first-pass myocardial perfusion imaging. Magn Reson Med. 2011;65(6):1602-1610.
5. Zhou Z, Bi, X, Wei J, et al. First-pass myocardial perfusion MRI with reduced subendocardial dark-rim artefact using optimized Cartesian sampling. J Magn Reson Imaging. 2016; DOI: 10.1002/jmri.25400
Figures