3247
Analysis of Coronary Contrast Agent Transport in Bolus Based Quantitative Myocardial Perfusion MRI Measurements with Computational Fluid Dynamics (CFD) Simulations in High Performance Computing (HPC) Environments1Comprehensive Heart Failure Center, University Hospital Wuerzburg, Wuerzburg, Germany, 2Dept. of Biomedical Engineering & Physics, Academic Medical Center, Amsterdam, Netherlands
Synopsis
Aim of the project is the execution of computationally extremely challenging CFD simulations of blood flow and contrast agent (CA) transport in coronary arteries on HPC clusters. Therefore scalability testing is performed to assess the suitability of applied software codes in HPC environments. Cardiovascular 3D-models are extracted from high-resolution cryomicrotome imaging data and meshed with computational grids. Navier-Stokes-equations for blood flow and the advection-diffusion-equation for CA transport are solved to obtain CA bolus dispersion in the epicardial vessels. We find indications of asymptotically decreasing dispersion effects with increasing vessel generation.
Introduction
Long-term aims of our project are analysis and correction of systematic errors in dynamic contrast agent (CA) bolus-based MRI perfusion measurements. In this non-invasive method, the passage of intravenously injected CA through tissue is monitored to quantify myocardial perfusion. This requires knowledge of shape of CA wash-in through the upstream epicardial vessel. For technical reasons this shape is measured in the left ventricle, which introduces the risk of systematic errors in myocardial blood flow (MBF) quantification due to bolus dispersion in coronary vessels. Past studies1-3 suggest decreasing influence of smaller vessels on dispersion and prompt the existence of a limiting vessel generation, after which influence of smaller vessels vanishes. We expect this around vessel generation 9-10 (vessel radii ~0.1mm).
Execution of simulations on highly detailed vascular 3D-models (including small arteries) poses high demands on available computational power. Computation times for the models in previous studies2,3 executed parallel on 128 processors (HPC-cluster elwetritsch, University Kaiserslautern) required up to ~10 days. To keep computation times within acceptable limits the conduction of simulations on large HPC-clusters allowing higher parallelization appears inevitable.
To test and assess the suitability of the applied software and solver codes for parallelization on >1000 processors, dedicated scalability tests were performed. To this purpose computations are run on different numbers of processors and required computation times compared. This allows to evaluate the application’s parallel performance.
Methods
With dedicated software (VMTK, www.vmtk.org, SimVascular, www.simvascular.org), 3D models of epicardial arteries are extracted from high-resolution porcine coronary imaging data from an imaging cryomicrotome4,5, which allows to resolve vessels down to 160 µm diameter. These are meshed with computational grids (ICEM-CFD, ANSYS Inc, cfMesh, creativeFields) of tetrahedral, hexahedral or mixed type. Subsequently CFD simulations are performed in a 2-step-procedure with CFD-software OpenFOAM (www.openfoam.org): First Navier-Stokes-equations for blood flow are solved for one cardiac cycle. Resulting velocity fields are stored as interim results for the subsequent computation of the advection-diffusion-equation for CA transport over several heart beats. As a measure for bolus dispersion transit delays and vascular transport function’s (VTF) variance σ² are calculated according to 6.
To prepare and enable the analysis of vascular geometries down to vessel generation 9-10 in HPC environments, scalability tests have been performed in the framework of Partnership for Advanced Computing in Europe (PRACE) Preparatory Access. Parallel simulations were executed on varying processor numbers (256, 512, 1024, 2048), different mesh-types (tetra-/hexahedral) and grid sizes (5-80 million cells).
Results
Figure 1 shows scaling results obtained on HPC-cluster Hazel Hen (Höchstleistungsrechenzentrum Stuttgart, HLRS). The application showed near-linear scaling behavior on larger grids for parallel computations on up to 1024 cores with different mesh-types (tetra-/hexahedral). Computations on more cores did not yield further acceleration. Considering file-management, the structure of OpenFOAM is such that the number of files scales with the number of processors. This amounts to 100 millions of files (Figure 2), which causes extensive input-output-operations and large filespace allocations of the order of terabytes.
Figure 3 shows obtained bolus dispersion results in vessels from generation 3-8. Figure 4 shows dependence of VTF variance on transit delays for all outlets of Figure 1. σ² and transit delay are smaller than 2 s and 1.5s respectively. Simulations on the model in Figure 1 showed diminishing CA bolus dispersion, shorter transit delay times and smaller VTF variance in comparison to the results in gerenations 2-63.
Discussion
Figure 1 shows the application’s improved scaling behavior on larger grids. In accordance with 7 this means that the number of cells per processor is a major determinant of computing time. Increasing cell numbers by further splitting the 3D-grid is equivalent to shrinking cell sizes, which decelerates computational speed. This prohibits enhancing computational grids in this way to improve scalability.
As depicted in Figure 2, parallel computations on 1000s of processors produces large file numbers, resulting in many read-write-operations, which can severely slow down computations. Using a ramdisc may help overcome this issue.
Figures 3 and 4 reflect reduced influence of increasingly smaller vessels on CA dispersion in coronary arteries. As was expected, the obtained results on vessel geometries with generations 3-8 had less effect on bolus dispersion than the vessel generations 2-6 analyzed before ³.
Conclusion
Obtained CA bolus dispersion results reinforce the hypothesis of asymptotically decreasing bolus dispersion in higher vessel generation models.
To limit computation times to acceptable duration CFD simulations of vascular models down to vessel generation 9-10 (Figure 5) must be executed on large HPC-clusters. This requires further optimization of the application concerning file-management and scalability. Improving scaling behavior on larger grids represents a promising perspective.
Acknowledgements
We acknowledge financial support of German Ministry of Education and Research (BMBF, grants: 01EO1004, 01E1O1504).
We acknowledge PRACE and University Stuttgart for awarding us access to HPC-cluster Hazel Hen @ HLRS, Stuttgart.
We acknowledge University Kaiserslautern for access to HPC-cluster elwetritsch.
Special thanks to Aniello Esposito, Mandes Schönherr (HLRS/Cray), Dr. Karsten Sommer and Regine Schmidt (University Mainz).
References
1. Graafen D, Münnemann K, Weber S, Kreitner KF, Schreiber LM. Quantitative contrast-enhanced myocardial perfusion magnetic resonance imaging: Simulation of bolus dispersion in constricted vessels. Medical Physics. 2009;36 (7):3099-3106.
2. Sommer K, Bernat D, Schmidt R, Breit HC, Schreiber LM. Contrast Agent Bolus Dispersion in a Realistic Coronary Artery Geometry: Influence of Outlet Boundary Conditions. Annals of Biomedical Engineering. 2013;42(4):787-796.
3. Sommer K, Schmidt R, Graafen D, Breit HC, Schreiber LM. Resting myocardial blood flow quantification using contrast-enhanced magnetic resonance imaging in the presence of stenosis: A computational fluid dynamics study. Medical Physics. 2015;42(7):4375-4384.
4. van den Wijngaard JPHM, Schwarz JCV, van Horssen P, et al. 3D Imaging of vascular networks for biophysical modeling of perfusion distribution within the heart. Journal of Biomechanics. 2013;46:229-239.
5. Spaan JAE, ter Wee R, van Teeffelen JWGE. Visualisation of intramural coronary vasculature by an imaging cryomicrotome suggests compartmentalization of myocardial perfusion areas. Medical & Biological Engineering & Computing. 2005;43:431-435.
6. Calamante F, Willats L, Gadian DG, Connelly A. Bolus Delay and Dispersion in Perfusion MRI: Implications for Tissue Predictor Models in Stroke. Magnetic Resonance in Medicine. 2006;55:1180-1185.
7.Duran A, Celebi MS, Piskin S, Tuncel M. Scalability of OpenFOAM for Bio-medical Flow Simulations, PRACE White Paper. June 9, 2014. http://www.prace-ri.eu/IMG/pdf/WP162.pdf. Accessed November 9, 2016.
Figures
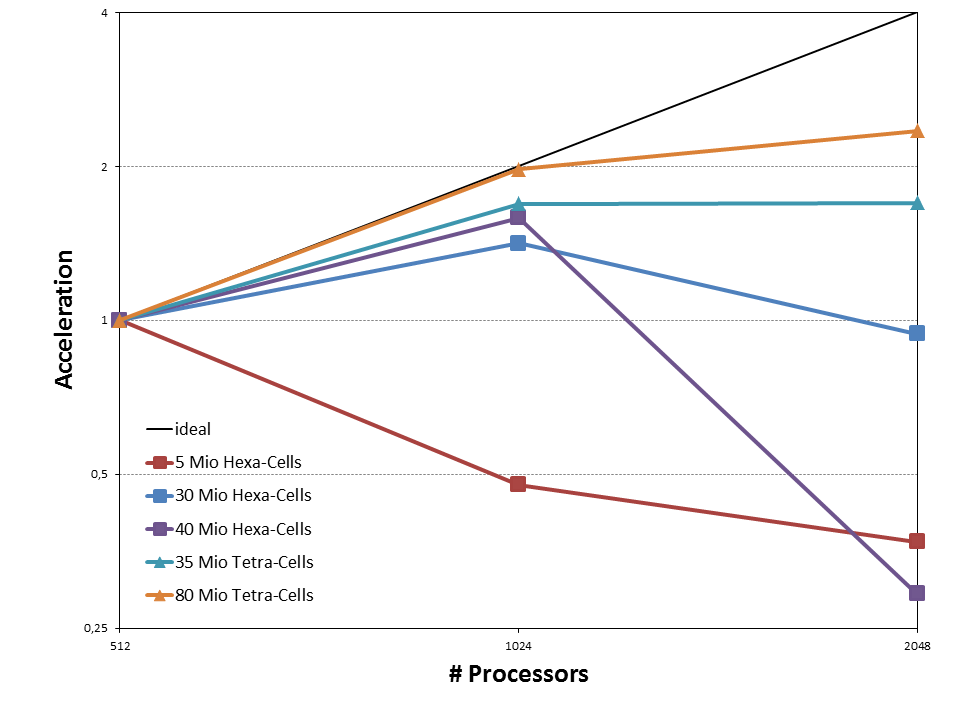
Figure 1:
Scaling behavior of application on varying grid sizes for tetrahedral and hexahedral mesh-types. In this doubly logarithmic plot, on the y-axis the acceleration relative to computations on 512 processors is plotted against the number of used processors on the x-axis. Ideally the necessary computation times halve when the numbers of processors are doubled (i.e. acceleration factors of 2). Acceleration is observed up to 1024 cores on all but the smallest grid (5 Mio cells), the application thus scales better on large grids. The scaling behavior is also influenced by the applied mesh-type.
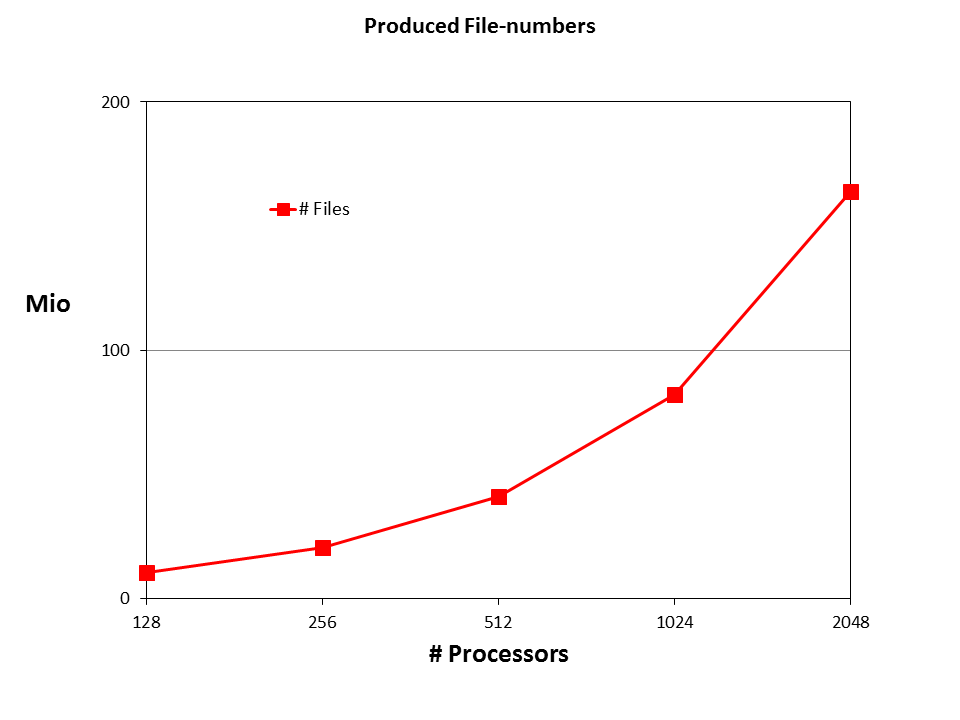
Figure 2:
Produced file-numbers in dependence of parallelization. In this half-logarithmic plot, the number of produced interim results (in Mio) is plotted against the number of utilized processors. The structure of OpenFOAM is such that the number of written files scales with the degree of parallelization, which leads to unacceptably high file numbers of 100s of Mio for computations on 1000s of processors.
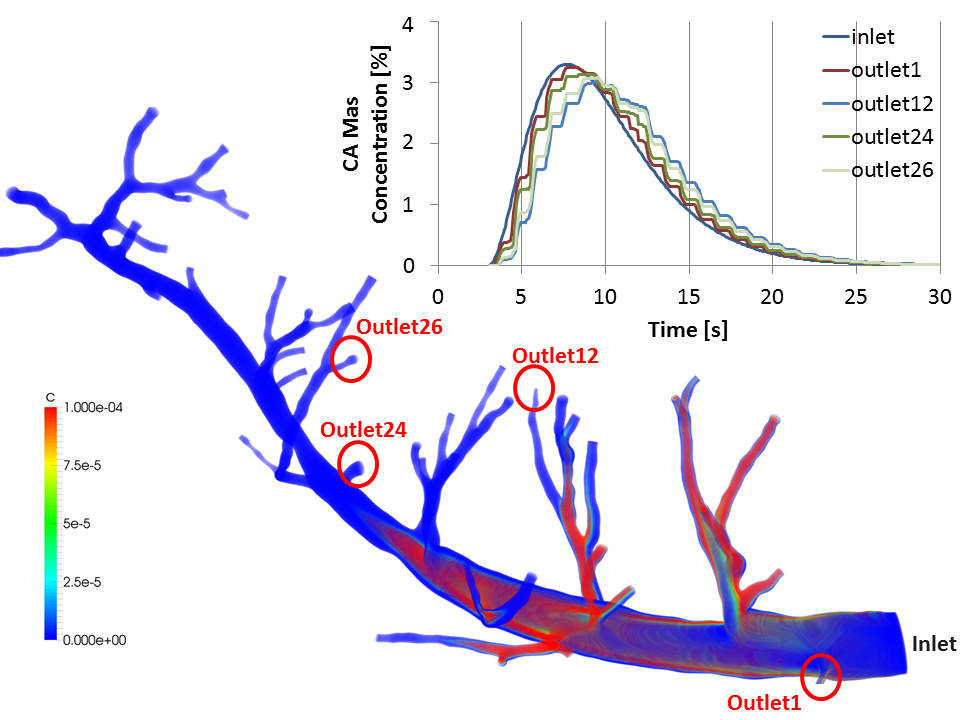
Figure 3:
Flow of contrast agent through vessel geometry starting from left marginal artery (first branch) of Ramus Interventricularis Anterior down to vessels of radius ~0.2 mm (corresponding vessel generation 3 to 8). This model was extracted from porcine cardiovascular imaging cryomicrotome data with resolution of 160 µm. Parallel simulation of blood flow and CA transport (50 heart beats) on 128 processors on the HPC cluster elwetritsch (University Kaiserslautern) took ~10 days. Obtained CA bolus concentration time curves are plotted for exemplary outlets (among others those with minimum/maximum dispersion).
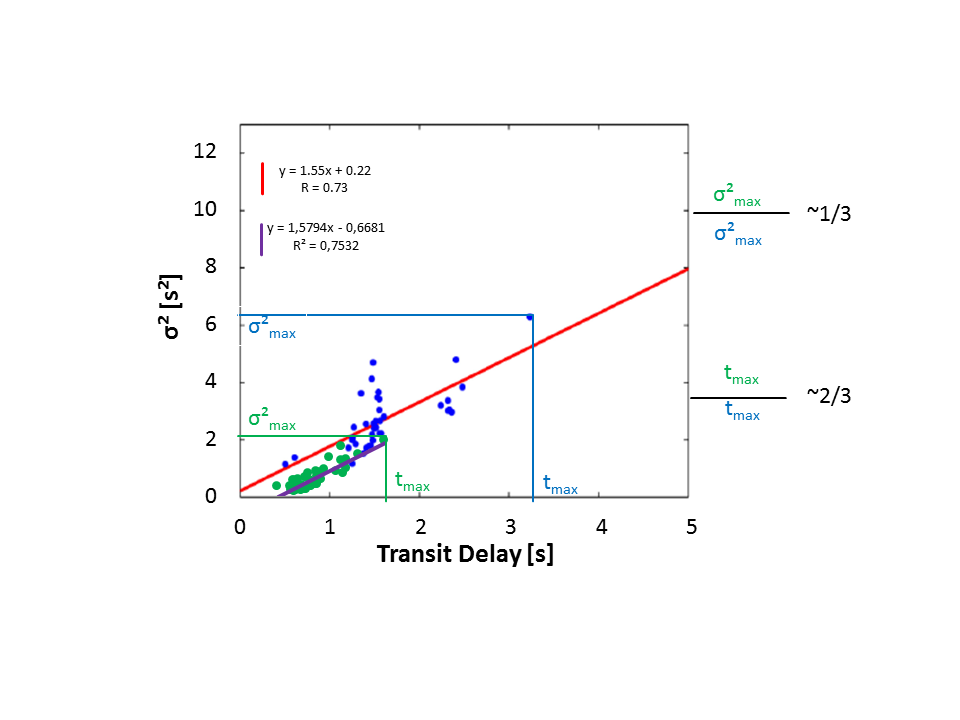
Figure 4:
Variance of VTF as measure for bolus dispersion plotted against transit delays for all model outlets of Figure 3 (green) in comparison to distribution in healthy human cardiac vessels of previous study 3 (blue). High σ² correspond to strong dispersion and transit delay describes the mean delay of CA at outlets. The recently obtained maximal values for σ² and transit delays are smaller and correlate stronger than in the previous study. The model in Figure 3 comprises vessel generations 3-8 whereas the model in 3 includes vessel generations 2-6. Smaller vessels thus exert less influence on bolus dispersion.
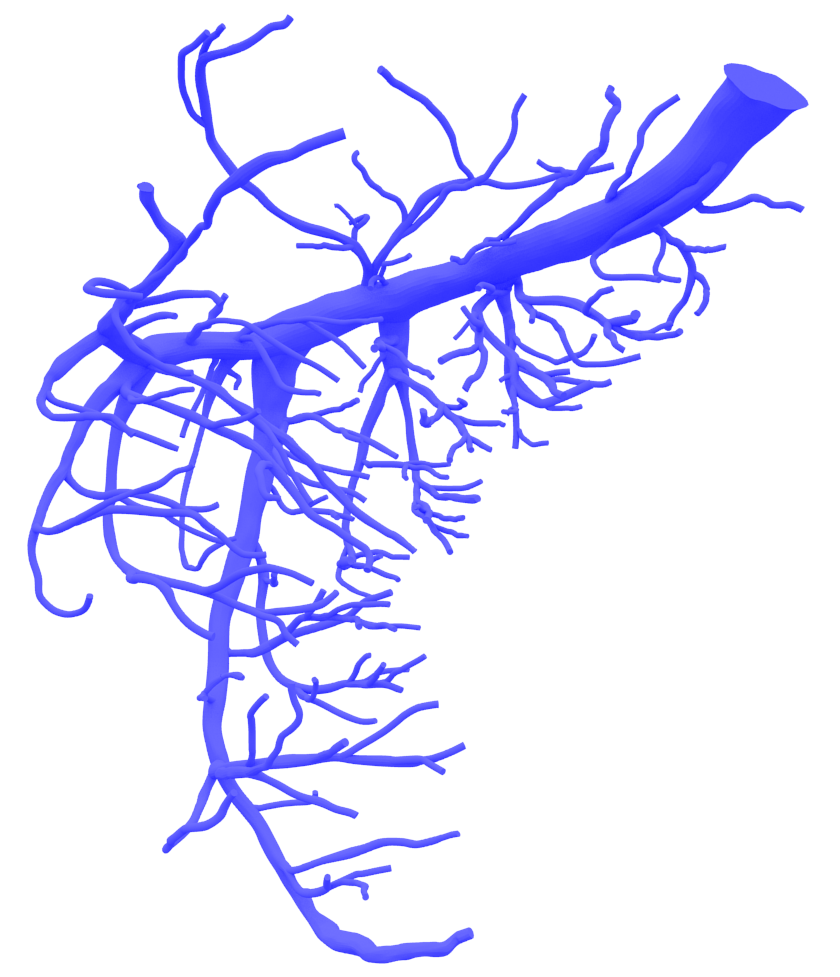
Figure 5:
3D vascular model of Ramus Circumflexus: Vessels down to a radius of 0.1 mm (vessel generation 9-10) are modeled. This geometry was extracted from the same cryomicrotome dataset as the model in Figure 3.