3245
Estimating extraction fraction and blood flow by combining first-pass myocardial perfusion and T1 mapping results1Department of Radiology and Imaging sciences, University of Utah, Salt Lake City, UT, United States, 2Division of Cardiovascular Medicine, University of Utah, Salt Lake City, UT, United States
Synopsis
Dynamic contrast enhanced MRI is maturing as a tool in contemporary cardiovascular medicine. However, there are challenging areas that have not been fully understood, such as modeling extraction of the contrast agent from the vasculature to the extravascular space. We present a technique that exploits information overlap between two different cardiac MRI techniques, namely, DCE-MRI and T1 mapping, in order to estimate extraction and flow. Our study shows that extraction fraction and myocardial blood flow can be estimated by fixing extracellular volume (ECV) to values obtained from T1 mapping.
Background
Quantitative myocardial perfusion MRI is still considered to be a challenging area that is not fully understood. For example, models with and without extraction fraction terms have been validated [1,2]. Extraction fraction (E) indicates the proportion of the tracer moving from the vascular space to the extracellular extravascular space (EES). Estimating E can complicate perfusion models but may be needed for accurate perfusion and myocardial perfusion reserve (MPR) estimates. We propose using ECV measures from T1 mapping to better estimate extraction fraction and flow parameters in a pharmacokinetic model.Methods
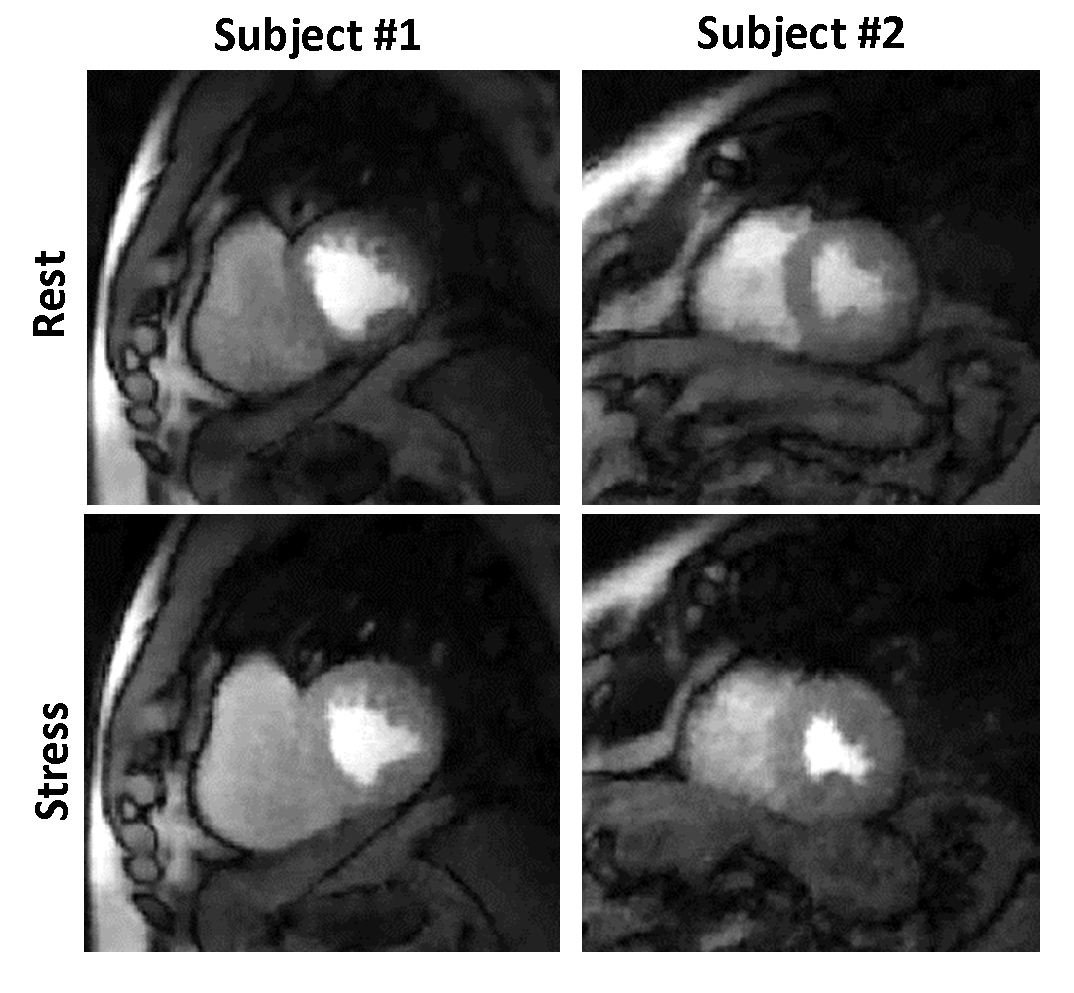
Acquisition: Subjects were imaged on a Siemens 3T Verio scanner. MOLLI T1 mapping was performed in 3 slices pre and post contrast. The perfusion scans were performed using an ungated saturation recovery prepared TurboFLASH pulse sequence. The acquisition parameters were 24 rays per image, TR = 2.2msec, TE = 1.2msec, flip-angle = 10°, resolution = 1.8 × 1.8 × 8mm3 voxels. Four short-axis (SA) slices were acquired after a single saturation pulse with a saturation recovery time of ∼25msec before the first slice. Gadoteridol 0.05 mmol/kg at a rate of 5mL/sec was injected and ∼240 frames were acquired over a minute with shallow breathing and no ECG gating. This was followed 20 ± 5minutes later by an injection of regadenoson to induce hyperemia. Contrast was injected ∼70sec after regadenoson injection to ensure maximal stress and the scan protocol was repeated. The data was acquired using an under sampled golden angle radial acquisition. It was reconstructed offline using a two-step multicoil spatio-temporally constrained reconstruction with total variation constraint [3]. Figure 1 shows a single frame for rest and stress perfusion images for two volunteers. Phase contrast scans of the coronary sinus(CS) were also acquired at rest and immediately after the stress perfusion acquisition to estimate global flow. 10 subjects were imaged though only 6 with successful CS measurements at rest and stress were processed. The ungated data was self-gated [4] and only the self-gated near-systole datasets were used.
Processing: A compartment model was used for quantification of MBF. The standard eq. for the Kety-Tofts model [5] can be modified to include extraction fraction as:$$C_{myo}(t)=C_{in}(t-\triangle{}T)*K^{trans}e^{-\frac{(1-Hct)}{v_{e}}K^{trans}t}+v_{b}\left[(1-E)C_{in}(t-\triangle{}T)+E\frac{(1-Hct)}{v_{e}}C_{in}(t-\triangle{}T)*K^{trans}e^{-\frac{(1-Hct)}{v_{e}}K^{trans}t}\right]....(1)$$
This eq.(1) represents a 5-parameter model with $$$K^{trans},v_{e},\triangle{}T,v_{b},E$$$ as the parameters to be estimated. A previous study by Larson et. al. [6] concluded that the use of such a model to estimate extraction fraction failed to estimate a unique set of perfusion parameters. However, since T1 mapping has become a part of clinical cardiac scans [7],$$$v_{e}$$$ can possibly be estimated separately.$$$v_{e}$$$ can be estimated using ECV from T1 mapping as follows:$$v_{e}=ECV.\rho{}-v_{p}=ECV.\rho{}-(1-Hct)v_{b}....(2)$$
$$$v_{p}$$$ represents the volume fraction of plasma and $$$\rho$$$ denotes the specific density of myocardial tissue (1.05g/ml).We investigated the reliability of perfusion parameter estimates with known $$$v_{e}$$$ using Monte-Carlo simulations. Using realistic tissue curves generated with MMID4, it was found that extraction fraction could be correctly estimated when additional information about $$$v_{e}$$$ was supplied during model fitting. The technique was then used to estimate myocardial blood flow in 6 subjects during rest and stress. 3 slices and 6 circumferential regions per slice were analyzed. ECV information was obtained using pre-contrast and post-contrast MOLLI T1 maps. The flows were averaged over all regions and slices for comparison with CS flows.
Results
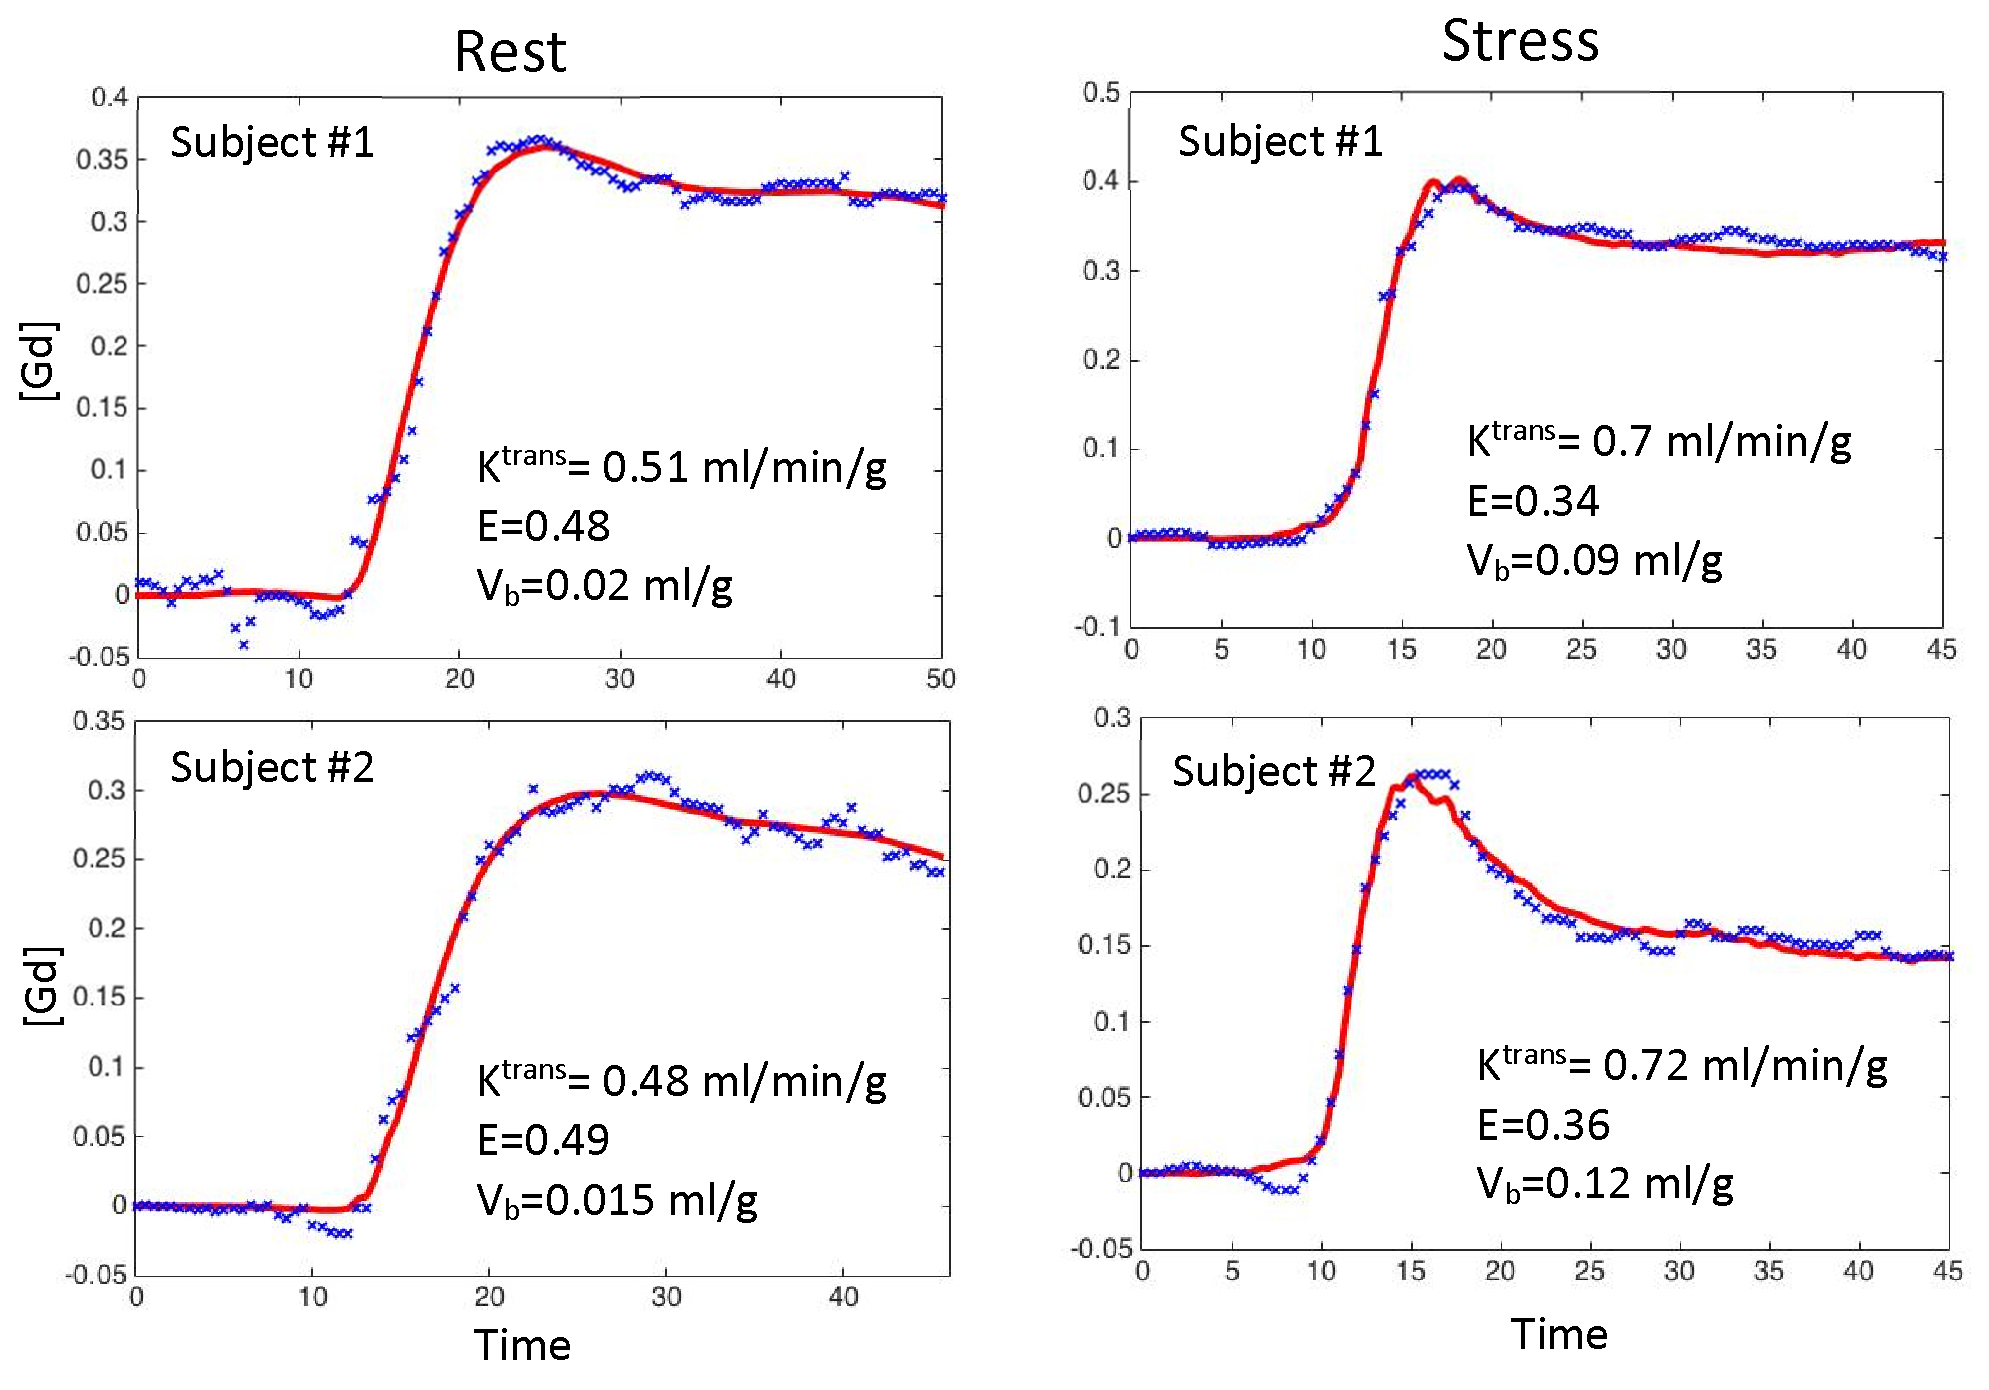
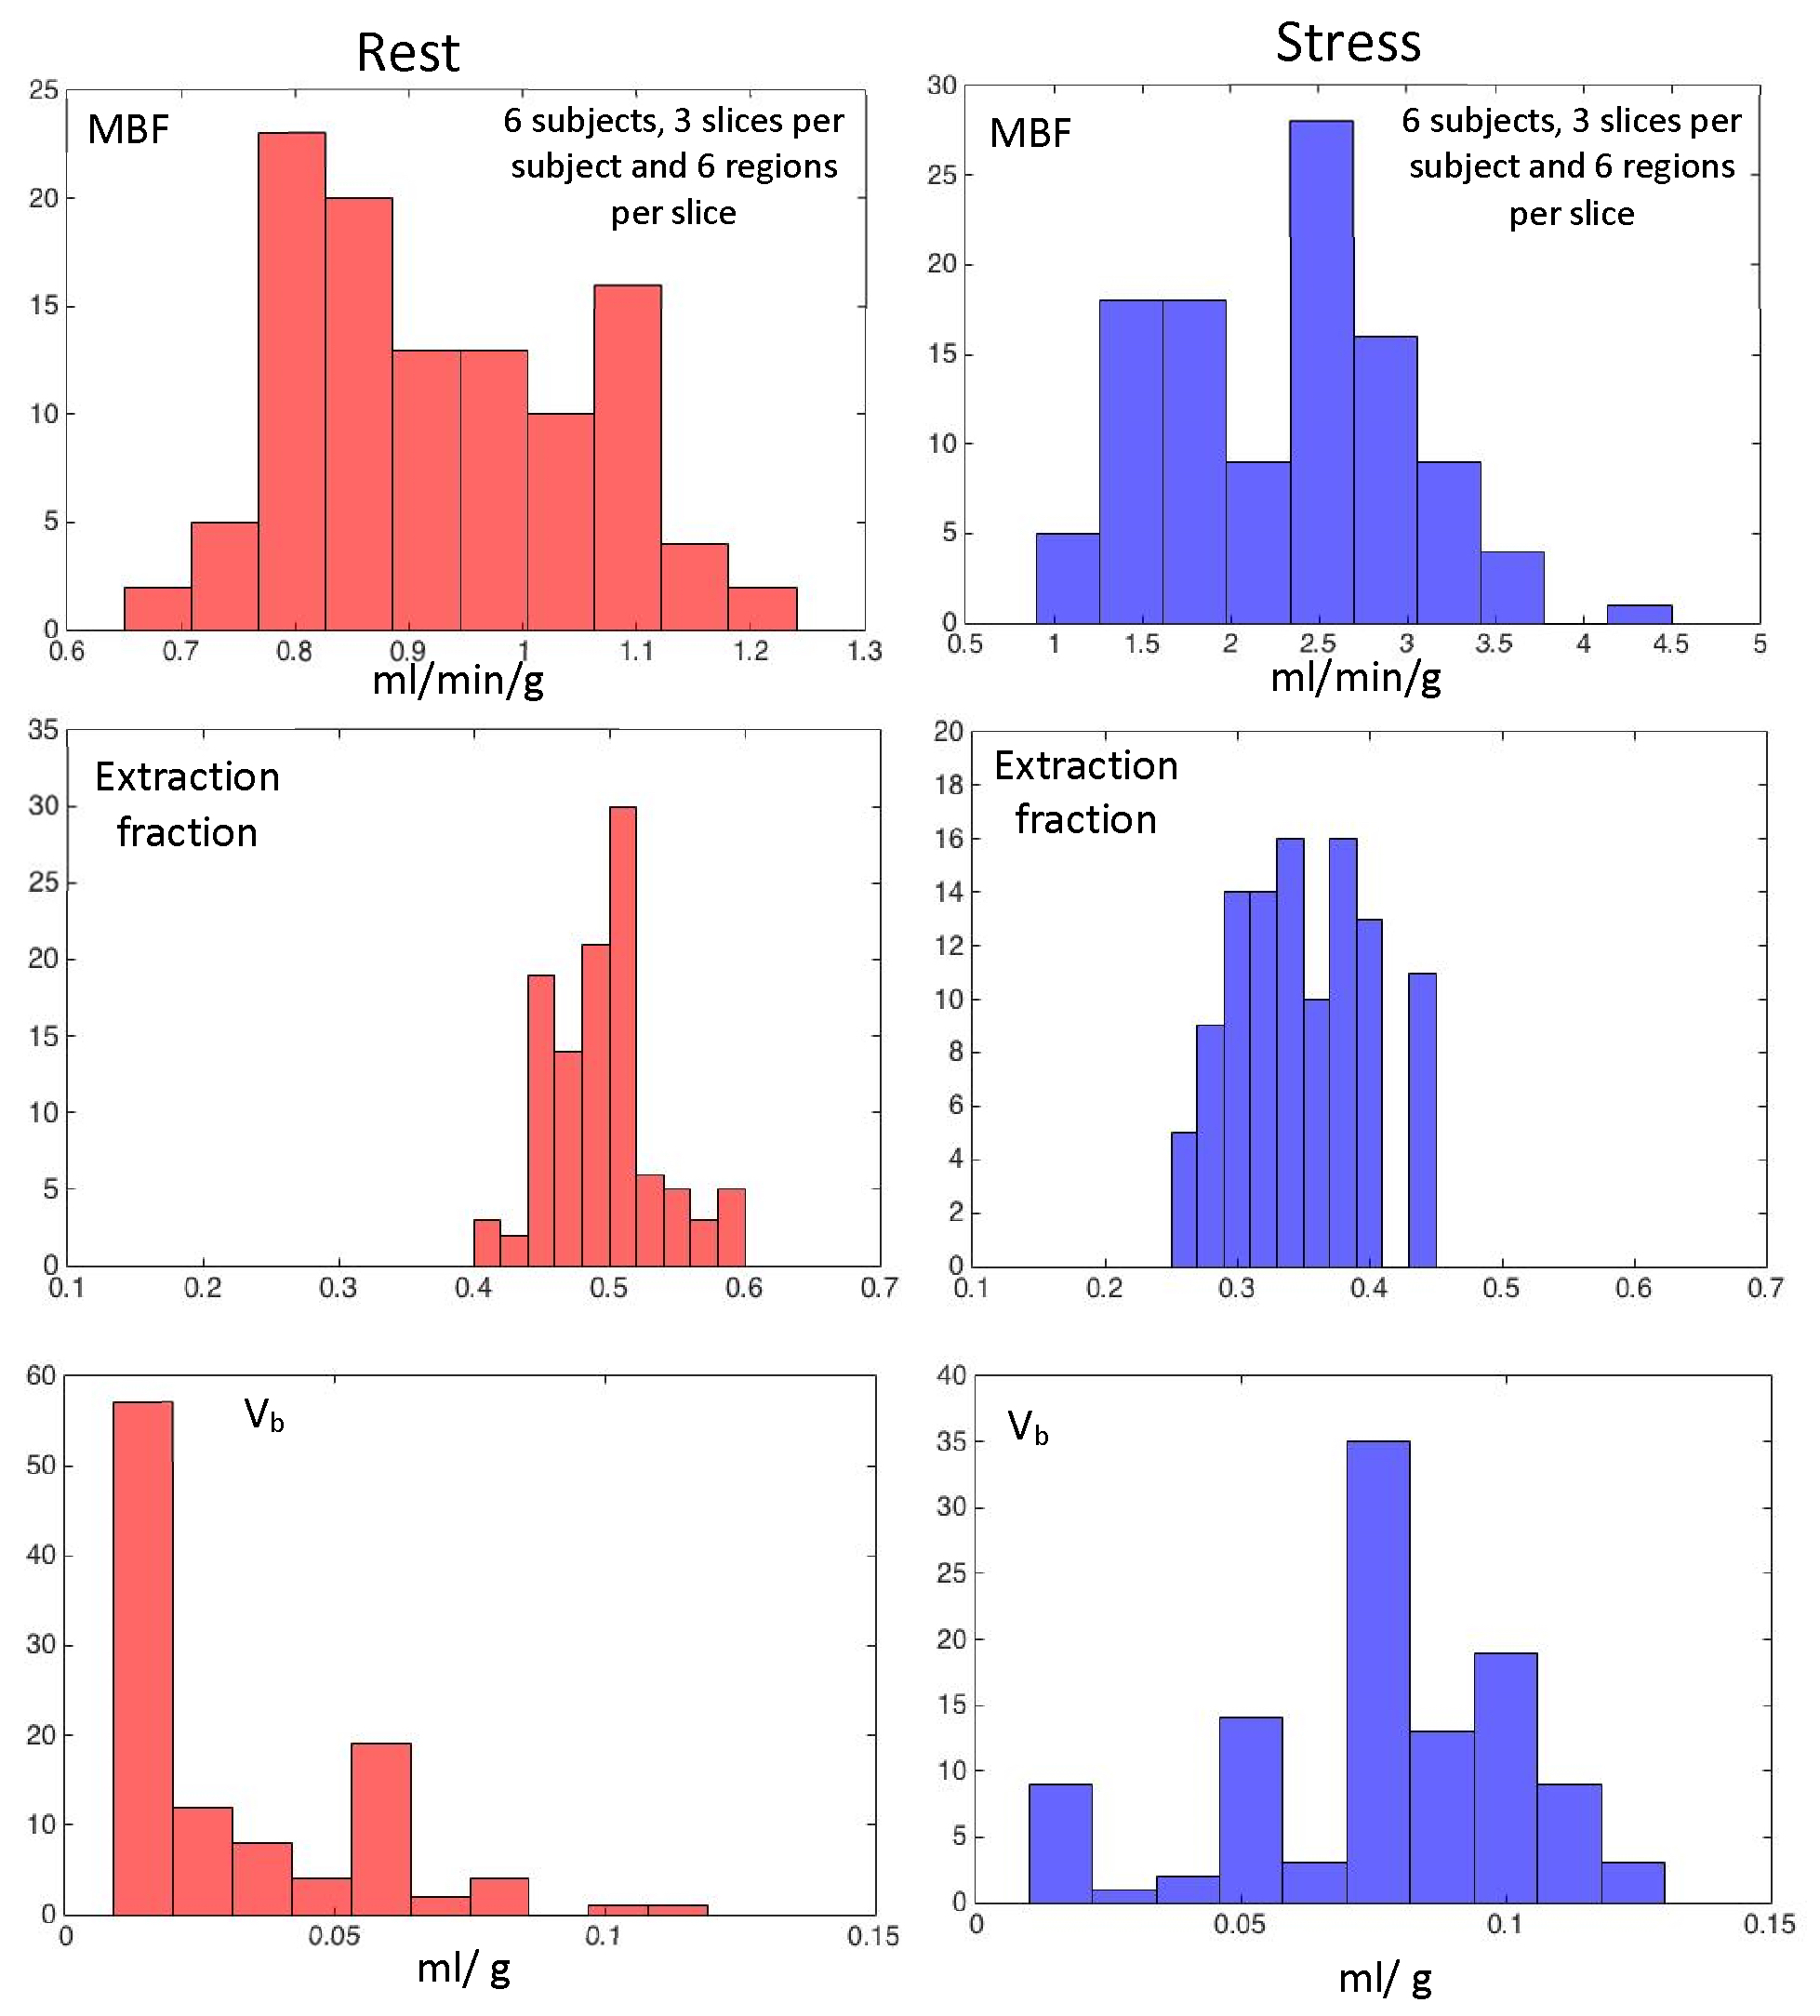
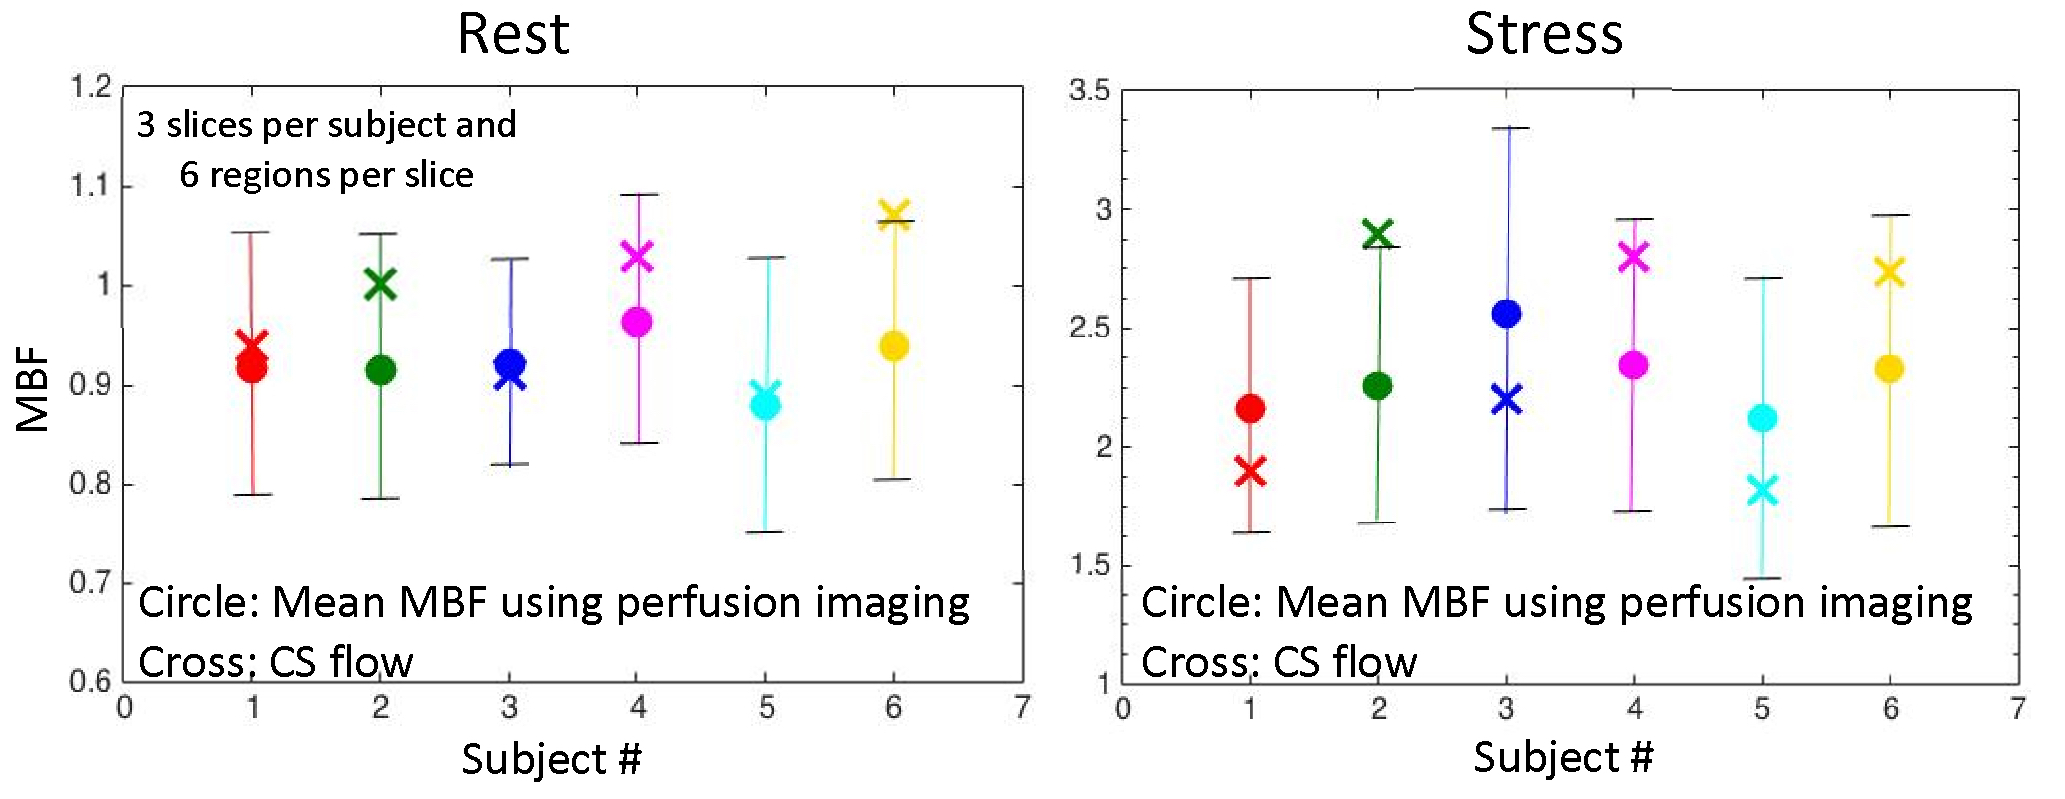
Figure 2 shows an example of model fit to recorded tissue curves in a single myocardial region for 2 subjects during rest and stress in this study. The MBF estimates during rest and stress were 0.9±0.1ml/min/g and 2.3±0.6ml/min/g respectively. The extraction fraction estimates were 0.49±0.04 and 0.34±0.05 during rest and stress respectively. These estimates of extraction fraction are comparable to those found by other researchers in human and canine myocardium [1,8,9].Figure 3 shows a histogram representing the distribution of the different perfusion parameter estimates using the 5-parameter model. Figure 4 shows a comparison of the global MBF estimates to the CS flows. It can be seen that the global MBF estimates match the CS flows.Discussion and conclusion
The current study has two subjects with myocardial infarct. Elevated ECV and reduced perfusion was seen in these subjects. A single ECV value per slice was used in this study. Further studies using a separate ECV estimate for infarcted and remote regions would help to improve understanding of the sensitivity of the model to ECV estimates. These results show that it is possible to estimate extraction fraction as a pharmacokinetic model parameter by combing the information available from T1 mapping and T1 weighted DCE MRI. This work is a good example of exploiting such information overlaps between various cardiac MR imaging techniques.Acknowledgements
No acknowledgement found.References
[1] Ishida, M., et al., Quantification of myocardial blood flow using model based analysis of first-pass perfusion MRI: extraction fraction of Gd-DTPA varies with myocardial blood flow in human myocardium. Magn Reson Med, 2011. 66(5): p. 1391-9.
[2] Fritz-Hansen, T., et al., Quantification of MRI measured myocardial perfusion reserve in healthy humans: a comparison with positron emission tomography. J Magn Reson Imaging, 2008. 27(4): p. 818-24.
[3] Adluru, G., et al., Acquisition and reconstruction of undersampled radial data for myocardial perfusion magnetic resonance imaging. J Magn Reson Imaging, 2009. 29(2): p. 466-73.
[4] Likhite, D., et al., Interstudy repeatability of self-gated quantitative myocardial perfusion MRI. J Magn Reson Imaging, 2016. 43(6): p. 1369-78.
[5] Tofts, P.S., Modeling tracer kinetics in dynamic Gd-DTPA MR imaging. J Magn Reson Imaging, 1997. 7(1): p. 91-101.
[6] Larsson, H.B., et al., Myocardial perfusion modeling using MRI. Magn Reson Med, 1996. 35(5): p. 716-26.
[7] Kramer, C.M., et al., Standardized cardiovascular magnetic resonance (CMR) protocols 2013 update. J Cardiovasc Magn Reson, 2013. 15: p. 91.
[8] Diesbourg, L.D., et al., Quantification of myocardial blood flow and extracellular volumes using a bolus injection of Gd-DTPA: kinetic modeling in canine ischemic disease. Magn Reson Med, 1992. 23(2): p. 239-53.
[9] Tong, C.Y., et al., Measurement of the extraction efficiency and distribution volume for Gd-DTPA in normal and diseased canine myocardium. Magn Reson Med, 1993. 30(3): p. 337-46.
Figures