3243
Quantitative 3D myocardial perfusion at systole and diastole with a dual echo arterial input function1Radiology and Imaging Sciences, University of Utah, Salt Lake City, UT, United States, 2Cardiovascular Magnetic Resonance Unit, Royal Brompton Hospital, London, United Kingdom, 3National Heart & Lung Institute, Imperial College London, London, United Kingdom, 4Cardiology, University of Utah, UT, United States
Synopsis
Quantitative 3D myocardial perfusion is a clinically realistic goal and this work further develops and combines several innovative sequence designs to achieve this goal. These developments include an optimized 3D stack of stars readout (150ms per beat), acquisition and T2* correction of an arterial input function, tailored saturation pulse design and potential whole heart coverage at both systole and diastole at heart rates up to 109 bpm. Implementation and quantitative perfusion results are shown for healthy volunteers and a patient with known coronary disease.
Purpose
While the feasibility of 2D quantitative cardiac perfusion has been established1-3 the increased coverage and slice resolution of 3D methods aid in identifying ischemic burden, increase confidence that any defects have been identified, and may offer improved handling of respiratory motion4. However, reduced clinical utility of 3D methods5 has been observed because the increased acquisition time of 3D data typically requires a decrease in spatial resolution. In addition, a measured Arterial Input Function (AIF)6-7 with T2* correction of the AIF to reduce the over estimation of myocardial blood flow8 , and quantification of blood flow at different cardiac phases9 would provide further diagnostic benefit and make 3D cardiac perfusion more clinically viable. Free-breathing acquisition would also make the studies easier to perform. The combination of all these concepts is further complicated by the fact that perfusion is often required during a stressed state where heart rates exceed 100bpm. Consequently, only a limited number of 3D perfusion studies have been reported10-13 with none addressing all the problems and concepts discussed above. This work demonstrates the feasibility of free-breathing 3D perfusion (at systole and diastole) with a measured and T2* corrected AIF.Methods
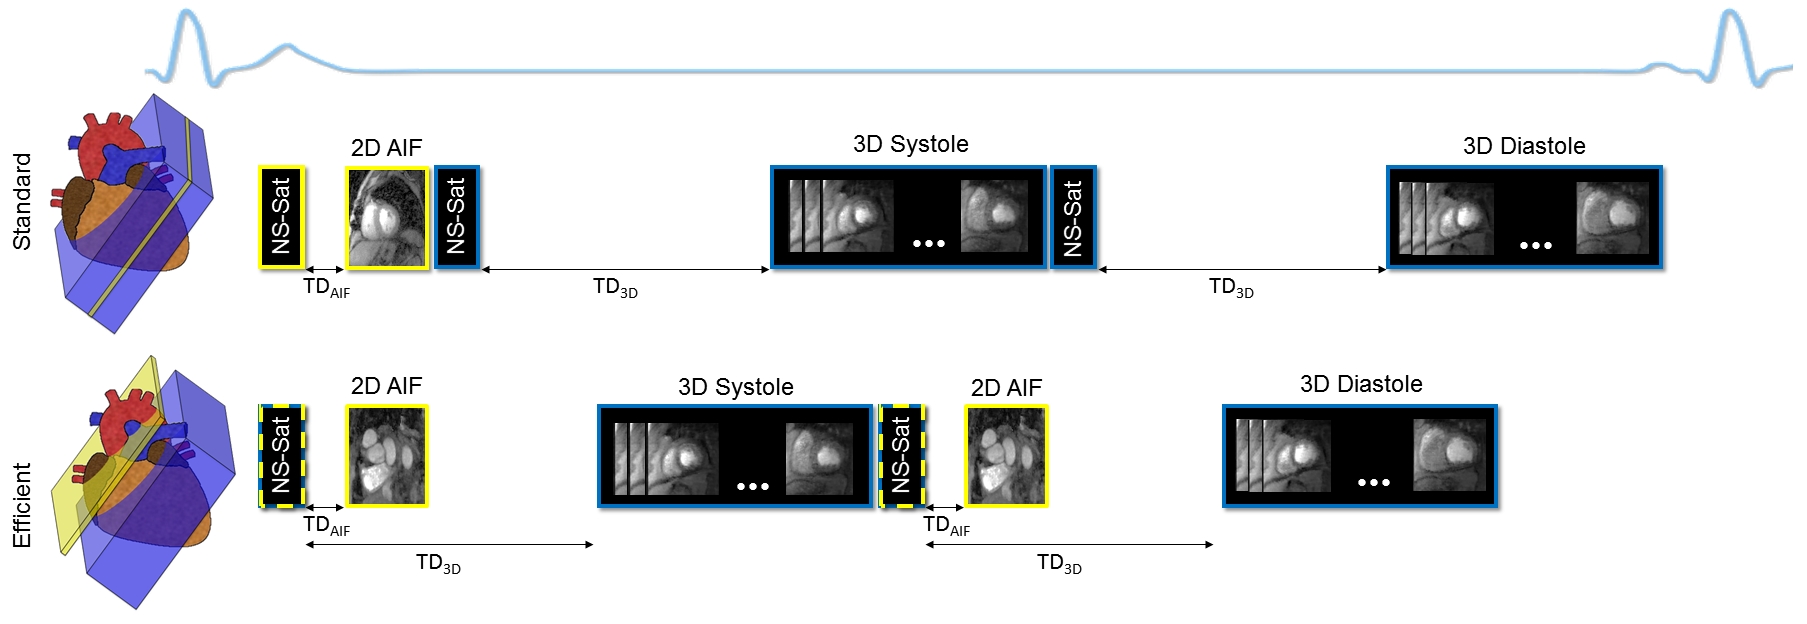
All studies were performed on a Siemens Prisma 3T MRI scanner. Data was acquired with an ECG gated/free breathing hybrid sequence (2D radial AIF combined with 3D radial stack of stars). For 3D, the resolution was 1.8mm x 1.8mm x 5mm, 8 partitions, TE/TR=0.77/1.54ms, 98 rays per beat (25 in the central partition) and a total readout time of 150ms (325ms including the 6 RF saturation pulses14 and a 150ms saturation recovery time (SRT)). The 2D AIF data was acquired with a resolution of 1.8mm x 1.8mm x 8mm, 20 rays per beat and TE1/TE2/TR=0.99/1.87/2.75ms for a total readout time of 55ms (99ms including the saturation block and a 20ms SRT). The total time per beat for the AIF and both systolic and diastolic 3D data sets (Figure 1a) is 750ms (80bpm) and is sufficient for most rest perfusion studies. However, a more efficient technique (Figure 1b) can embed the AIF acquisition into the 3D perfusion SRT time resulting in a total time of just over 650ms (92 bpm) and is more appropriate for stress studies. For even higher heart rates, using a 3D perfusion SRT of 100ms allows acquisition up to 109bpm. Data was reconstructed using a joint multi-slice and multi-coil algorithm with temporal1 and spatial15 total variation constraints, and processed with Matlab software16 to obtain quantitative perfusion values. Systolic and diastolic 3D perfusion data were acquired in 10 subjects (53±19 years) with 0.075 mmol/kg of ProHance (gadoteridol, Bracco Diagnostics) injected at 5 ml/s with a 20ml saline flush.Results and Discussion
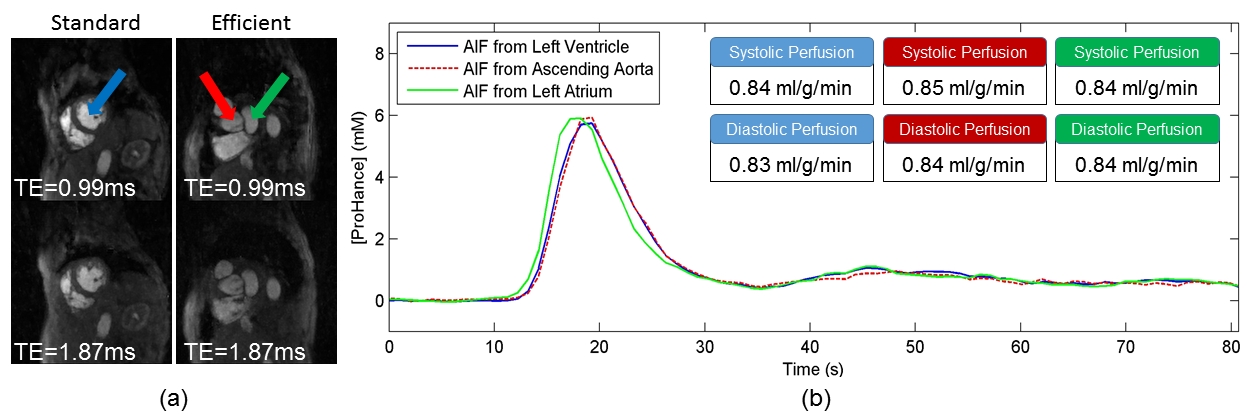
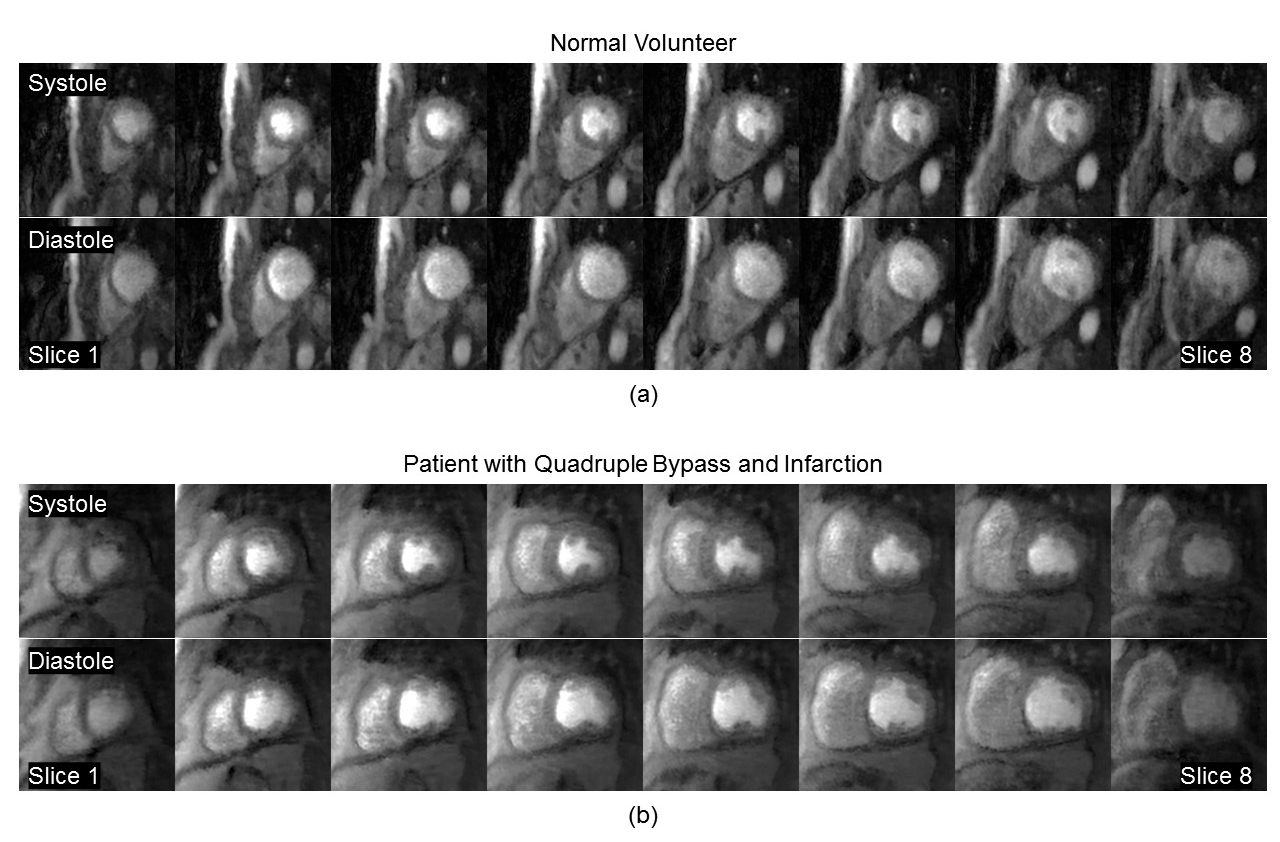
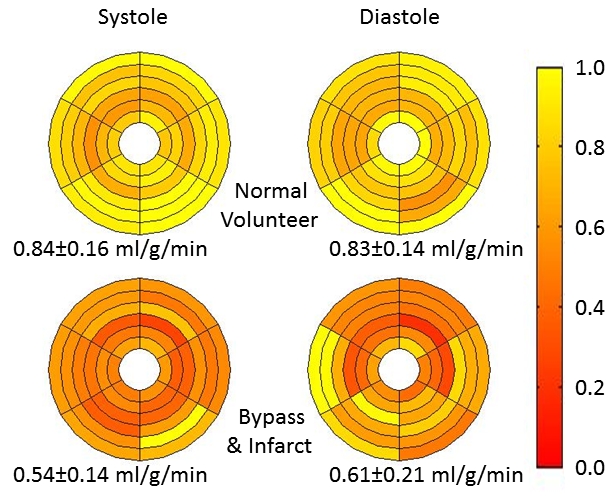
The efficient AIF method (Figure 1) does not measure the AIF in the same volume as the 3D perfusion but rather in an adjacent basal slice. For validation purposes, the AIF was acquired both within the 3D perfusion volume and in the basal slice during the same injection (Figure 2). Each AIF was acquired at two echo times to allow proper T2* correction (Figure 2a). The basal AIFs agree well with the standard AIF with the bolus arriving slightly sooner in the left atrium as expected. Perfusion was quantified in the 3D volume for this subject using each AIF (Figure 2b) with good agreement between the standard and efficient methods. Source images at both systole and diastole (at the beginning of myocardial enhancement) for a normal volunteer and a patient with quadruple bypass surgery and a known infarct are shown in Figure 3. The quantified mean blood flow for the inner 6 slices are summarized by the bull’s eye plots in Figure 4.Conclusion
We have demonstrated the feasibility of performing quantitative 3D perfusion at systole and diastole with heart rates up to 109 bpm. We have confirmed that even at these high heart rates, it is possible to acquire a measured and T2* corrected AIF. Initial perfusion values are consistent with those published in literature.Acknowledgements
No acknowledgement found.References
1. Adluru G, McGann C, Speier P, Kholmovski EG, Shaaban A, Dibella EVR. Acquisition and reconstruction of undersampled radial data for myocardial perfusion magnetic resonance imaging. J Magn Reson Imaging 2009;29:466-473.
2. Schwitter J, Wacker CM, Wilke N, Al-Saadi N, Sauer E, Huettle K, Schönberg SO, Debl K, Strohm O, Ahlstrom H, Dill T, Hoebel N, Simor T. Superior diagnostic performance of perfusion-cardiovascular magnetic resonance versus SPECT to detect coronary artery disease: The secondary endpoints of the multicenter multivendor MR-IMPACT II (Magnetic Resonance Imaging for Myocardial Perfusion Assessment in Coronary Artery Disease Trial). J Cardiovasc Magn Reson 2012;14:61.
3. Greenwood JP, Maredia N, Younger JF, Brown JM, Nixon J, Everett CC, Bijsterveld P, Ridgway JP, Radjenovic A, Dickinson CJ, Ball SG, Plein S. Cardiovascular magnetic resonance and single-photon emission computed tomography for diagnosis of coronary heart disease (CE-MARC): a prospective trial. Lancet 2012;379:453-460.
4. Fair MJ, Gatehouse PD, DiBella EVR, Firmin DN. A review of 3D first-pass, whole-heart, myocardial perfusion cardiovascular magnetic resonance. J Cardiovasc Magn Reson 2015;17:68.
5. Motwani M, Jogiya R, Kozerke S, Greenwood JP, Plein S. Advanced cardiovascular magnetic resonance myocardial perfusion imaging high-spatial resolution versus 3-dimensional whole-heart coverage. Circ Cardiovasc Imaging. 2013;6:339–48.
6. Port RE, Knopp MV, Brix G. Dynamic contrast-enhanced MRI using Gd-DTPA: interindividual variability of the arterial input function and consequences for the assessment of kinetics in tumors. Magn Reson Med 2001;45:1030-1038.
7. Fritz-Hansen T, Rostrup E, Larsson HB, Søndergaard L, Ring P, Henriksen O. Measurement of the arterial concentration of Gd-DTPA using MRI: a step toward quantitative perfusion imaging. Magn Reson Med 1996;36:225-231.
8. Xue H, Hansen MS, Nielles-Vallespin S, Arai AE, Kellman P. Correcting T2* effects in the myocardial perfusion arterial input function avoids overestimation of myocardial blood flow. J Cardiovasc Magn Reson 2016;18 (Suppl 1):Q14
9. Motwani M, Kidambi A, Uddin A, Sourbron S, Greenwood JP, Plein S.Quantification of myocardial blood flow with cardiovascular magneticresonance throughout the cardiac cycle. J Cardiovasc Magn Reson 2015;17:
10. Manka R, Wissmann L, Gebker R, Jogiya R, Motwani M, Frick M, Reinartz S, Schnackenburg B, Niemann M, Gotschy A, Kuhl C, Nagel E, Fleck E, Marx N, Luescher TF, Plein S, Kozerke S. Multicenter evaluation of dynamic three-dimensional magnetic resonance myocardial perfusion imaging for the detection of coronary artery disease defined by fractional flow reserve. Circ Cardiovasc Imaging 2015;8:.
11. Motwani M, Kidambi A, Sourbron S, Fairbairn TA, Uddin A, Kozerke S, Greenwood JP, Plein S. Quantitative three-dimensional cardiovascular magnetic resonance myocardial perfusion imaging in systole and diastole. J Cardiovasc Magn Reson 2014;16:19.
12. Chen L, Adluru G, Schabel MC, McGann CJ, Dibella EVR. Myocardial perfusion MRI with an undersampled 3D stack-of-stars sequence. Med Phys 2012;39:5204-5211.
13. Wissmann L, Niemann M, Gotschy A, Manka R, Kozerke S. Quantitative three-dimensional myocardial perfusion cardiovascular magnetic resonance with accurate two-dimensional arterial input function assessment. J Cardiovasc Magn Reson 2015;17:108.
14. Chow K, Kellman P, Spottiswoode BS, Nielles-Vallespin S, Arai AE, Salerno M, Thompson RB. Saturation pulse design for quantitative myocardial T1 mapping. J Cardiovasc Magn Reson 2015;17:84.
15. Adluru G, Chen L, Kim SE, Burgon N, Kholmovski EG, Marrouche NF, Dibella EV (2011). Three-dimensional late gadolinium enhancement imaging of the left atrium with a hybrid radial acquisition and compressed sensing. J Magn Reson Imaging 2011;34:1465-71.
16. Pack NA, Vijayakumar S, Kim TH, McGann CJ, DiBella EVR. A Semi-Automatic Software Package for Analysis of Dynamic Contrast-Enhanced MRI Myocardial Perfusion Studies. Available from: https://www.researchgate.net/publication/224130411_A_Semi-Automatic_Software_Package_for_Analysis_of_Dynamic_Contrast-Enhanced_MRI_Myocardial_Perfusion_Studies. Computers in Cardiology 2009;269-272.
Figures