3238
Quantitative dynamic MRI in the phase domain: Characterization of coronary arterial morphology using a simple Fourier method to accurately estimate bolus arrival times in DCE-MRI perfusion imaging1Nuclear Medicine, TU Munich, Munich, Germany, 2Cardiology, TU Munich, Munich, Germany
Synopsis
This abstract proposes a simple method to extract the bolus arrival time (BAT) from myocardial DCE-MRI perfusion data using a low-frequency phase reconstruction of the deconvolution of arterial input functions with myocardial tissue curves. A simulation study is performed to test the proposed technique with respect to accuracy, robustness and superiority to existing approaches. A clinical PET/MRI example and a control group are examined to show the robustness of BAT estimation even without post-processing steps like surface coil intensity correction or saturation correction. The interpretation of the BAT as a surrogate for coronary path lengths is supported by coronary angiography.
Background
A major confounder to absolute quantification of myocardial plasma/blood flow (Fp/Fb) using dynamic perfusion MRI as compared to e.g. PET is the lack of simple relationships between image signal and physiologically meaningful quantities. User-interaction and post-processing complexity for e.g. maintaining linear signal-to-contrast agent relationships1 are important obstacles for robustness and clinical applicability of quantitative DCE-MRI. It is the goal of this work to show the potential of parameters such as the bolus arrival time (BAT) that can be quantified with minimal amounts of post-processing, as they depend only on the phase information within dynamic MRI data. While the BAT is needed for DCE-MRI deconvolution modeling, it can also be used directly as a surrogate for the path length of blood through the coronary vasculature. Especially in the context of PET/MRI, this abstract proposes an understanding of PET as inherently quantitative in the magnitude domain and dynamic MRI with its superior time resolution as inherently quantitative in the phase domain.Methods
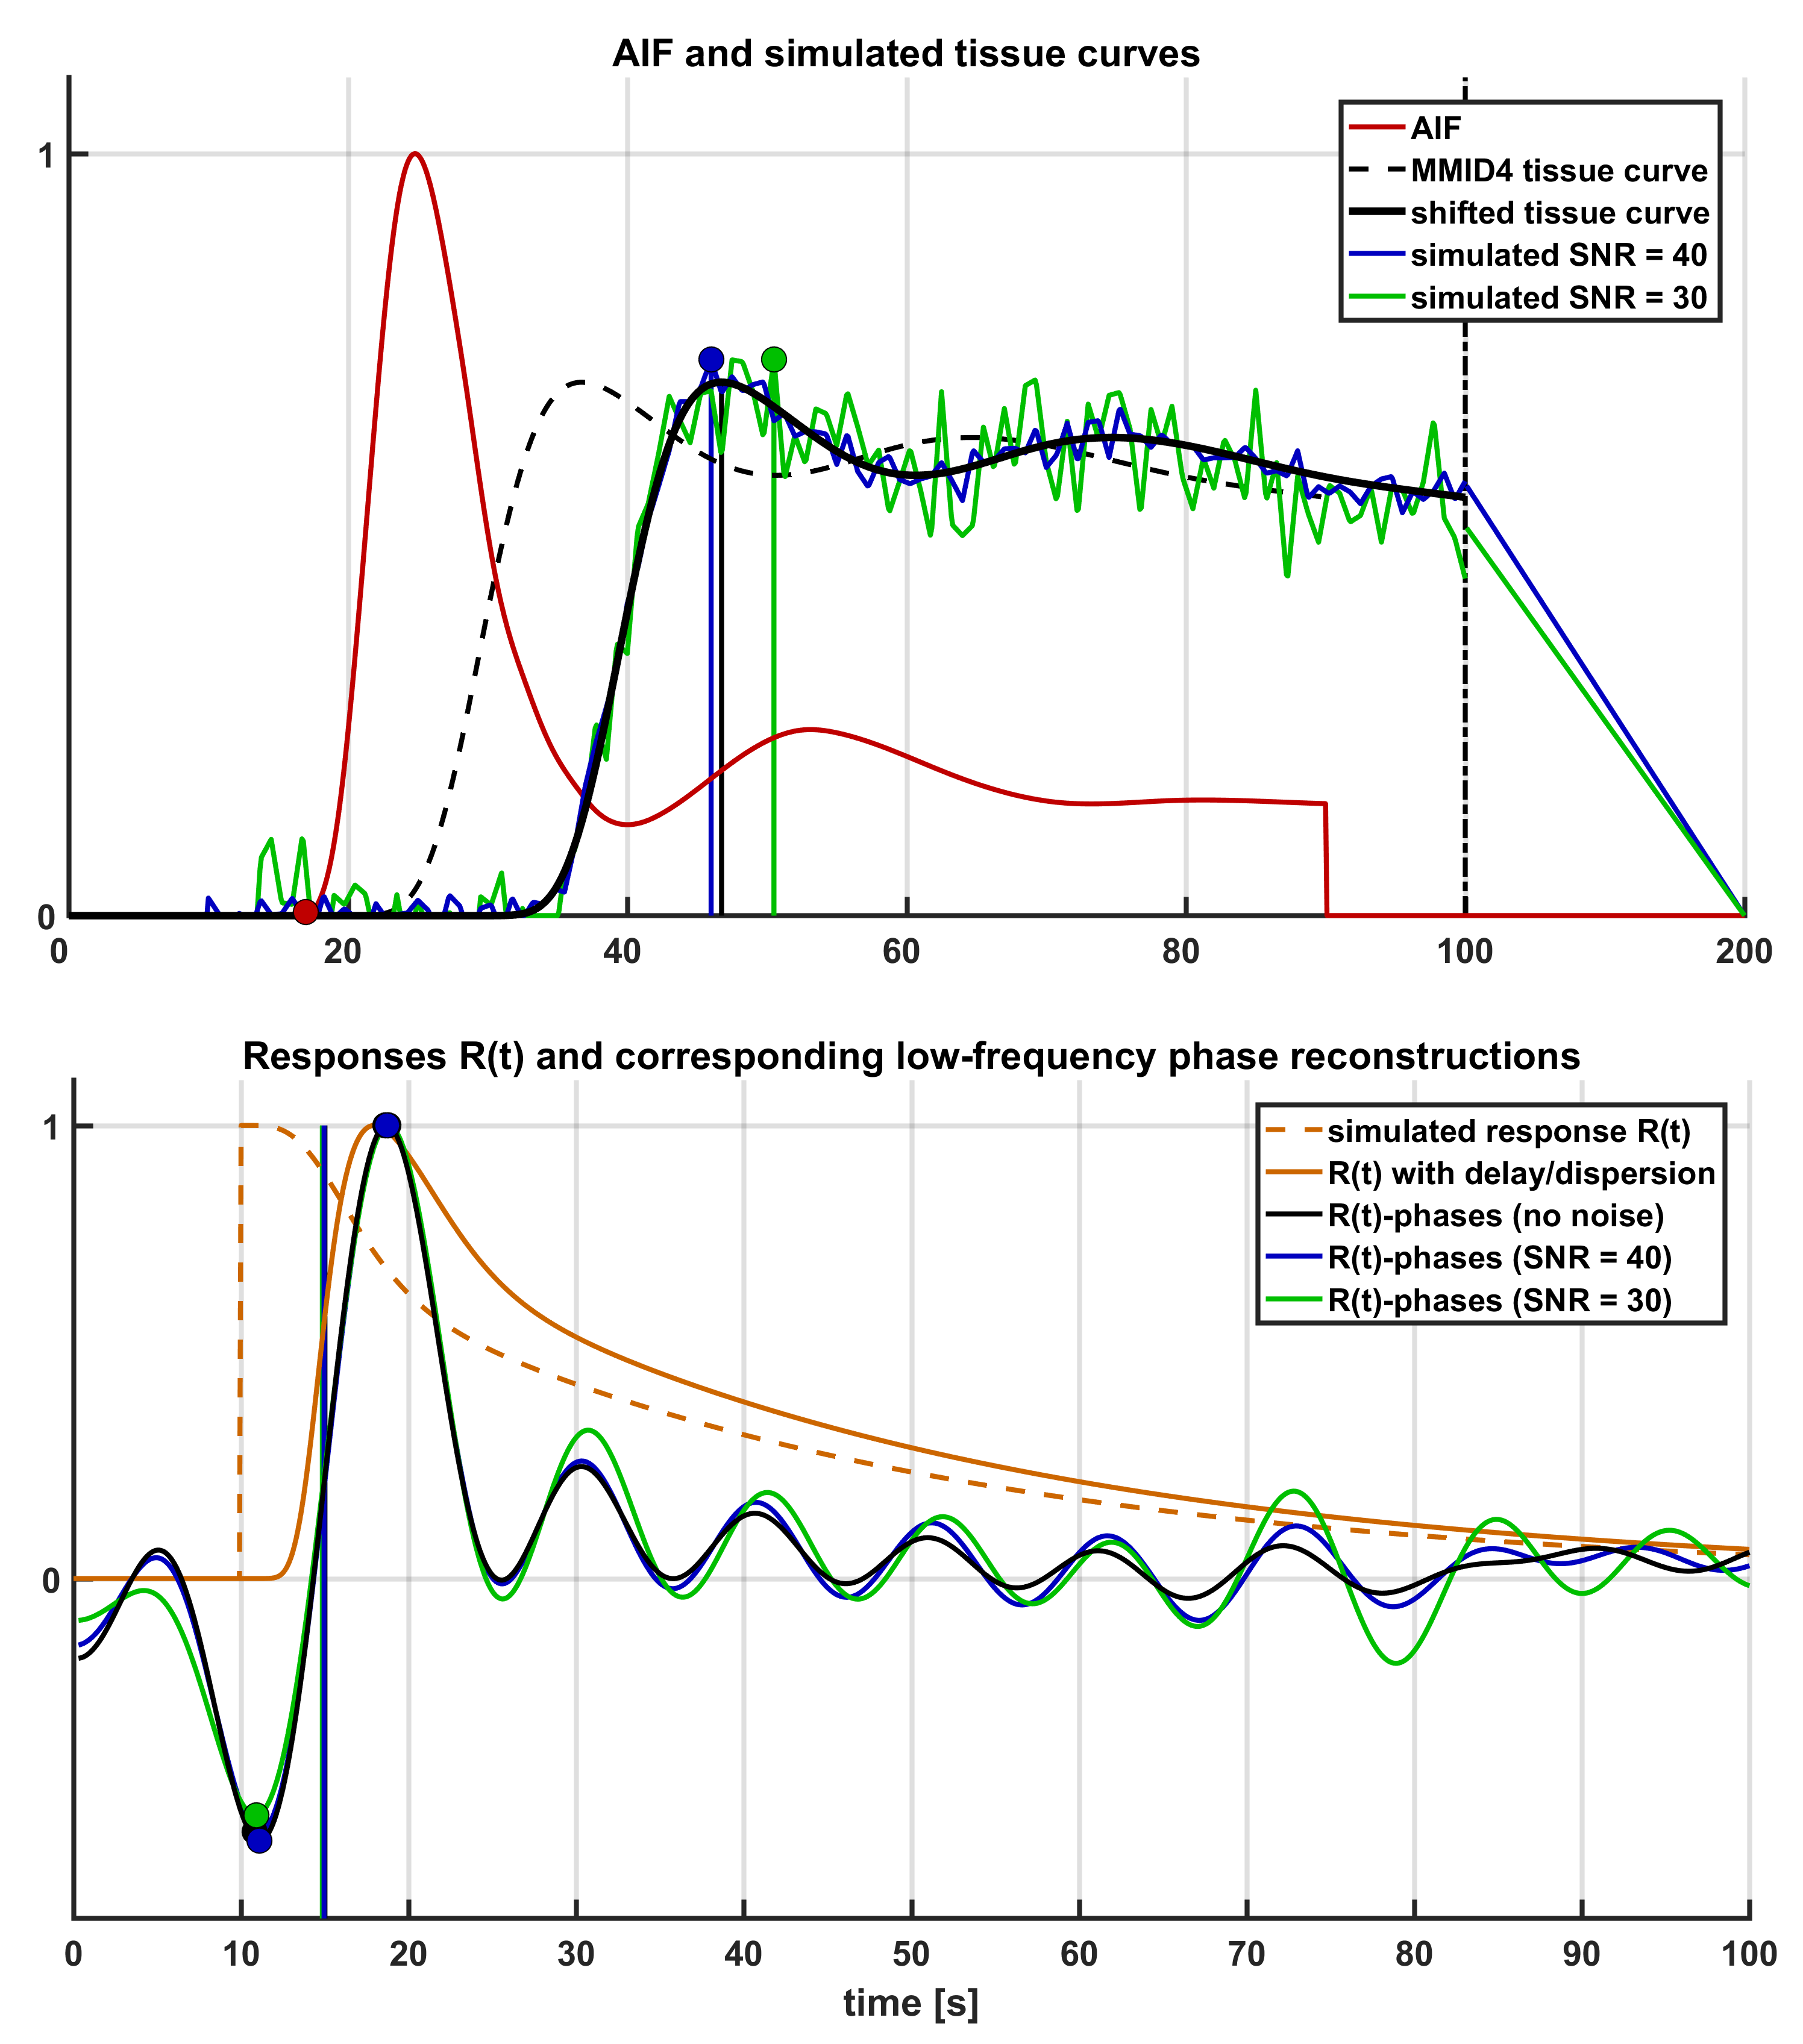
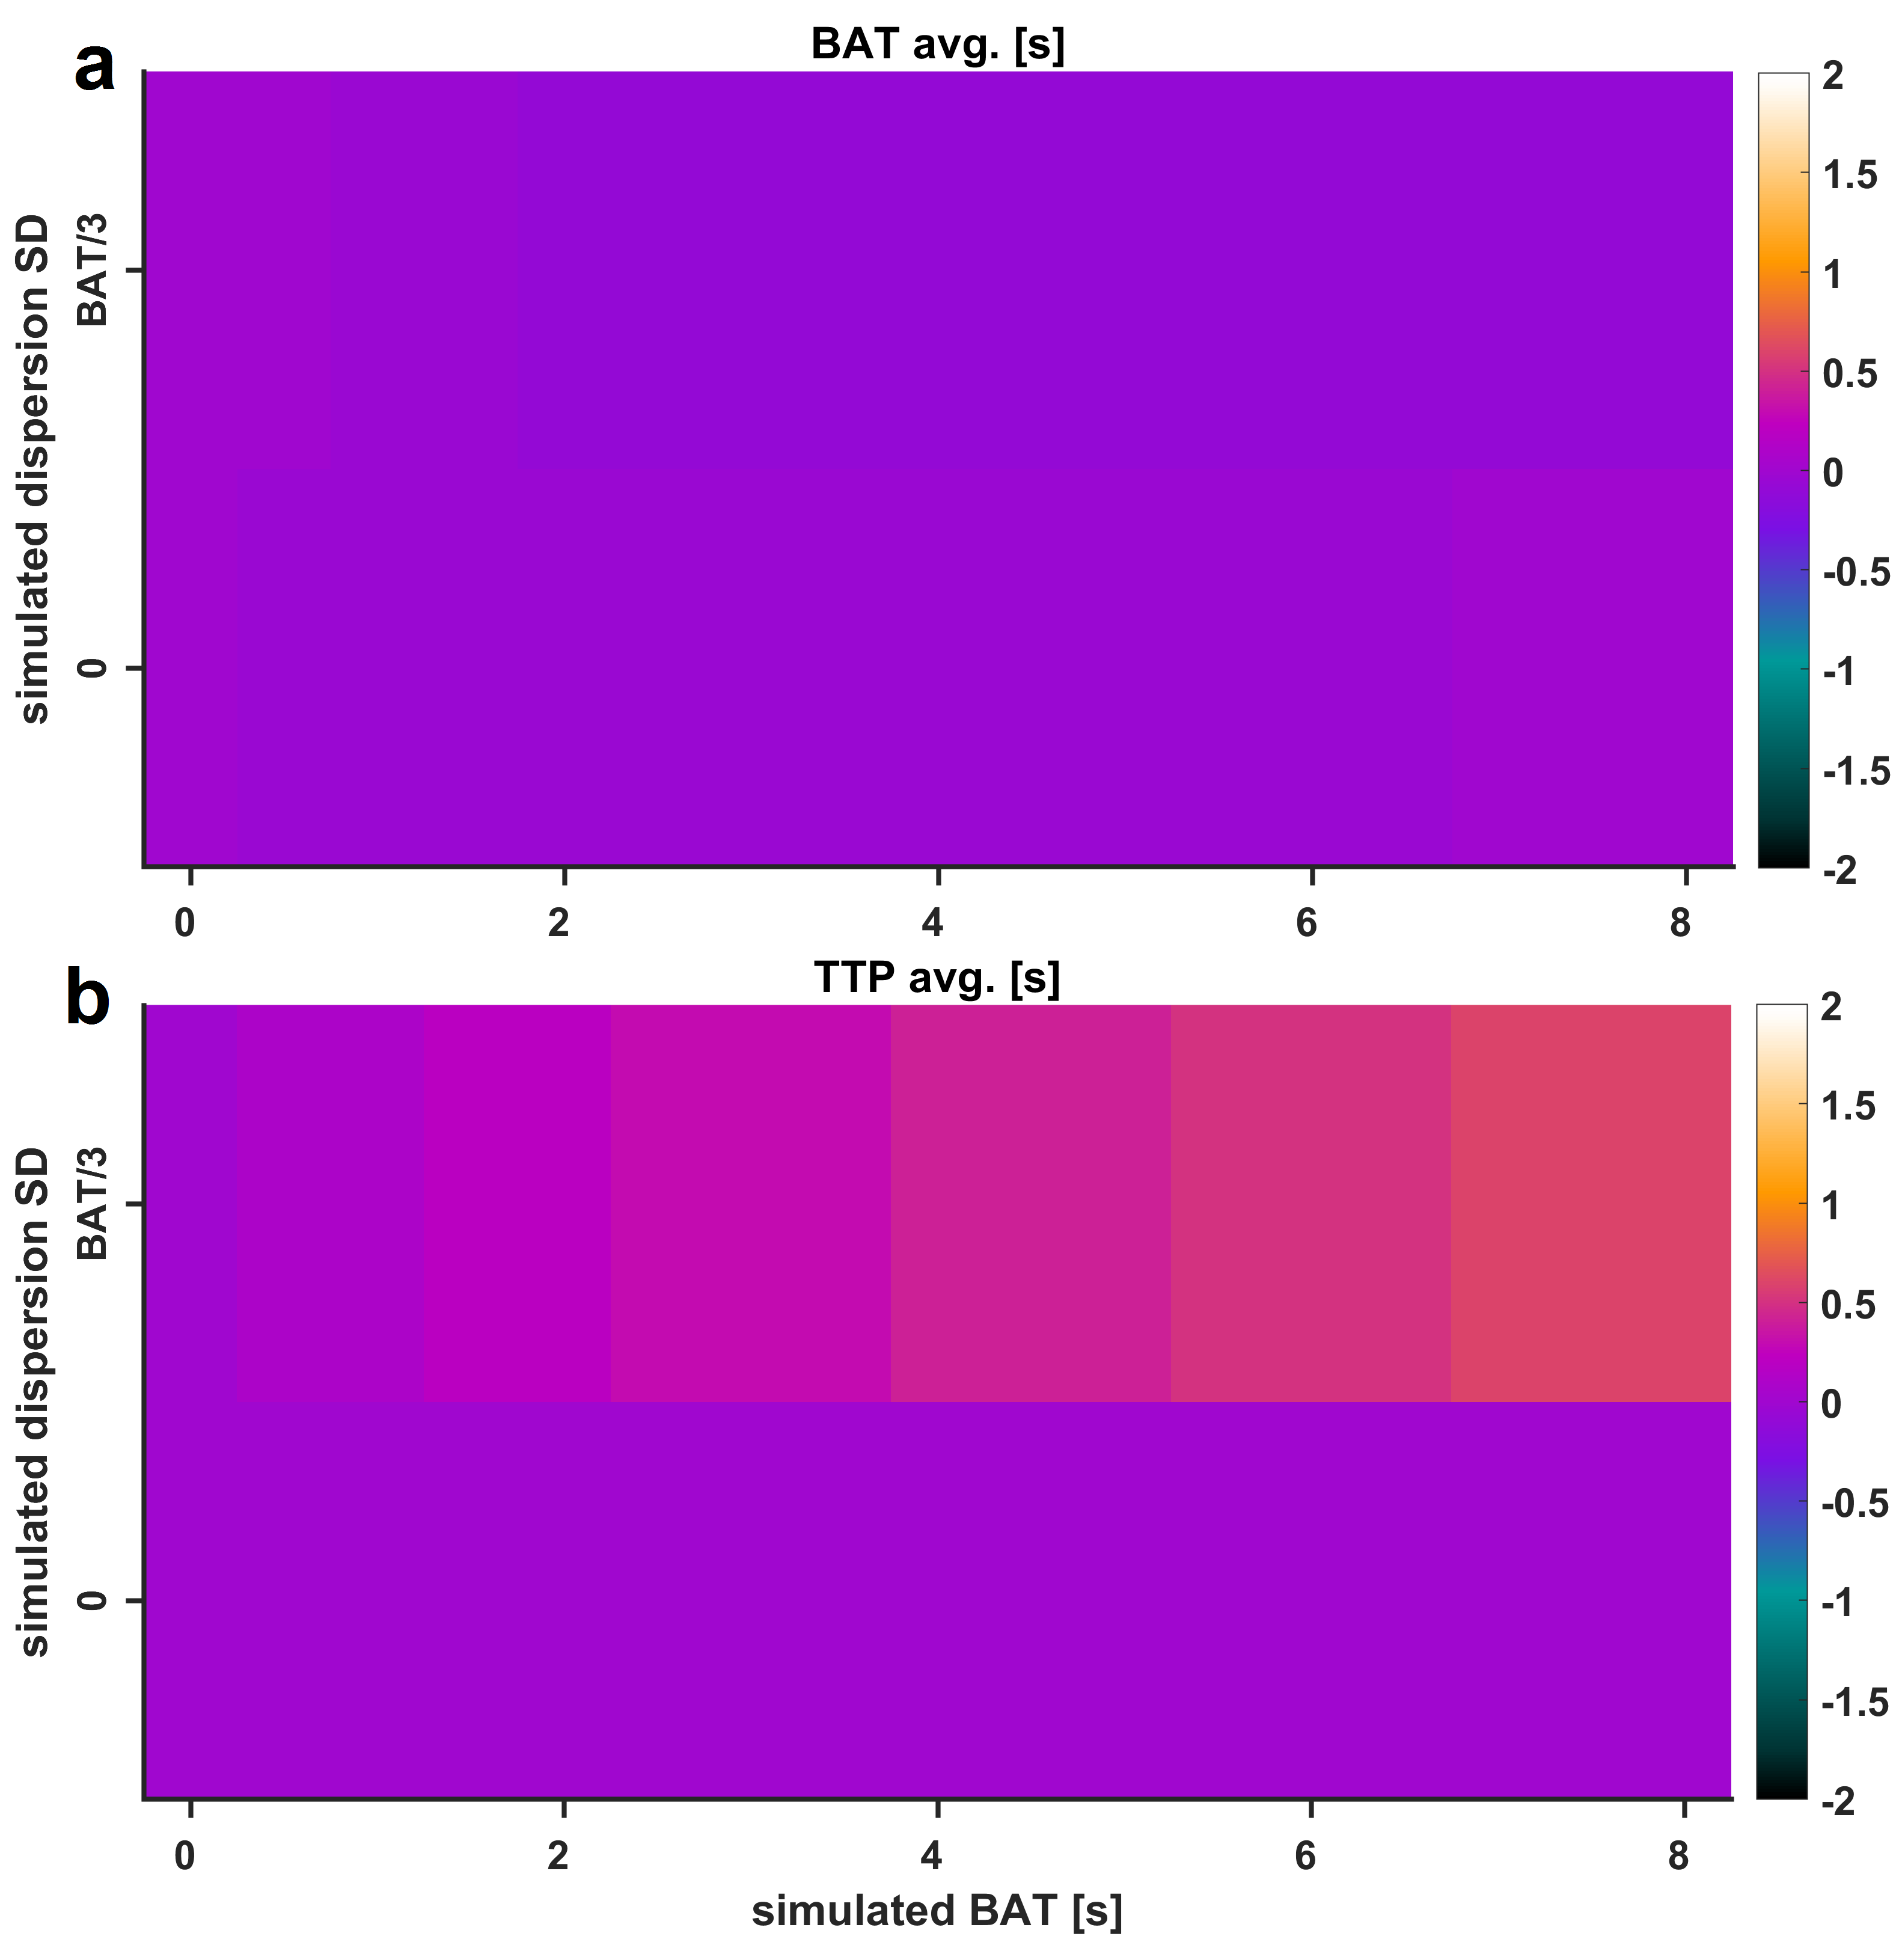
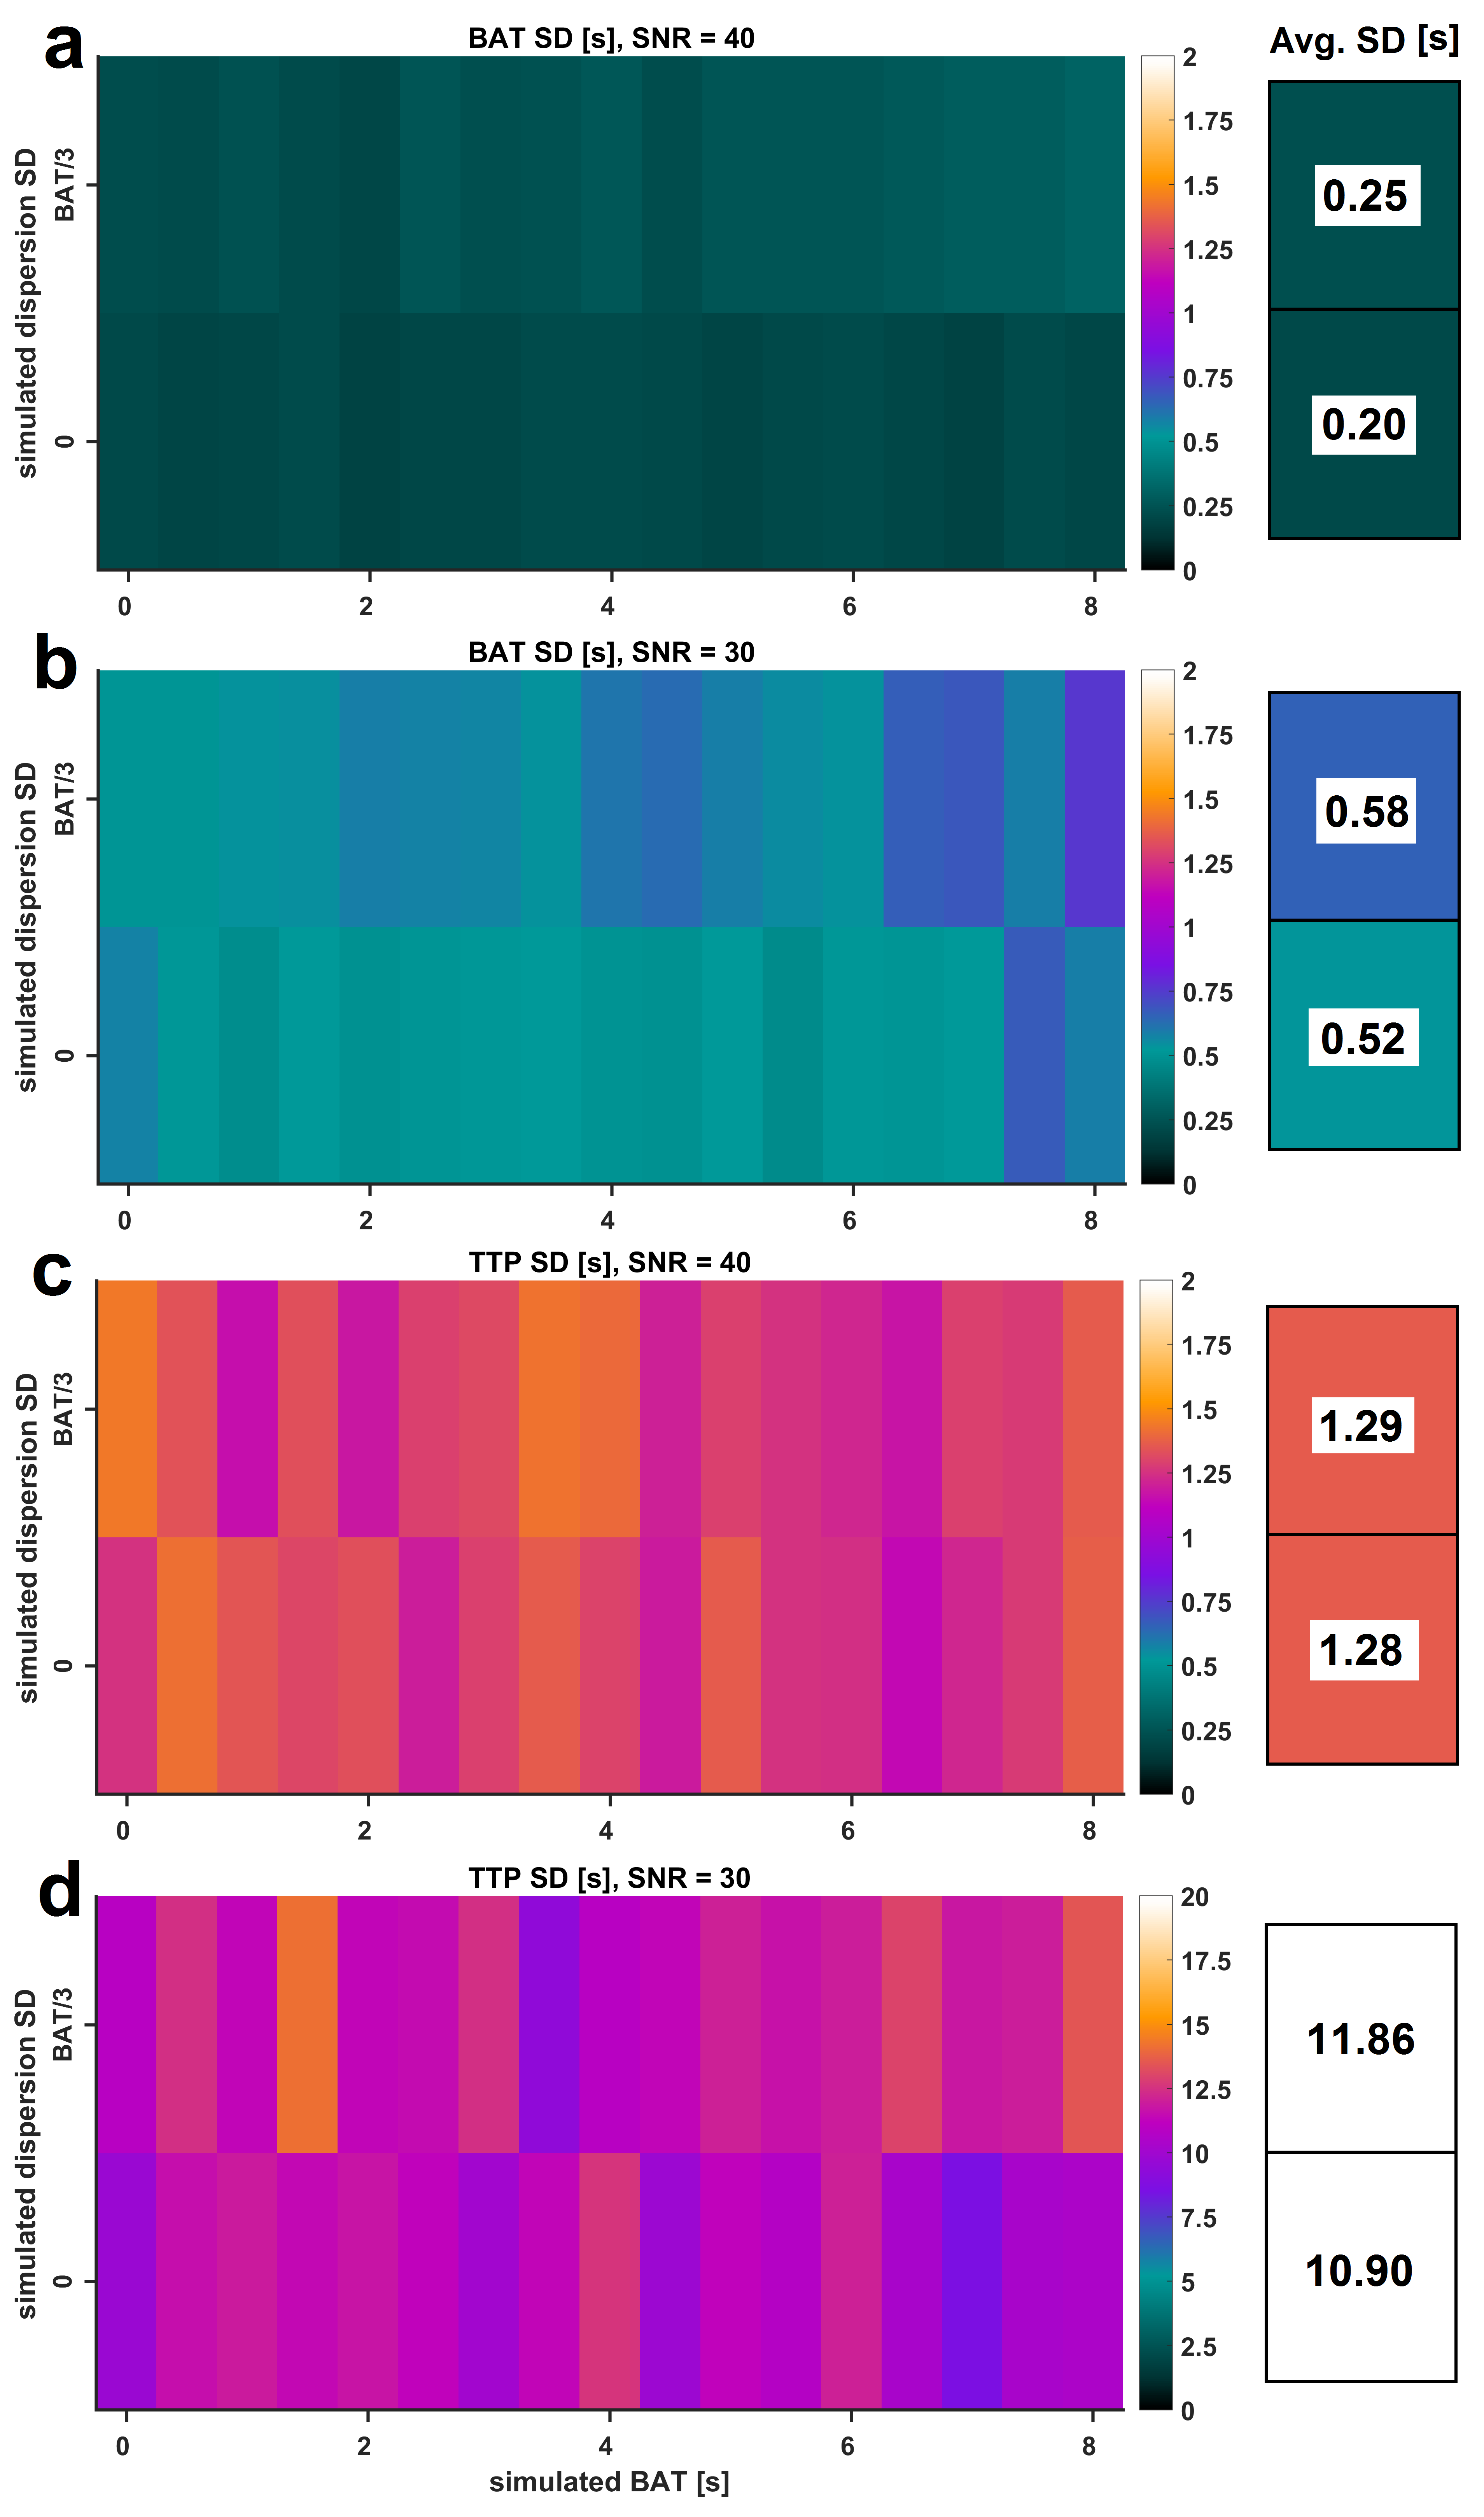
A new technique is introduced to estimate bolus delay using the low-frequency phase spectrum of a direct Fourier deconvolution of AIF and tissue curve: First, the tissue curve is padded to double length with a (linearly) decreasing tail to avoid discontinuity effects and shifted a further 10s from the AIF for stability. Both curves are subsequently Fourier transformed and directly deconvolved, i.e. divided in Fourier space. In order to exclude high-frequency noise amplification, the resulting deconvolved phase spectrum is zero-padded for frequencies >0.1 Hz. An inverse Fourier transform of the padded phase spectrum with all magnitudes set to unity results in a low-frequency phase reconstruction of the convolution kernel, i.e. the impulse response R(t). The bolus arrival time can be calculated from its main oscillation by subtracting positive and negative peak position (Fig. 1). A simulation study was performed testing accuracy, precision and superiority to similar approaches such as Time-To-Peak (TTP) analysis: Therefore, the blood-tissue exchange unit of the MMID4 model was used to create a reference tissue curve, which was convolved with a γ-variate kernel to simulate different BATs with and without dispersion. 100 iterations across a simulated BAT range of 0-8s were performed at SNR=40 (regional curves), SNR=30 (single-voxel curves) and without the addition of noise to detect potential biases. In order to provide an in-vivo proof of concept, four subjects without known cardiac disease and one patient with an LAD main branch chronic total occlusion (CTO) were scanned on a 3T PET/MRI scanner (Biograph mMR, Siemens, Erlangen). MRI imaging was performed using a 2D SR-FLASH sequence as described previously.2 The CTO patient received a simultaneous 18F-FDG PET scan to test for myocardial viability. Assessing the argument of post-processing simplicity, the motion corrected in-vivo data were evaluated once with surface coil intensity correction (SCIC) and full nonlinearity correction based on T1-mapping1 and once without any additional post processing.Results
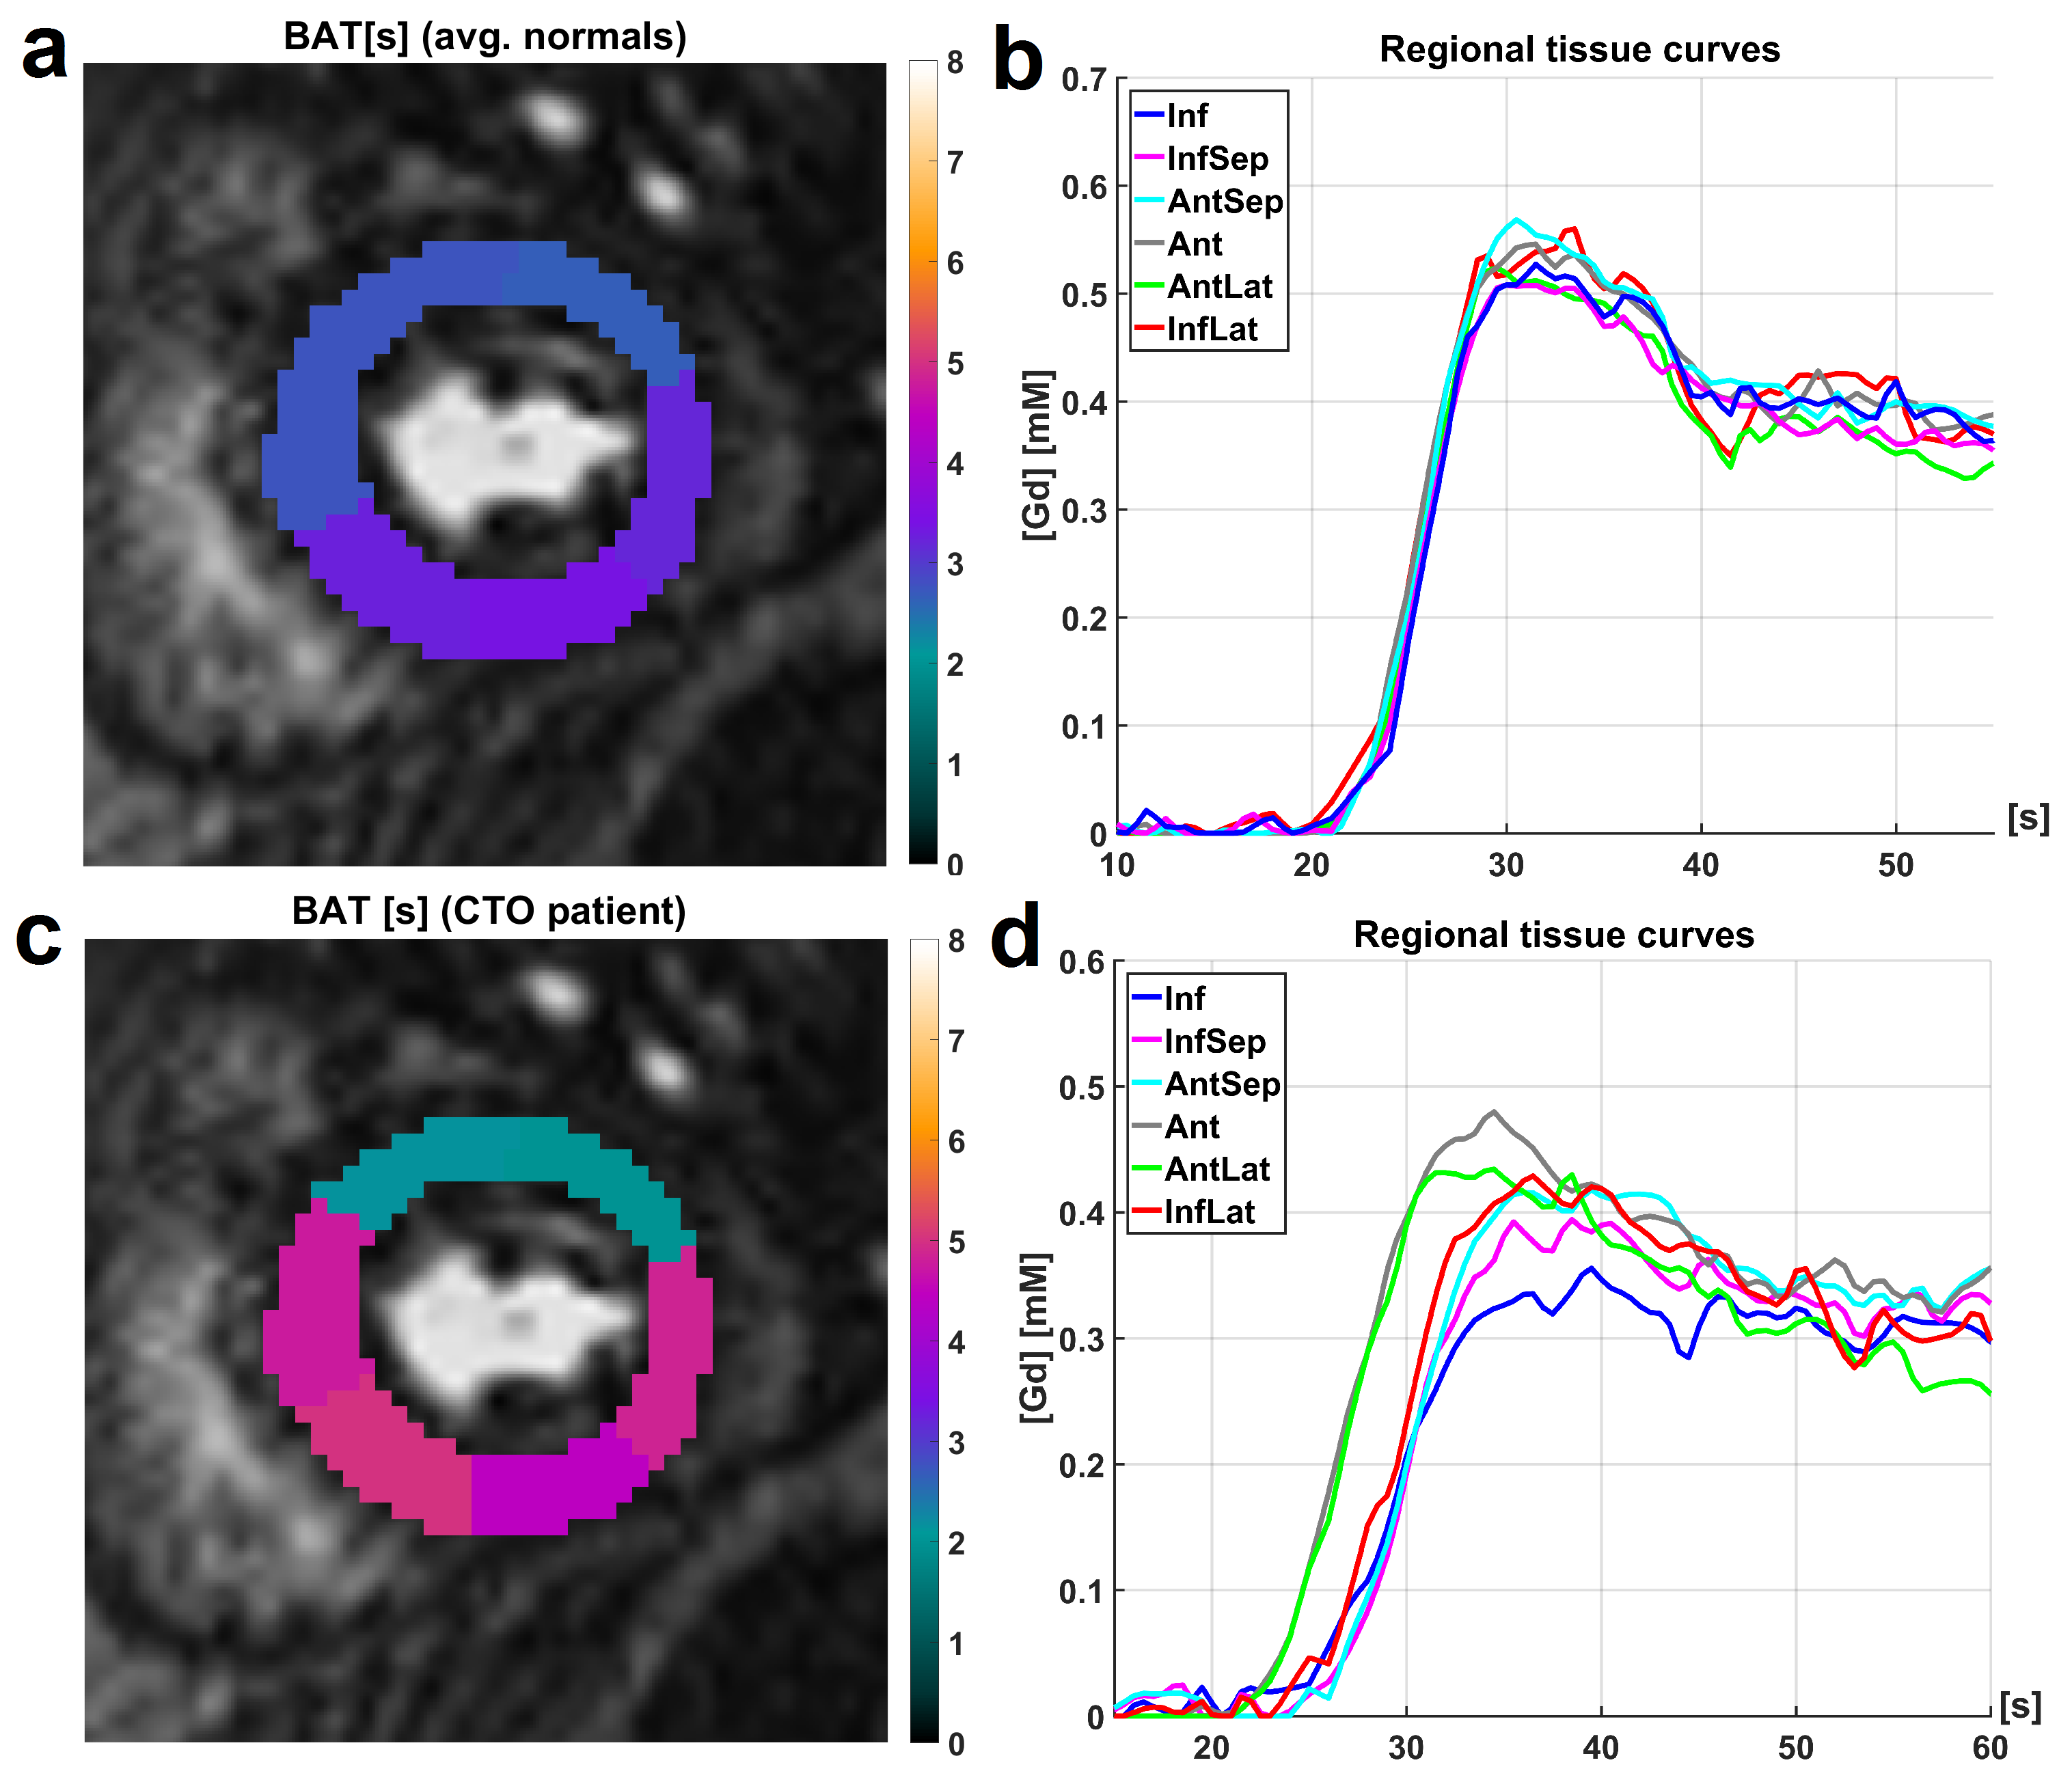
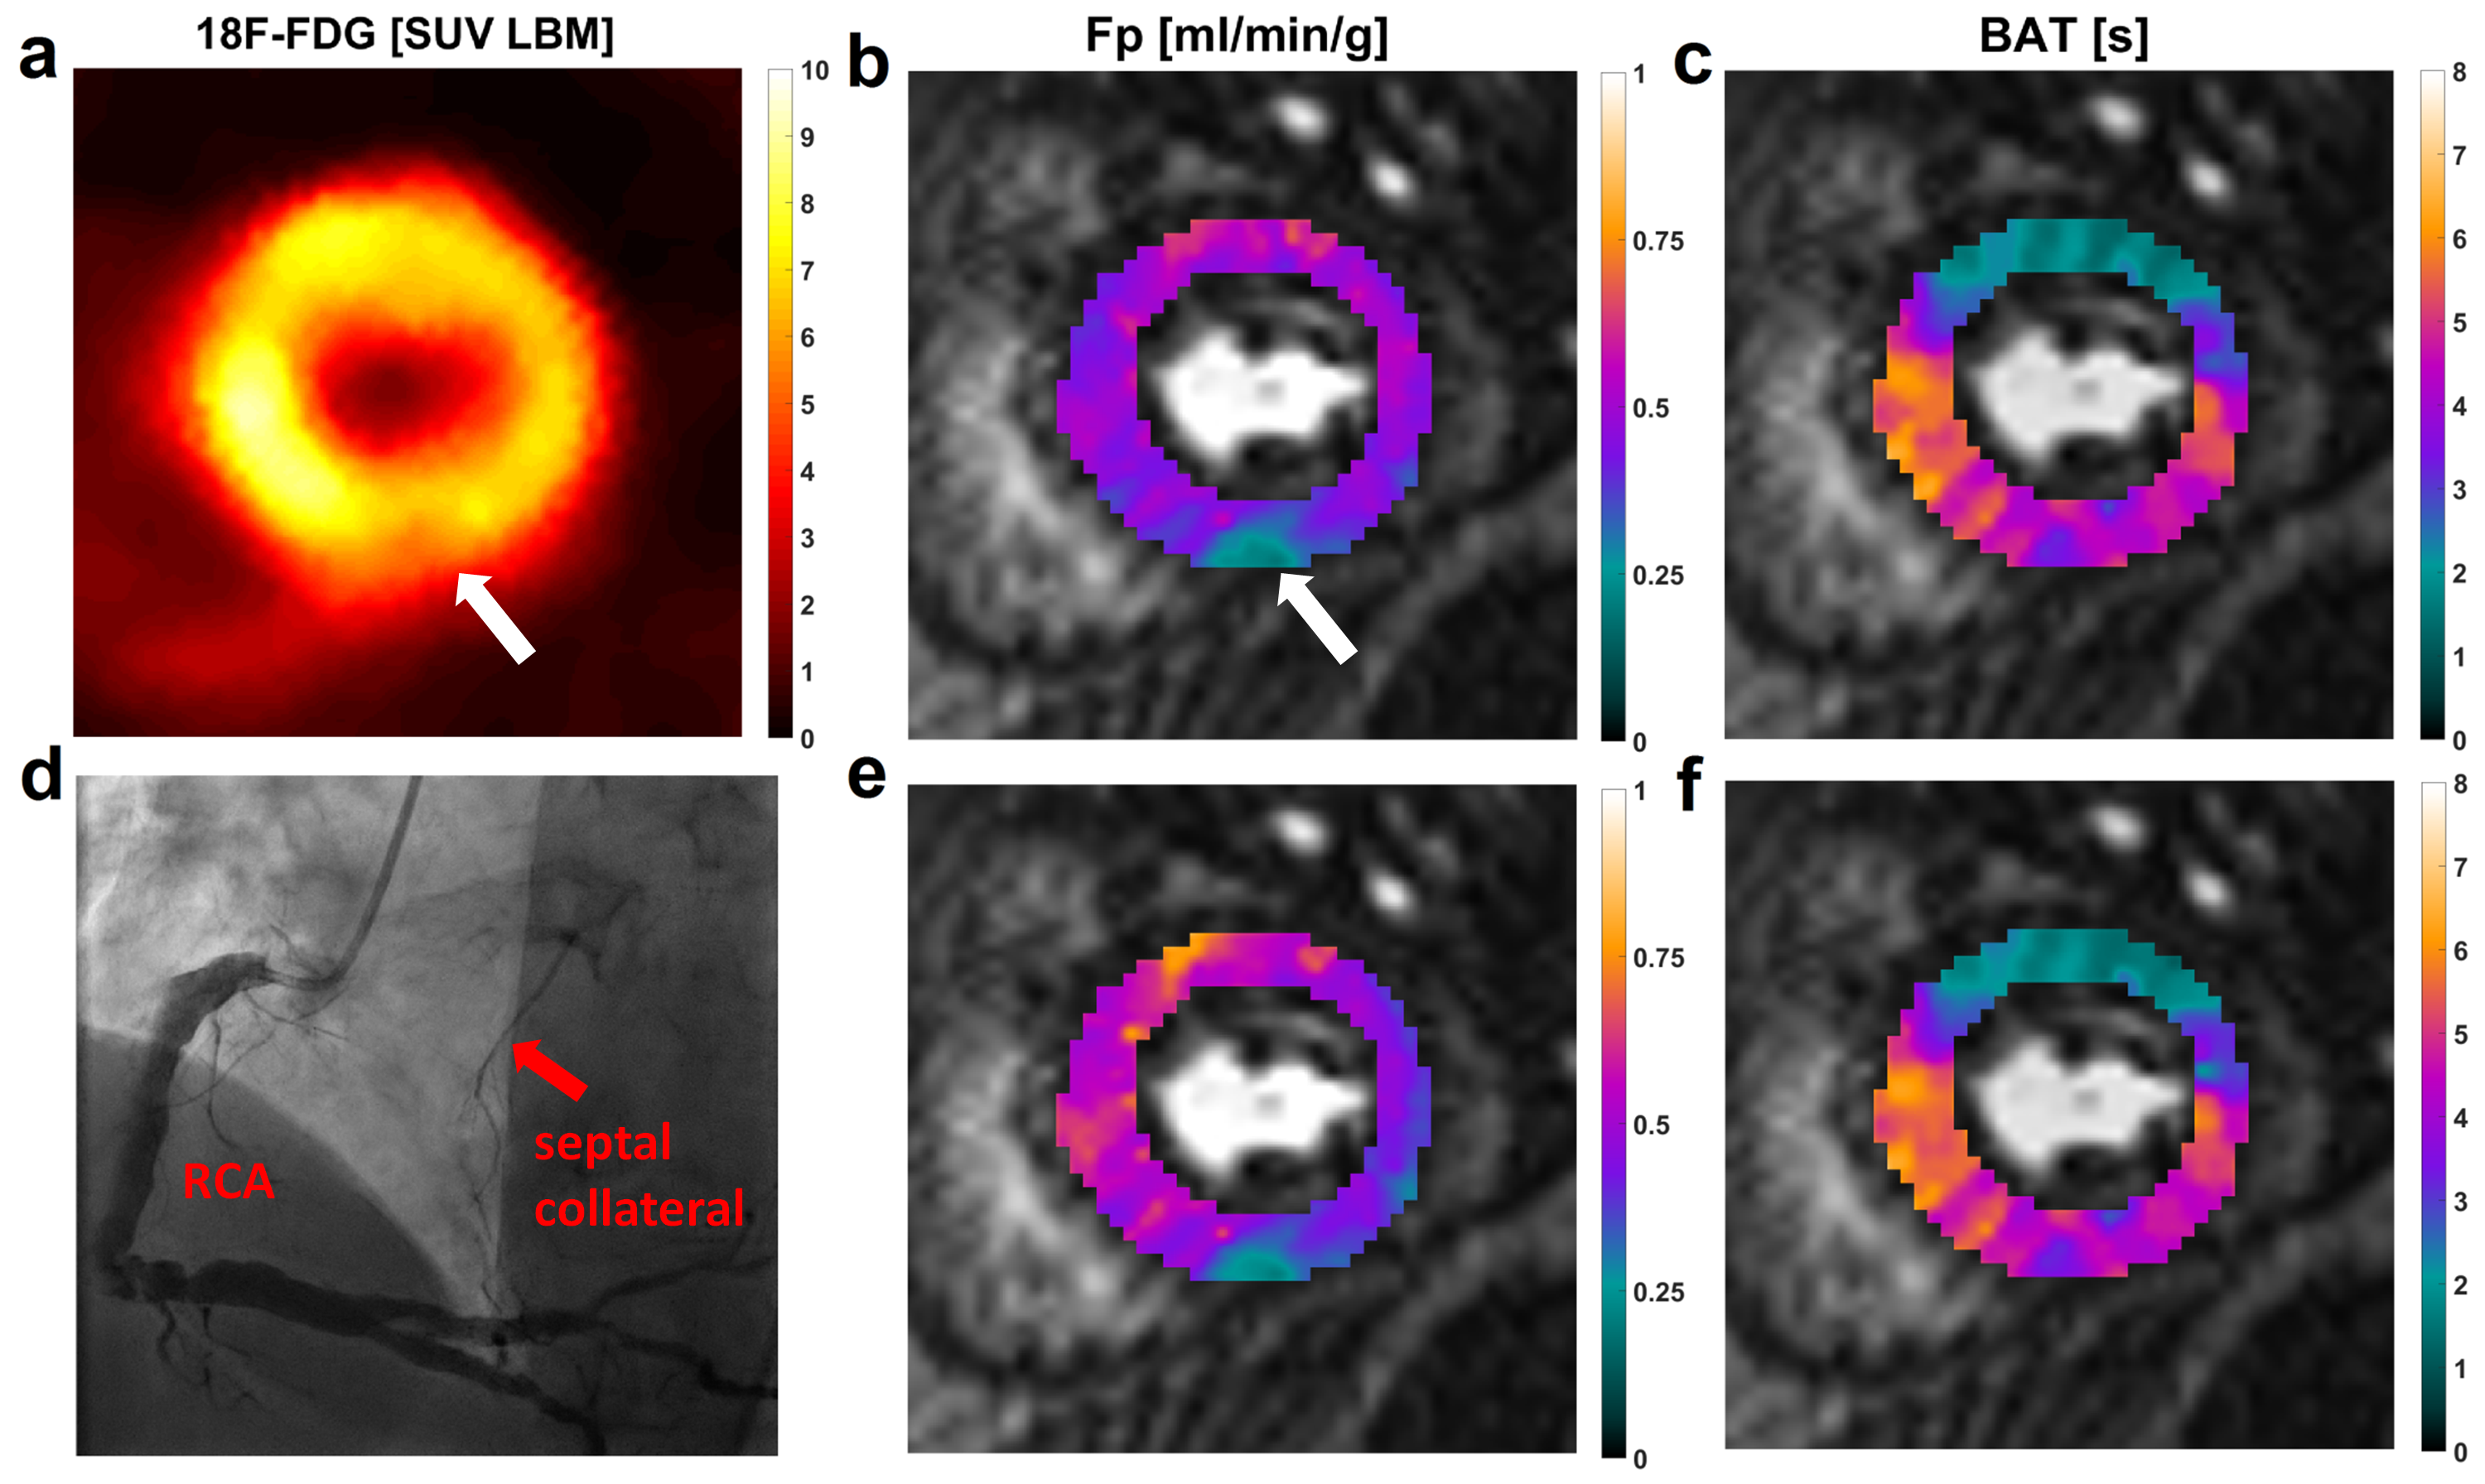
Figures 2 and 3 visualize the simulation results. It can be seen that TTP analysis is not able to distinguish between delay and dispersion, introducing a bias proportional to the simulated dispersion factor. BAT estimates from the proposed Fourier technique remain virtually unaffected by dispersion (Fig. 2). The standard deviations (SD) from all 100 simulation runs shown in Fig. 3 underscore the vast superiority in robustness of BAT measurements to TTP analysis at both noise levels. The clinical results from the control group show the regionally homogeneous distribution of arrival times despite occasionally higher BAT estimates in the inferior and lateral territories, leading to slightly higher averages there (Fig. 4a). The CTO patient presented with highly inhomogeneous BATs, 18F-FDG PET however confirmed metabolic integrity of all regions despite a small inferior deficit (Fig. 5a). Invasive angiography (Fig. 5d) confirmed collateralization of the septum, bypassing an occluded LAD main branch (long coronary path length for septum) despite a previously reopened LAD diagonal branch (short path length for anterior wall). Fig. 5 also shows the independence of the proposed method from SCIC and saturation correction (c/f), whereas the distribution of quantitative flow estimates greatly depended on these additional post-processing steps (b/e).Conclusion
A new method has been proposed to extract quantitative information from the phase spectra of DCE-MRI data with minimal additional post-processing. So attained estimates of the BAT are able to accurately and robustly characterize path lengths within the coronary vasculature and represent a quantitative and robust DCE-MRI counterpart to tissue characterization using PET in the context of quantitative multimodality imaging. It is expected that more accurate assessment of the BAT will also benefit model-constrained deconvolution analysis of MRI perfusion data.Acknowledgements
Funding was provided by DFG Grant 8810001759.References
1. Broadbent DA, Biglands JD, Ripley DP, et al. Sensitivity of quantitative myocardial contrast-enhanced MRI to saturation pulse efficiency, noise and T1 measurement error: Comparison of nonlinearity correction methods. Magn Reson Med. 2016;75:1290-1300.
2. Kunze KP, Rischpler C, Hayes C, et al. Measurement of
extracellular volume and transit time heterogeneity using contrast-enhanced
myocardial perfusion MRI in patients after acute myocardial infarction. Magn Reson Med. in press DOI:10.1002/mrm.26320.
Figures