3232
Blood flow velocity and pulsatility measurement of lenticulostriate arteries with 3T 2D Qflow MRI1Radiology, UMC Utrecht, Utrecht, Netherlands
Synopsis
The lenticulostriate arteries are involved in small vessel disease and their blood flow velocity and pulsatility has been measured with 7T 2D Qflow. To make this measurement more widely available we aimed to translate it to 3T by increasing blood SNR with a contrast agent. In this study we show that the 2D Qflow acquisition can measure blood flow velocity and its pulsatility in lenticulostriate arteries at 3T, even without the use of a contrast agent.
Introduction
The lenticulostriate arteries are a group of small perforating arteries, branching off from the medial cerebral artery, which are involved in cerebral small vessel disease (SVD). Two groups have shown that 7T MRI is capable of measuring the blood flow velocity and its pulsatility index in the lenticulostriate arteries1,2, with reproducible results1. Both groups used phase contrast quantitative flow (Qflow) MRI at 7T to benefit from its high signal to noise ratio (SNR). Unfortunately, 7T MRI scanners are not widely available, which may hamper the utility of this metric in clinical research on SVD on conventional 3T MRI. T1 shortening contrast agents have been used to increase blood signal in Qflow MRI.3–5 The aim of this work was to translate 2D Qflow for perforating arteries from 7T to 3T systems by the use of T1 shortening contrast agents.Methods
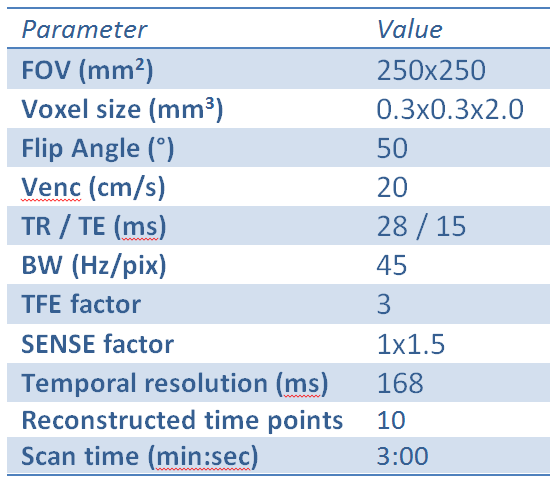
A previously published1 7T 2D Qflow acquisition was added (with minor alterations, see Table 1) to an ongoing 3T (Philips Healthcare) study, in which patients were administered T1 a shortening contrast agent. The imaging slice was planned through the basal ganglia, by angling the slice through the genu and splenium of the corpus callosum. The acquisition was performed once before and once after the intravenous administration of 1.0 mmol gadobutrol / kg body weight (gadovist 1.0 mmol/ml, Bayer Schering Pharma). Analysis was performed as previously published:1 Noise was estimated from the standard deviation of tissue signal over the cardiac cycle, and perforators were detected based on significant (0 cm/s not in 95%CI) mean velocity (Vmean). Detected perforators were matched between acquisitions to ensure that measurements were made in the same subset of perforators, and the signal to noise ratio of the velocity (SNRv) was determined. Outcomes with and without contrast agent were compared with a paired two sample t-test. The number of detected vessels (Ndetected) was tested before matching. A Bland Altman analysis was performed on the measured Vmean and PI between pre- and post-contrast acquisitions.6Results
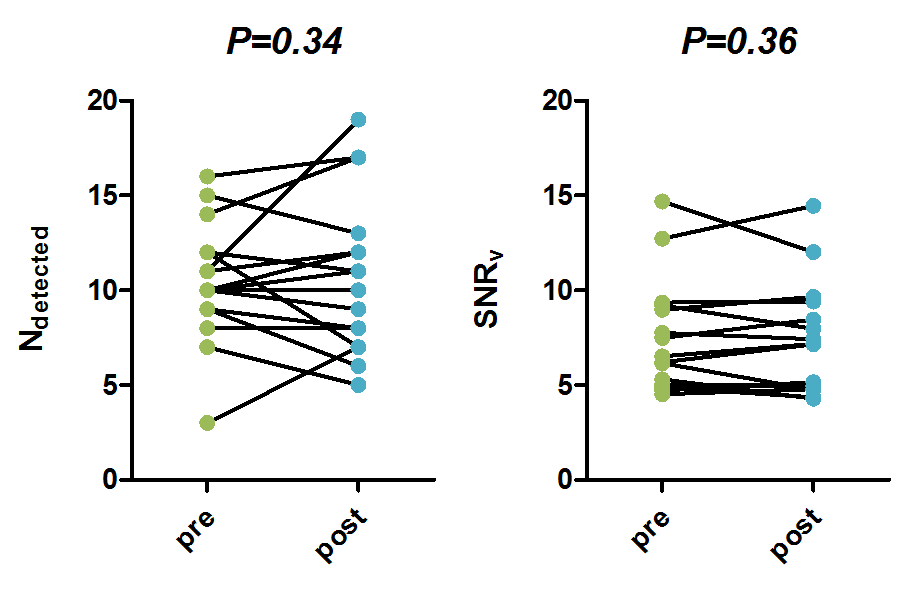
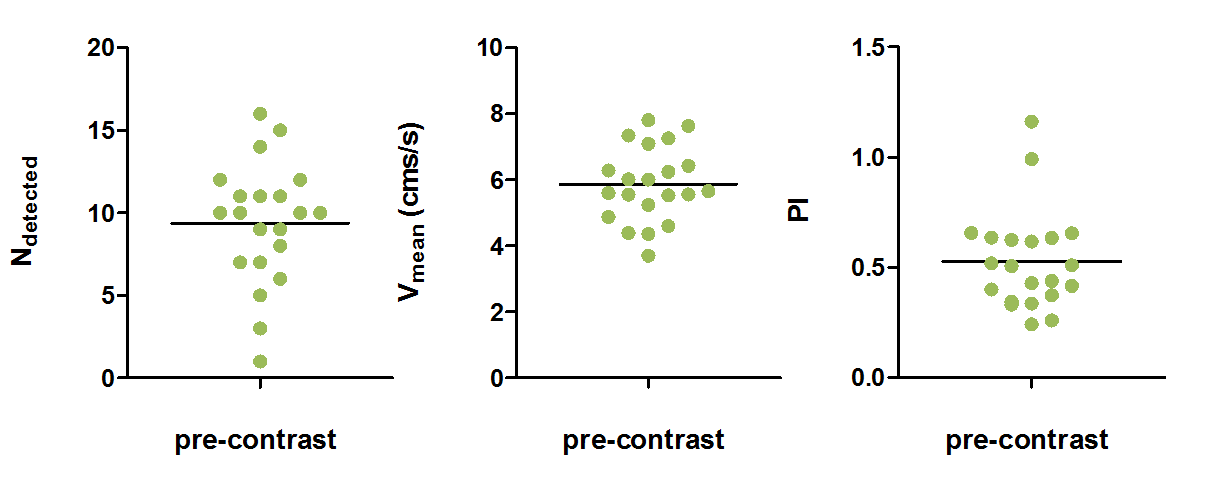
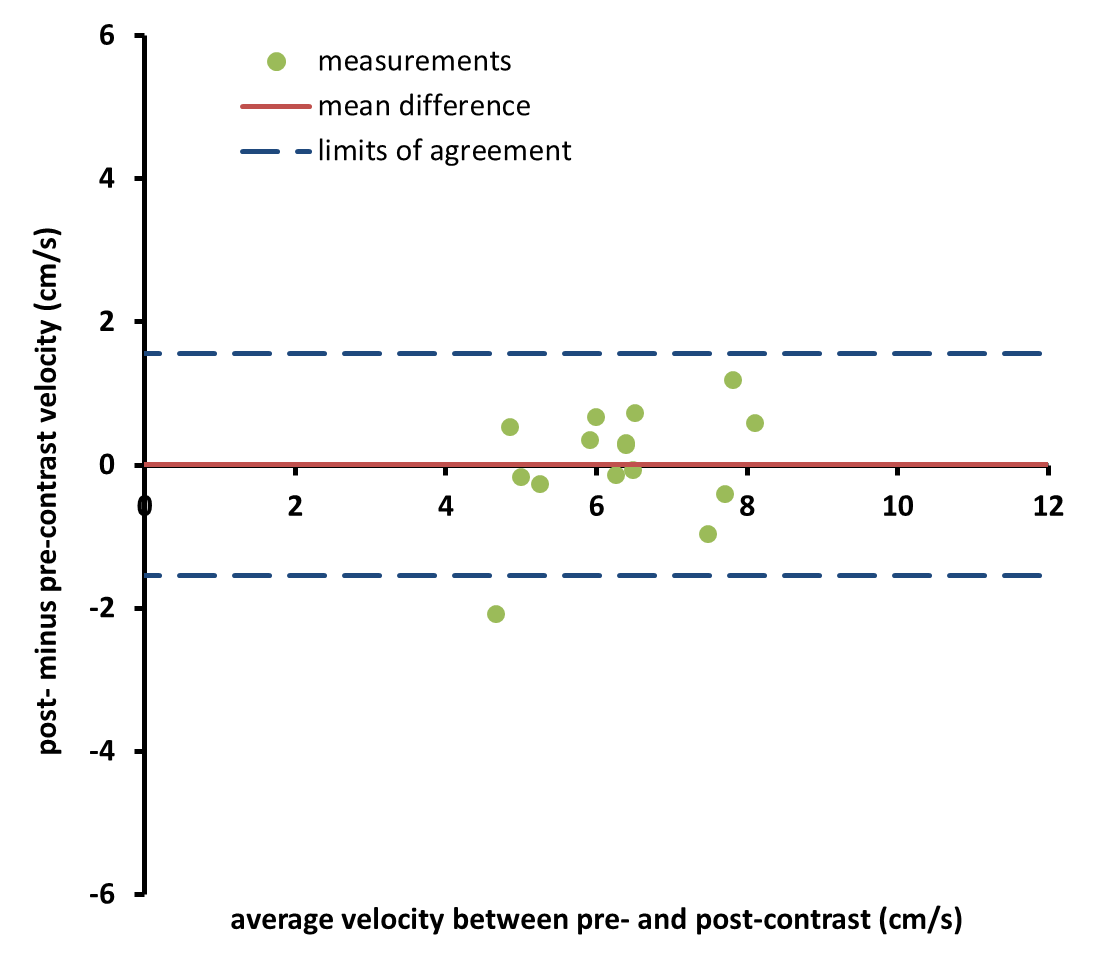
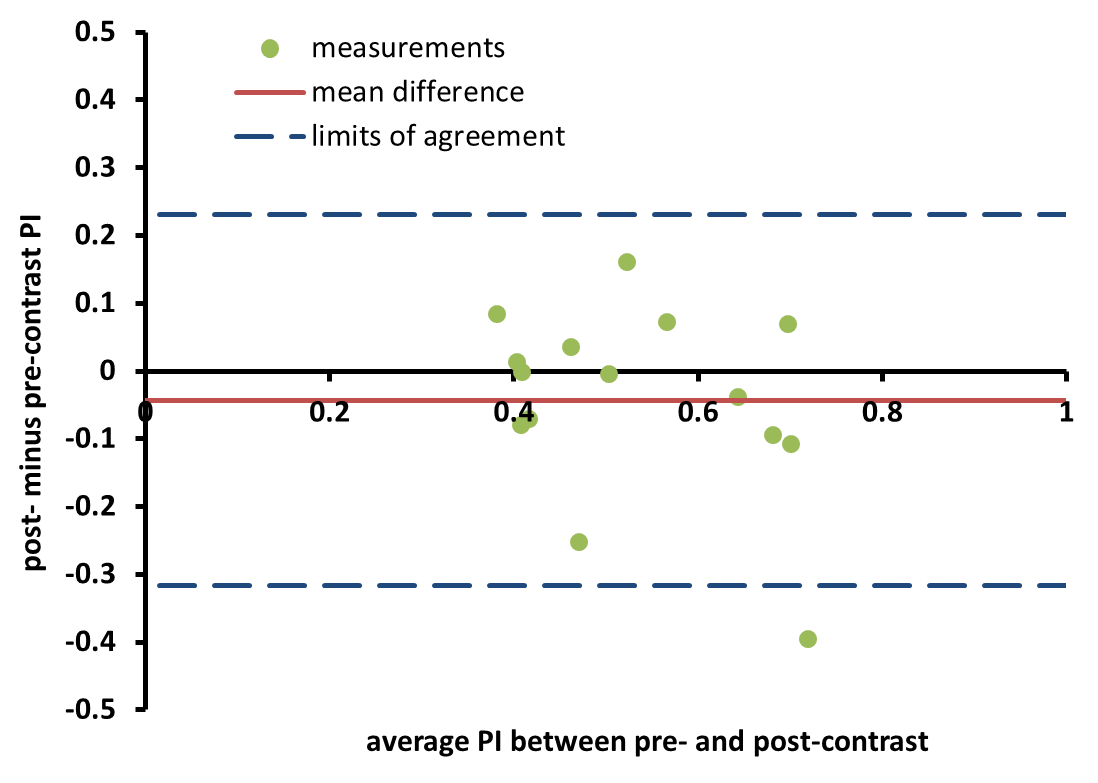
A total of 21 patients (11 male, 59 [35-74] years old) were scanned, for 5 of which the post-contrast acquisition was not completed due to scan time constraints. Figure 1 compares the outcomes for the acquisitions with and without contrast. The number of detected vessels did not change from pre- (mean [range]) 10 [3-16] to post-contrast 11 [5-19] (P=0.34). SNRv also did not change from pre- (mean±stderr) 7.57±0.78 to post-contrast 7.47±0.77 (P=0.36). Figure 2 shows the outcomes for the pre-contrast acquisition. The pre-contrast acquisition measured a Vmean (mean±stderr) of 5.87 ± 0.25 cm/s and a PI (mean±stderr) of 0.53 ± 0.05. Figure 3 shows the Bland Altman analysis of the average velocity per volunteer for pre- and post-contrast, which had a mean difference of 0.01 cm/s (0.2% of measured velocity) and a coefficient of repeatability (CoR) of 1.55 cm/s (24% of measured velocity). Figure 4 shows the Bland Altman analysis of the PI, which had a mean difference of -0.04 (-8% of measured PI) and a CoR of 0.27 (51% of measured PI).Discussion
The 2D Qflow performed adequately in the acquisition without contrast. The previously published method was applied in superficial perforating arteries rather than the lenticulostriate arteries, as done in the current study. Firstly, this increases SNR because of the larger blood vessel diameters, which causes a smaller partial volume effect. Secondly, the lenticulostriate arteries have faster flowing blood. Since the slice thickness is 2 mm and the average measured blood flow velocity was 5.87 cm/s, on average it takes blood 34 ms to traverse the slice. This leaves very little time for blood signal to get saturated, causing a higher SNR. The fast traversal of the slice also explains why administering a T1 shortening contrast agent did not significantly change any of the outcomes. With a TR of 28 ms this makes the blood signal relatively insensitive to blood T1. In the Bland Altman analysis there were no large systematic errors for either average velocity or PI. The coefficient of repeatability for average velocity was better than that for PI, however both were relatively wide compared to their measured quantity. Improving the temporal resolution of the acquisition might be beneficial for the precision of PI measurement, which will be investigated in future work.Conclusion
We have shown that 2D Qflow can measure blood flow velocity and its pulsatility in lenticulostriate arteries at 3T without the use of contrast agents.Acknowledgements
This work was supported by the European Research Council, ERC grant agreement n°337333.References
1. Bouvy, W. H. et al. Assessment of blood flow velocity and pulsatility in cerebral perforating arteries with 7-T quantitative flow MRI. NMR Biomed. (2015). doi:10.1002/nbm.3306
2. Kang, C. K. et al. Velocity measurement of microvessels using phase-contrast magnetic resonance angiography at 7 tesla MRI. Magn. Reson. Med. 75, 1640–1646 (2016).
3. Bock, J. et al. 4D phase contrast MRI at 3 T: Effect of standard and blood-pool contrast agents on SNR, PC-MRA, and blood flow visualization. Magn. Reson. Med. 63, 330–338 (2010).
4. Lagerstrand, K. M., Vikhoff-baaz, B. & Forssell-aronsson, E. Contrast Agent Influences MRI Phase-Contrast Flow Measurements in Small Vessels. 46, 42–46 (2010).
5. Heverhagen, J. T., Hoppe, M., Klose, K. & Wagner, H. Does the application of gadolinium-DTPA have an impact on magnetic resonance phase contrast velocity measurements?? Results from an in vitro study. 44, 65–69 (2002).
6. Bland, J. M. & Altman, D. G. Department of. 307–310
Figures