3231
Improved blood flow velocity measurement in superficial perforating arteries of the white matter at 7 tesla MRI1Radiology, UMC Utrecht, Utrecht, Netherlands, 2Brain Center Rudolf Magnus, UMC Utrecht, Utrecht, Netherlands
Synopsis
7T 2D Qflow is capable of measuring blood flow velocity in the superficial perforating arteries. These arteries run though the semi oval center of the white matter in the brain and have diameters smaller than 200 µm. Due to the small diameters, partial volume effects of perforators with surrounding tissue cause velocity underestimation. With simulations and experiments we show that tilt optimized nonsaturated excitation (TONE) significantly increases SNR and decreases velocity underestimation in superficial perforating arteries.
Introduction
To better understand the cause of cerebral small vessel disease, new measures for small vessel function before tissue damage occurs need to be developed.1 Blood flow velocity in the superficial perforating arteries (of the semioval center, CSO) can be measured reproducibly with 7T phase contrast quantitative flow (Qflow) MRI.2 However, in these small vessels partial volume effects with surrounding tissue cause velocity underestimation. Signal from slow flowing blood is saturated and therefore more prone to the partial volume effect with surrounding tissue. In slab acquisitions of large vessels blood saturation is commonly addressed by increasing the excitation flip angle along the flow direction, called tilt optimized nonsaturated excitation (TONE).3 The main goal of this work is to create a cardiac gated 2D Qflow protocol that has increased SNR and decreased underestimation for small vessel velocity measurements. With simulations and experiments we show that TONE can increase SNR and decrease velocity underestimation in superficial perforating arteries.Methods
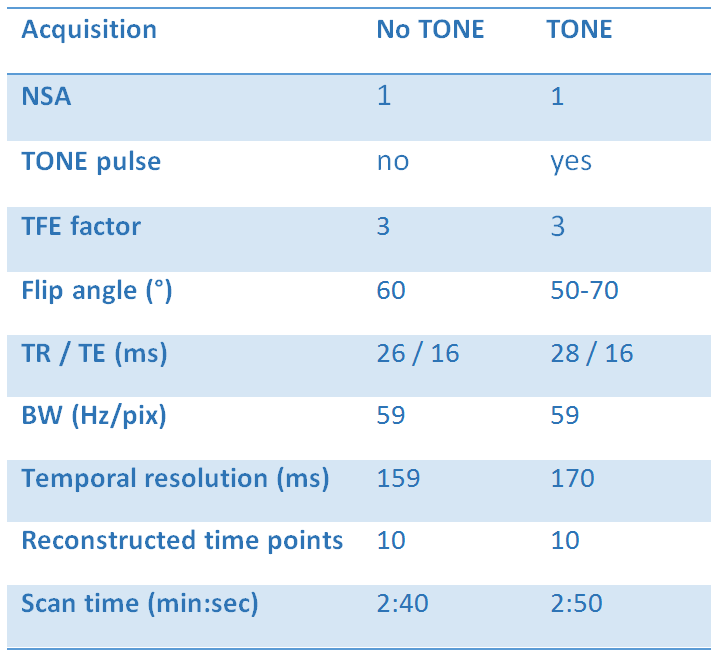
Eight healthy volunteers were scanned on a 7T MRI system (Philips Healthcare) with a 32 channel receive coil and a volume T/R coil for transmission (Nova Medical). The previously published 2D Qflow acquisition was modified by applying a tilt optimized nonsaturated excitation (TONE) pulse.2 To test the effect of applying a TONE pulse on velocity underestimation, a slice was acquired without TONE (flip angle (fa) = 60) and with TONE (fa = 50-70). See Table 1 for further acquisition parameters. The 2D Qflow acquisition was alternated with a fast T1 weighted 3D TFE (T1w) acquisition for white matter segmentation. Noise was estimated from the variance of static tissue over the cardiac cycle, and perforators were detected based on significant (i.e. above the noise threshold) mean velocity (Vmean). Detected perforators were matched between acquisitions, and the signal to noise ratio of the velocity (SNRv) and Vmean were tested for differences with a paired two sample t-test.
The effect of TONE on SNR, detectability and Vmean was also simulated. The excitation profile was computed for the default pulse and the TONE pulse using the Bloch equations.4 Flip angles and voxel dimensions were set as during the acquisitions (Table 1). Signal was then calculated for tissue and blood with relaxation times T1/T2 is 2100/32 ms for blood and 1200/27 ms for white matter.5–7 Monte Carlo simulation was used to incorporate the effect of noise. The SNR of static tissue was based on the SNR observed in the acquired images and set to 7. The same criterium for significant flow as described above was used to determine vessel detectability.
Results
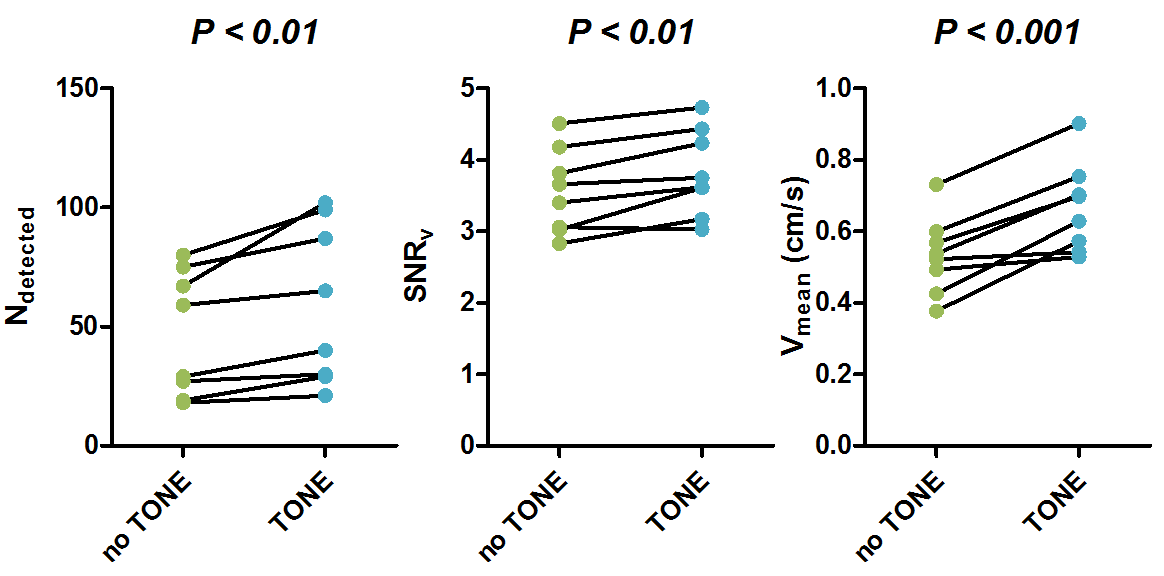
Figure 1 compares the measured quantities for no TONE versus TONE acquisitions. The number of detected vessels (Ndetected) increased significantly from (mean [range]) 47 [18-80] to 59 [21-102] (P<0.01). SNRv increased significantly from (mean±stderr) 3.56±0.20 to 3.82±0.21 (P<0.01). Vmean increased significantly from (mean±stderr) 0.53±0.04 to 0.67±0.04 cm/s (P<0.001).
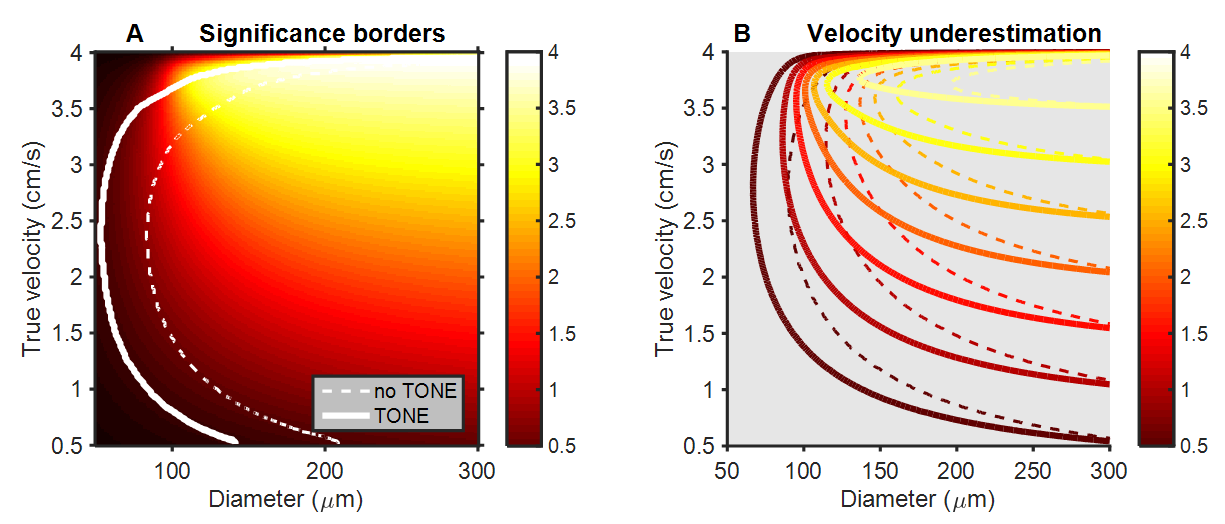
The simulations of the effect of the TONE pulse showed a decreased underestimation of the velocity due to the partial volume effect, as shown in figure 2. The area of combinations of vessel diameters and blood flow velocities that are detectable by this technique increased from 73% to 90% of tested velocity – diameter combinations in figure 2. The minimal detectable diameter decreased from 83 µm to 53 µm.
Discussion
The measured velocities increased markedly when applying the TONE pulse, together with an increase in SNRv and Ndetected. Simulations showed that, as per design, the TONE pulse decreases saturation and thereby increases blood signal. This strongly suggests that the observed increase in velocity is in fact a decrease in underestimation. Simulations also showed that smaller vessels would be detectable because SNRv would increase. While we did observe an increase in SNRv it was only slight and not as large as the Vmean increase. Since SNR is the ratio between the measured quantity and the standard deviation due to noise, an increase of the measured quantity should increase the SNR. Since we derived the noise from the background tissue, it may be that the apparent noise of the background increased with applying TONE, due to an increase in blood inflow related signal fluctuations. While the longer RF pulse for TONE does increase TR and thereby worsens temporal resolution, it only does so by a small amount. The significant decrease in underestimation makes applying the TONE pulse worth this small cost.Conclusion
Employing a TONE pulse increases SNR and decreases velocity underestimation in 7 tesla 2D Qflow of superficial perforating arteries.Acknowledgements
This work was supported by the European Research Council, ERC grant agreement n°337333.References
1. Pantoni, L. Cerebral small vessel disease: from pathogenesis and clinical characteristics to therapeutic challenges. Lancet Neurol. 9, 689–701 (2010).
2. Bouvy, W. H. et al. Assessment of blood flow velocity and pulsatility in cerebral perforating arteries with 7-T quantitative flow MRI. NMR Biomed. (2015).
3. Eissa, A. & Wilman, A. H. Ramped RF Excitation in 3DTOF MR Angiography at High Magnetic Field. Blood 11, 2004–2004 (2004).
4. Matsuda, T. et al. An asymmetric slice profile: spatial alteration of flow signal response in 3D time-of-flight NMR angiography. Magn. Reson. Med. 29, 783–789 (1993).
5. Peters, A. M. et al. T2* measurements in human brain at 1.5, 3 and 7 T. Magn. Reson. Imaging 25, 748–753 (2007).
6. Zhang, X. et al. In vivo blood T1 measurements at 1.5 T, 3 T, and 7 T. Magn. Reson. Med. 70, 1082–1086 (2013).
7. Rooney, W. D. et al. Magnetic field and tissue dependencies of human brain longitudinal 1H2O relaxation in vivo. Magn. Reson. Med. 57, 308–318 (2007).
Figures