3229
Computational Fluid Dynamics of Pulmonary Circulation Before and After Induced Pulmonary Hypertension: 2D Flow versus 4D Flow MRI-Based Boundary Conditions1Department of Radiology, University of Wisconsin - Madison, Madison, WI, United States, 2Rocky Vista University, CO, United States, 3Department of Mechanical Engineering, University of Wisconsin - Madison, Madison, WI, United States
Synopsis
Acute pulmonary hypertension was induced in dogs by micro embolization. RHC was performed, as well as 4D flow MRI pre and post-embolization. MRI data was used to develop a CFD model of the proximal pulmonary circulation while comparing two inlet boundary conditions: velocity definition as defined from 2D flow MRI and from 4D flow MRI, which takes into account the directionality of the velocity. WSS tended to decrease post-embolization. Pressure gradient distribution shows that during peak systole, a constant normal inlet condition might be sufficient for CFD simulation; however, differences might be present during diastole.
Purpose
Evaluate effects of 2D versus 4D flow MRI for inlet conditions in computational fluid dynamics (CFD) of pulmonary hypertension (PH). Resulting wall shear stress (WSS) and pressure distributions are compared. We hypothesized that using 4D flow MRI velocity data for inlet boundary conditions at the main pulmonary artery (MPA) would result in significantly different CFD hemodynamic measurements.
Introduction
CFD and 4D flow MRI have been independently used to study PH hemodynamics. 4D flow MRI has been used to quantify parameters in the pulmonary vasculature, and has been shown to have excellent reproducibility.1 Furthermore, it can be used to accurately diagnose PH, estimating MPA pressure by measuring the duration of vortex formation.2,3 CFD facilitates analysis of flow patterns, spatial distribution of velocity and WSS in a diseased state. It has been used less extensively in pulmonary vasculature. CFD and MRI have been used together showing reduced WSS in PH.4 In previous studies, net flow is used to create a parabolic flow distribution for inlet boundary conditions.4 Although these approximations may be useful, they lack patient specificity. Use of 4D flow MRI data for inlet boundary conditions may provide more accurate simulations.
Methods
After IACUC approval, three adult female beagles were induced with propofol and maintained under anesthesia with isoflurane. Right heart catheterization (RHC) and cardiac magnetic resonance (CMR) measurements were performed prior to and following induction of acute PH by injection of embolizing micro-beads (150-500μm) into the right atrium and ventricle.
4D Flow MRI parameters were FOV: 32x32x22cm, readout=256, TR/TE=6.7/2.4, spatial resolution=1.3mm isotropic. PC VIPR was performed following administration of 0.1mmol/kg of Gd-based intravenous contrast (gadobenate dimeglumine, Bracco Diagnostics, Inc., Princeton, NJ). Data was reconstructed to 20 time frames for dynamic post-processing using retrospective ECG gating and a temporal filter for view sharing.
RHC was performed immediately following the pre-embolization MRI and immediately prior to post-embolization MRI. Pulmonary vascular resistance (PVR), in Woods units (WU), was calculated using: PVRRHC=(mPAP-PCWP)/CO, where mPAP is mean pulmonary arterial pressure, PCWP is pulmonary capillary wedge pressure, and CO is cardiac output (Table 1).
MRI data was processed (Mimics; Materialise, Leuven, Belgium) to segment pulmonary arteries, from approximately 3cm proximal to the MPA bifurcation to the lobar arteries or as far distally as image resolution allowed. Surfaces were smoothed (3-Matic; Materialise) followed by creation of inlet and outlet cross planes. Geometries were discretized with triangle, tetrahedral and prism elements. 4D flow MRI data was processed in Ensight (CEI Inc., Apex, NC). Previously, the geometry was registered to the flow images, obtaining quantification at coinciding inlet plane locations (MPA). Volumetric flow rate was calculated and velocity data was acquired for each time step.
CFD was performed in Fluent (ANSYS, Inc.; Canonsburg, PA) using blood fluid properties (density 1050kg/m3; viscosity 0.0035Pa*s). No-slip boundary conditions were defined at rigid walls. Two inlet boundary conditions were compared: 2D Flow, which assumed a time-varying velocity normal to the inlet, using 4D flow MRI-average flow divided by plane cross area; 4D Flow, based on three-directional velocities from 4D flow MRI, defining three components varying in time at the inlet. Outlet boundary conditions were assigned according to PCWP as measured with RHC.
Results and Discussion
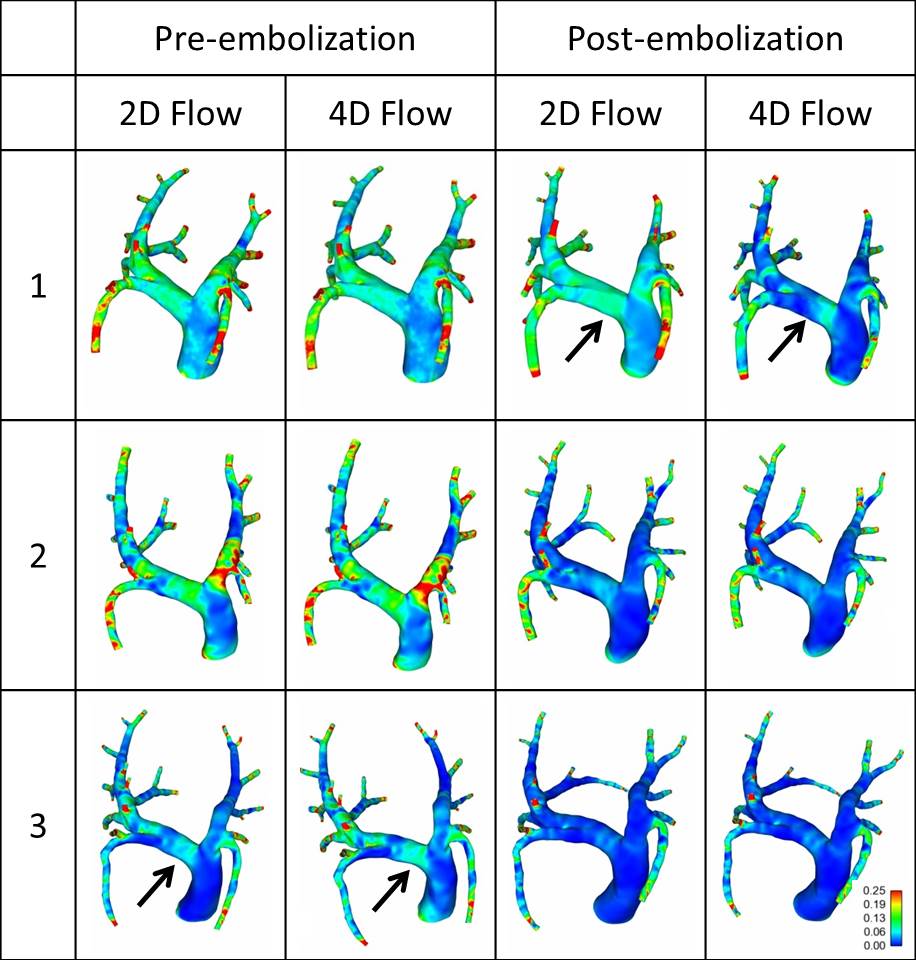
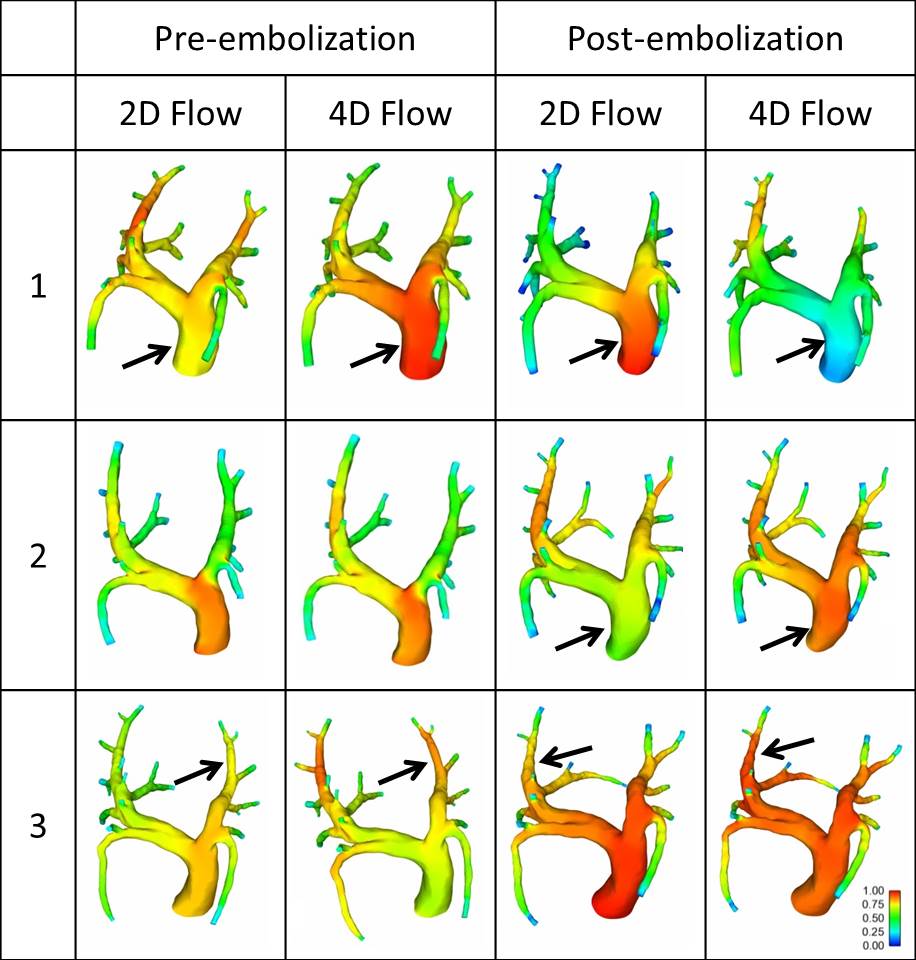
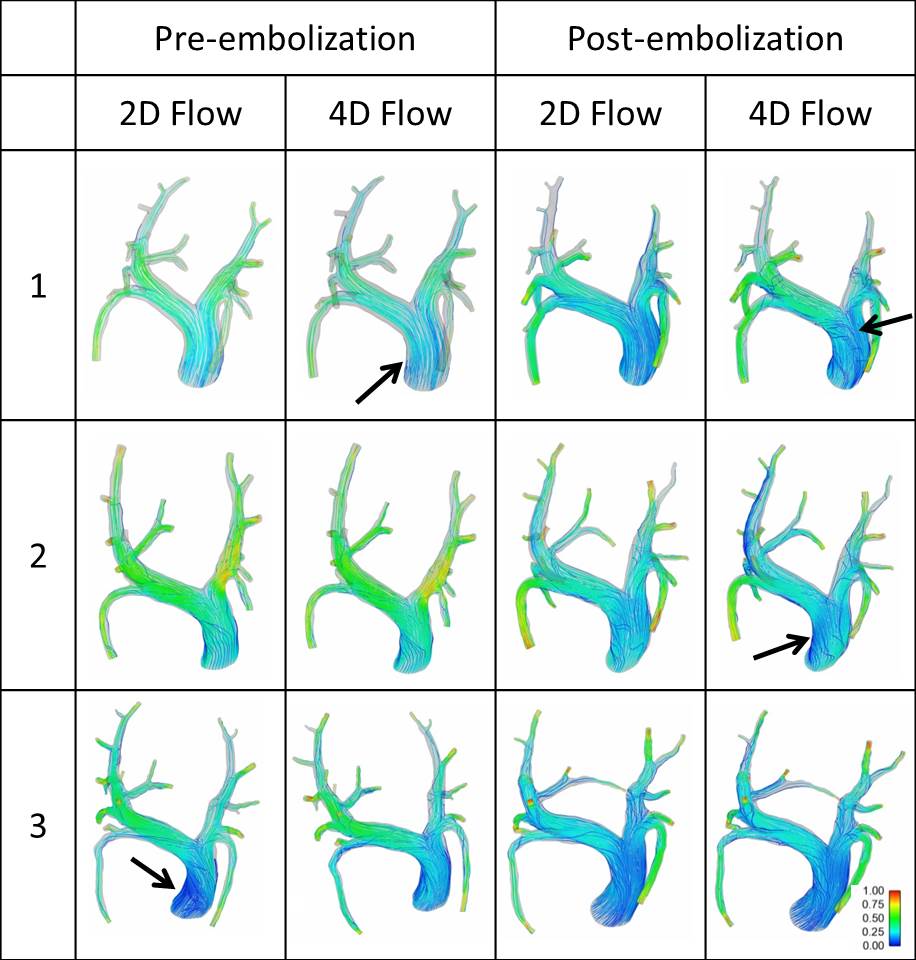
Vessels branching from the LPA and RPA were pooled to quantify LPA and RPA volumetric flow rate, respectively. In average, 38% of the flow was directed through the LPA and 62% through the RPA. In general, WSS tends to decrease post-embolization when compared to pre-embolization simulations (Figure 1). Pressure gradient results showed differences among inlet boundary conditions, and pre- compared to post-embolization, although not following a defined pattern that would suggest significant differences (Figure 2). This finding may reflect the directionality of the velocity during peak systole as being mostly normal to the inlet plane (Figure 3). Different observations might be made when analyzing diastole, where secondary velocity components may play a more important role.
Summary
4D flow MRI velocity data was successfully implemented as CFD inlet boundary conditions (4D Flow) in simulations of pre and post PH. Thus, directionality of the inlet flow was taken into account and compared to a normal velocity formulation (2D Flow). WSS tended to decrease post-embolization. Differences in pressure gradient distribution were found when comparing inlet definition and PH status. Larger effects are expected to be observed during diastole, where velocity vectors have a larger tangential component. 4D flow MRI velocity data is important in patient-specificity of pulmonary circulation CFD.
Acknowledgements
We acknowledge support from the UW Radiology Research & Development fund and GE Healthcare for their support to the Department of Radiology.
References
Markl M, Wallis W, Harloff A. Reproducibility of flow and wall shear stress analysis using flow-sensitive four-dimensional MRI. J Magn Reson Imaging. 2011;33(4):988–94.
Reiter G, Reiter U, Kovacs G, Kainz B, Schmidt K, Maier R, et al. Magnetic resonance-derived 3-dimensional blood flow patterns in the main pulmonary artery as a marker of pulmonary hypertension and a measure of elevated mean pulmonary arterial pressure. Circ Cardiovasc Imaging. 2008;1(1):23–30.
Reiter G, Reiter U, Kovacs G, Olschewski H, Fuchsjager M. Blood flow vortices along the main pulmonary artery measured with MR imaging for diagnosis of pulmonary hypertension. Radiology. 2015;275(1):71–9.
Tang B, Pickard S, Chan F, et al. Wall shear stress is decreased in the pulmonary arteries of patients with pulmonary arterial hypertension: An image-based, computational fluid dynamics study. Pulm Circ. 2012;2(4):470-476.
Figures