3225
Comparison of Doppler Echocardiography Mean Transvalvular Aortic Pressure Gradient to 4D Flow MRI1Medical Imaging, Ann & Robert H. Lurie Children's Hospital of Chicago, Chicago, IL, United States, 2Department of Radiology, Feinberg School of Medicine, Northwestern University, 3Department of Biomedical Engineering, McCormick School of Engineering, Northwestern University, 4Division of Cardiology, Feinberg School of Medicine, Northwestern University, 5Division of Pediatric Cardiology, Ann & Robert H. Lurie Children's Hospital of Chicago, Chicago, IL, United States, 6Department of Pediatrics, Feinberg School of Medicine, Northwestern University
Synopsis
Mean and peak pressure gradients are an important measure of aortic stenosis severity. In this study, we present a novel method for measuring mean pressure gradients using 4D flow MRI. 4D flow MRI peak and mean pressure gradients were measured in 23 pediatric BAV patients and compared to Doppler echocardiography (echo). There was no significant difference between 4D flow MRI and echo in peak or mean pressure gradients. 4D flow MRI mean pressure gradients correlated better with echo than peak pressure gradients (R2= 0.78 vs. R2=0.27), suggesting 4D flow to be better suited for measuring mean pressure gradients.
Purpose
The accurate estimation of aortic valve stenosis (AS) severity is necessary to effectively manage therapy and intervention in patients1. Among the various markers of severity, the transvalvular pressure gradient is an important metric informing AS severity. Combining noninvasive imaging and the simplified Bernoulli equation, the peak pressure gradient is often estimated from a singular peak systolic velocity value, while the mean pressure gradient is computed from the time-averaged pressure gradient over the systolic phase. The findings from peak and mean pressure gradients can be used to corroborate each other as well as other AS severity measures, such as valve orifice size. Currently, the non-invasive gold standard for pressure gradient determination is Doppler echocardiography (echo). 2D PCMRI and time resolved 3D PCMRI (4D flow) have been shown to be reliable alternatives to echo for measuring peak pressure gradients. However, prior studies have not employed MRI to measure the mean pressure gradient. In particular, 4D flow is advantageous since the vena contracta can be localized and followed over the cardiac cycle. Therefore, the aim of this study is to test the ability to measure mean pressure gradient with 4D flow MRI. We hypothesize that 4D flow will produce pressure gradients comparable to echocardiography and that mean pressure gradients from 4D flow will agree better with echocardiography than peak pressure gradients.Methods
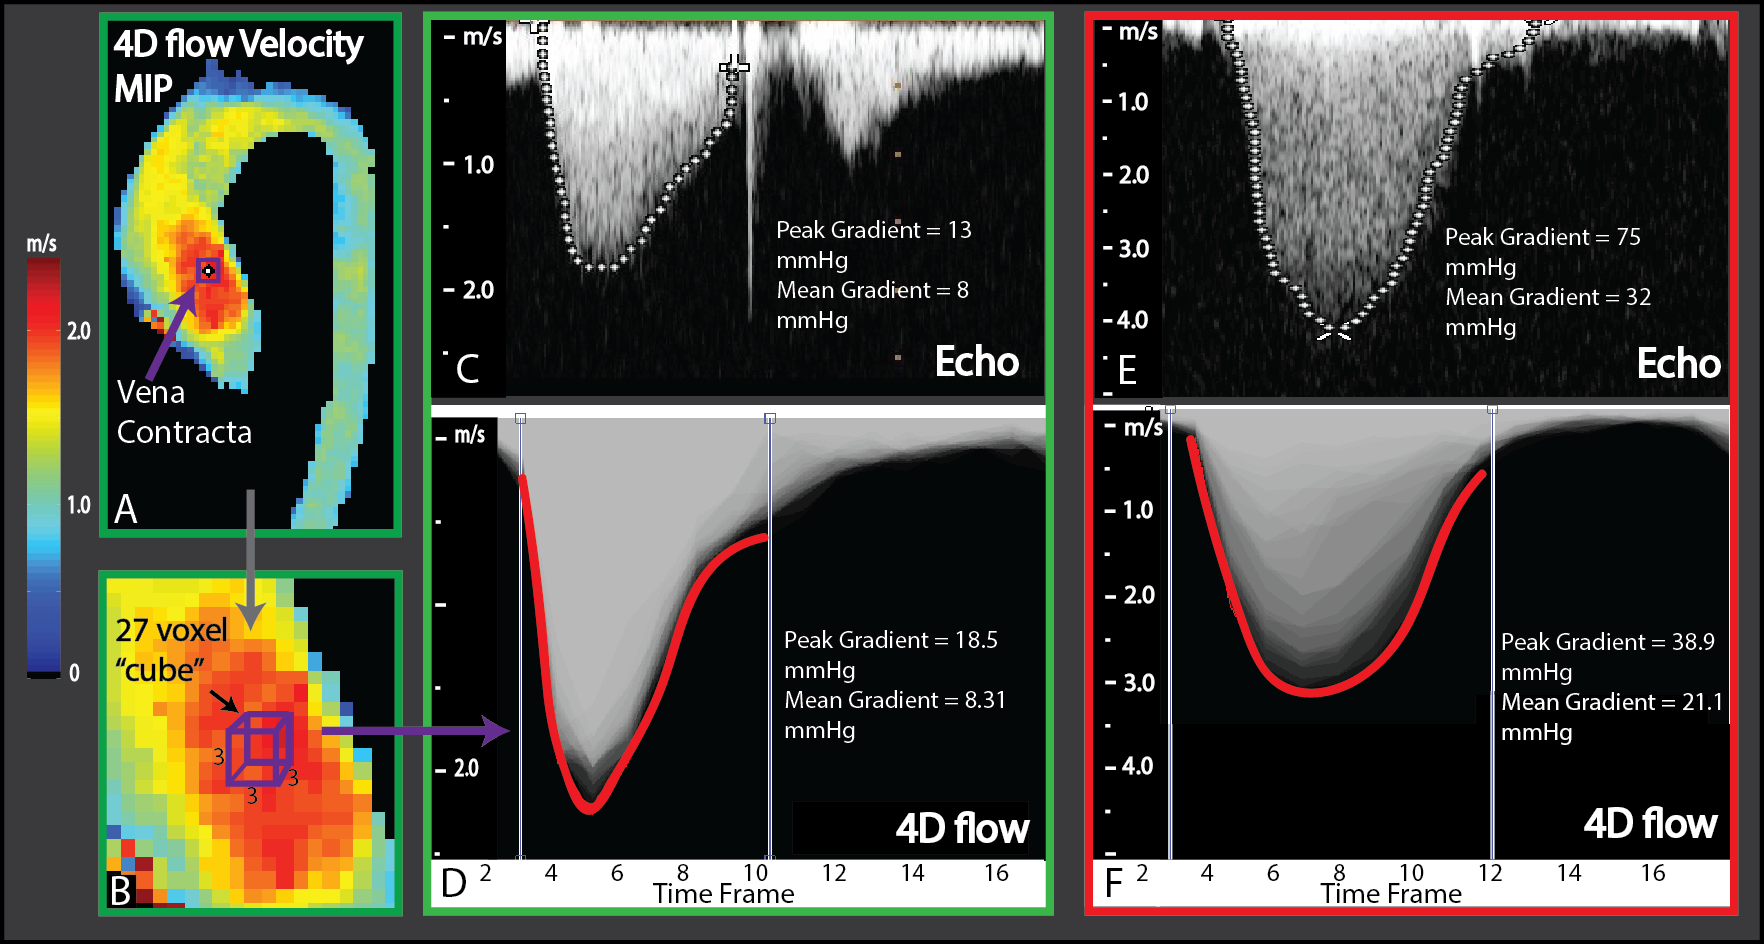
23 pediatric patients (age = 14 ± 5 (min: 3 max: 22) years, male:female = 16:7) with diagnosed bicuspid aortic valve (BAV) received 4D flow MRI included in a physician-ordered cardiac MR assessment as part of this IRB-approved study. MRI scans were performed at 1.5 T (Avanto or Aera, Siemens, Germany) with spatial resolution = 1.9-3.5 x 1.6-2.5 x 1.9-4.0 mm3, temporal resolution 37.6-40.8 ms, TE/TR/FA = 2.3-2.6ms/4.7-5.1ms/15° and velocity sensitivity = 150–400 cm/s. 4D flow data were preprocessed to reduce noise and artifacts caused by velocity aliasing and phase offset errors (Maxwell terms, eddy currents). 3D PC-MR angiograms were computed from 4D flow data as described previously2 and used to obtain a 3D segmentation of the aorta (Mimics, Materialise, Belgium), which was then used to mask the 4D flow velocity field. The time-resolved aorta velocity field was used to generate a velocity maximum intensity projection (MIP) as described previously3, from which the peak velocity in the ascending aorta (AAo) was extracted. A velocity-time curve was plotted for the location of peak velocity and each of its nearest neighbor voxels (27 voxels total, Figure 1D). If the location of the peak velocity was not in the vena contracta, it was selected using the velocity MIP. Peak pressure gradients were calculated from the peak velocity and simplified Bernoulli equation (P=4v2) as previously described by Rose et al3. The mean pressure gradient was determined by tracing the velocity-time curve plots from the beginning till the end of systole and then taking the mean of the trace (Figure 1B). A temporal filter was used to exclude any noisy voxels from the trace. The peak and mean pressure gradients of each patient were then compared to a recent echocardiogram (<6 months).Results
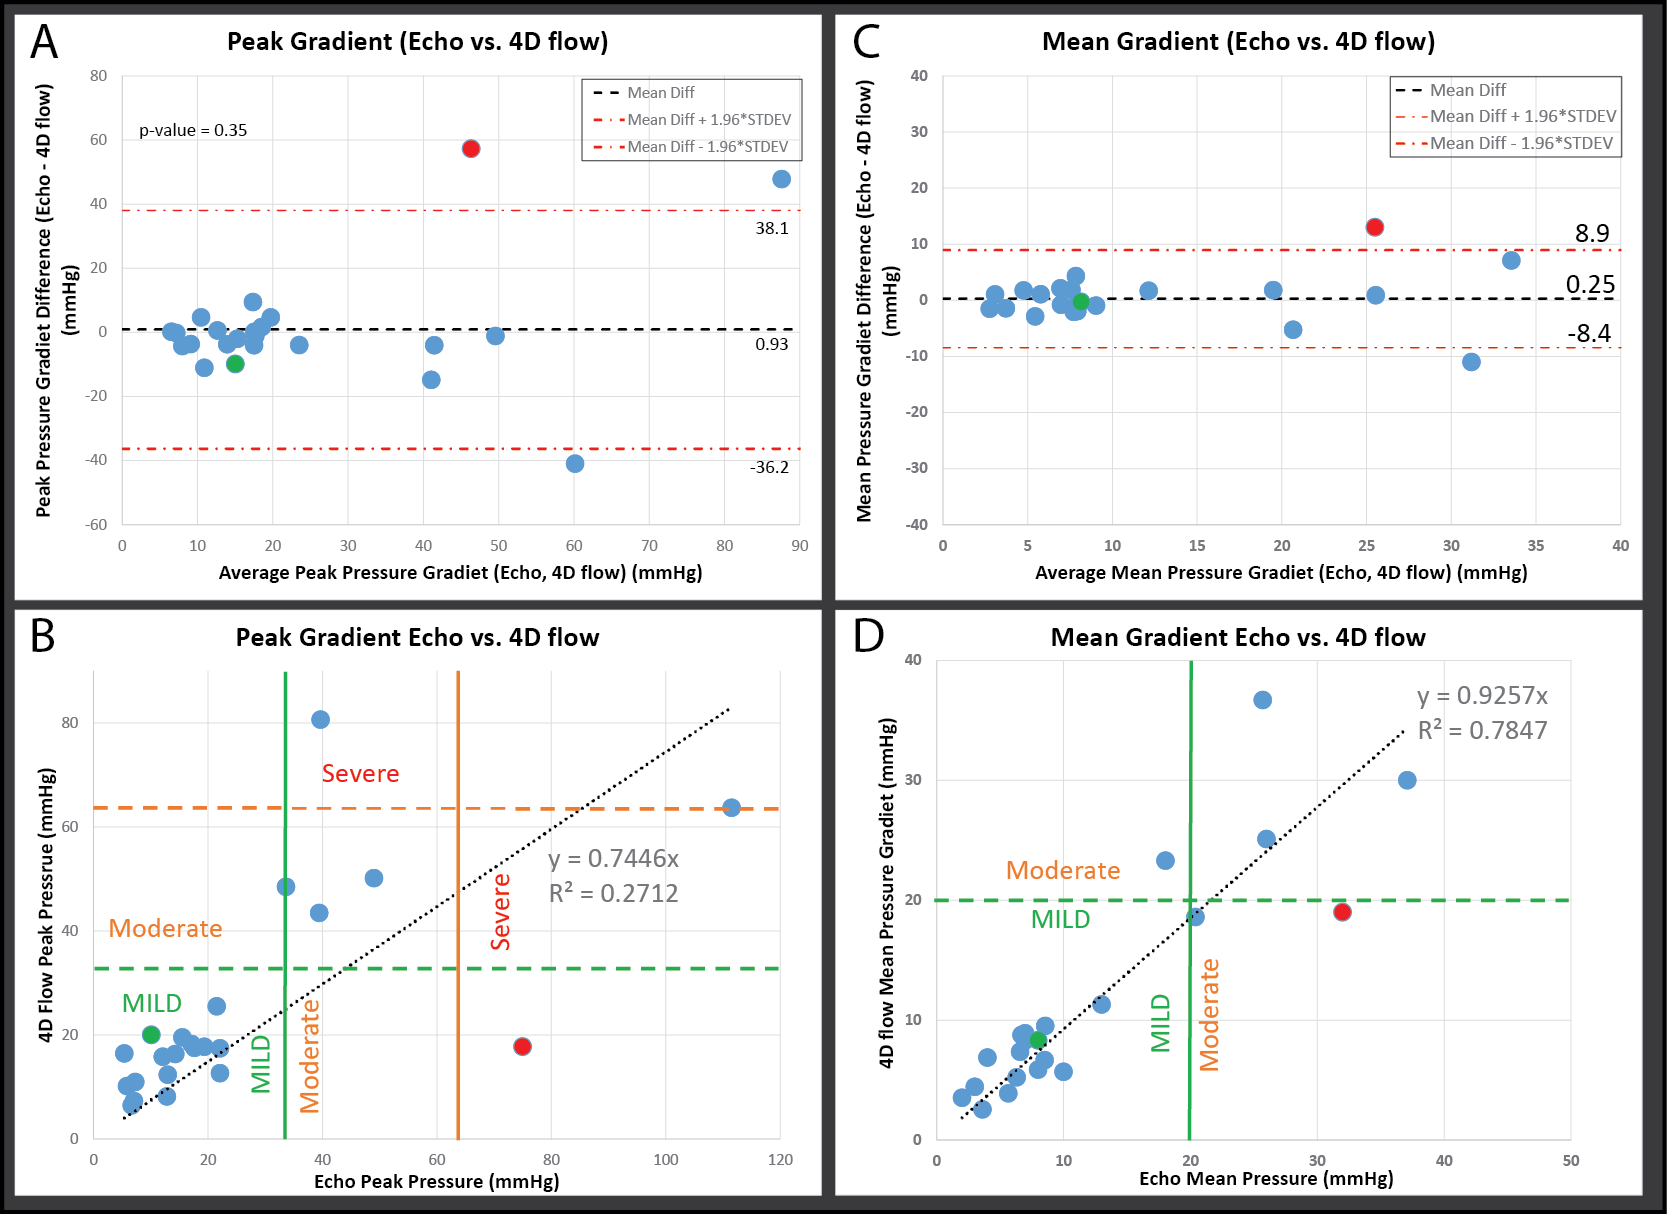
Doppler and 4D flow velocity-time curve plots are shown in Figure 1. The mean time difference between echo and 4D flow studies was 2.4 months. 4D flow and echo showed no significant difference in either peak (24.2 ± 19.5 vs. 25.1 ± 25.1 mmHg, p=0.35) or mean pressure gradient (11.7 ± 9.2 vs. 11.9 ± 9.8 mmHg, p=0.98). Bland-Altman (Figure 2) analysis illustrates the bias between 4D flow and echo for both peak and mean pressure gradients (0.93 and 0.25 mmHg) and limits of agreement (±37.14 and ±8.68 mmHg). However, the slope and correlation between 4D flow and Doppler improved when comparing peak (b=0.74, r2=0.27) to mean pressure gradient (b=0.93, r2= 0.78, Figure 2).Discussion and Conclusion
The relatively large limits of agreement suggest some disagreement between 4D flow and echo, which may be associated with time between exams, differences in anesthesia levels, or measurement error; however, this error is seemingly not systematic (as seen with the low bias). Nonetheless, an apparent underestimation occurs in the regression analysis of the peak pressure gradient (Figure 2 B) between 4D flow and echocardiography. 4D flow mean pressure gradients correlated better with echo, suggesting this approach may help close the gap between MRI and echo when measuring transvalvular pressure gradients. This study is limited by its small cohort and differences in scan dates between echo and MRI. Future studies investigating this approach can benefit from concurrent intermodality measurements.Acknowledgements
Grant support was provided by NIH R01HL115828 and K25HL119608References
1. Otto CM. Valvular aortic stenosis: Disease severity and timing of intervention. Journal of the American College of Cardiology. 2006;47:2141-2151
2. Markl M, Harloff A, Bley TA, Zaitsev M, Jung B, Weigang E, Langer M, Hennig J, Frydrychowicz A. Time-resolved 3d mr velocity mapping at 3t: Improved navigator-gated assessment of vascular anatomy and blood flow. Journal of magnetic resonance imaging : JMRI. 2007;25:824-831
3. Rose MJ, Jarvis K, Chowdhary V, Barker AJ, Allen BD, Robinson JD, Markl M, Rigsby CK, Schnell S. Efficient method for volumetric assessment of peak blood flow velocity using 4d flow mri. Journal of magnetic resonance imaging : JMRI. 2016
4. American
College of C, American Heart Association Task Force on Practice G, Society of
Cardiovascular A, Bonow RO, Carabello BA, Chatterjee K, de Leon AC, Jr., Faxon
DP, Freed MD, Gaasch WH, Lytle BW, Nishimura RA, O'Gara PT, O'Rourke RA, Otto
CM, Shah PM, Shanewise JS, Smith SC, Jr., Jacobs AK, Adams CD, Anderson JL,
Antman EM, Fuster V, Halperin JL, Hiratzka LF, Hunt SA, Lytle BW, Nishimura R,
Page RL, Riegel B. Acc/aha 2006 guidelines for the management of patients with
valvular heart disease: A report of the american college of cardiology/american
heart association task force on practice guidelines (writing committee to
revise the 1998 guidelines for the management of patients with valvular heart
disease) developed in collaboration with the society of cardiovascular
anesthesiologists endorsed by the society for cardiovascular angiography and
interventions and the society of thoracic surgeons. Journal of the American College of Cardiology. 2006;48:e1-148
Figures