3223
Energy-loss in Fontan Circulation Develops Heterogeneous Pulmonary Perfusion: Hybrid Analysis of 2D Vortex Flow Map and 4D Flow MRI1Diagnostic Imaging & Nuclear Medicine, Tokyo Women's Medical University, Tokyo, Japan, 2Clinical Reserch for ACHD, Tokyo Women's Medical University, 3Pediatric Cardiology, Tokyo Women's Medical University, 4Radiological service, Tokyo Women's Medical University, 5Clinical Application Development Marketing Division, Ziosoft Inc, 6Clinical Radiology, Kyushu University, 7Cardiovascular Medicine, Kyushu University, 8Pediatrics, Kyushu University, 9Philips Electronics Japan
Synopsis
Patients with Fontan-operation, single-ventricle heart frequent have systematic collaterals that increase pulmonary blood flow. The competitive flow elevates pulmonary artery pressure, a process leading to erosion of flow energy. We developed a novel post-processing of 2D cine MRI named for “vortex flow map” to evaluate the energy-loss in Fontan-circuit. Vortex flow map shows energy-loss as small magnitude of vortex flow (MVF) and reveals the relation to heterogeneous pulmonary perfusion. In total cavopulmonary conversion, 4D flow can visualize energy-loss caused by a meandering extra-cardiac conduit and the conflict flow, leading to reduce unilateral lung perfusion.
PURPOSE
Patients with Fontan-operation, single-ventricle heart frequent have systematic collaterals that increase pulmonary blood flow. The competitive flow elevates right-sided pressures, thereby inhibiting both systemic venous return to the pulmonary arteries and the subsequent filling of a hemodynamically compromised systemic ventricle (1). Although this process leads to loss of flow energy, non-invasive imaging for the assessment of energy-loss in Fontan circulation is not established. The purpose of this study is to propose a novel 2D cine imaging “vortex flow map” to evaluate energy-loss in Fontan circulation, and to investigate the relation between energy-loss and the development of pulmonary perfusion heterogeneity using hybrid analysis of 4D flow MRI.METHOD
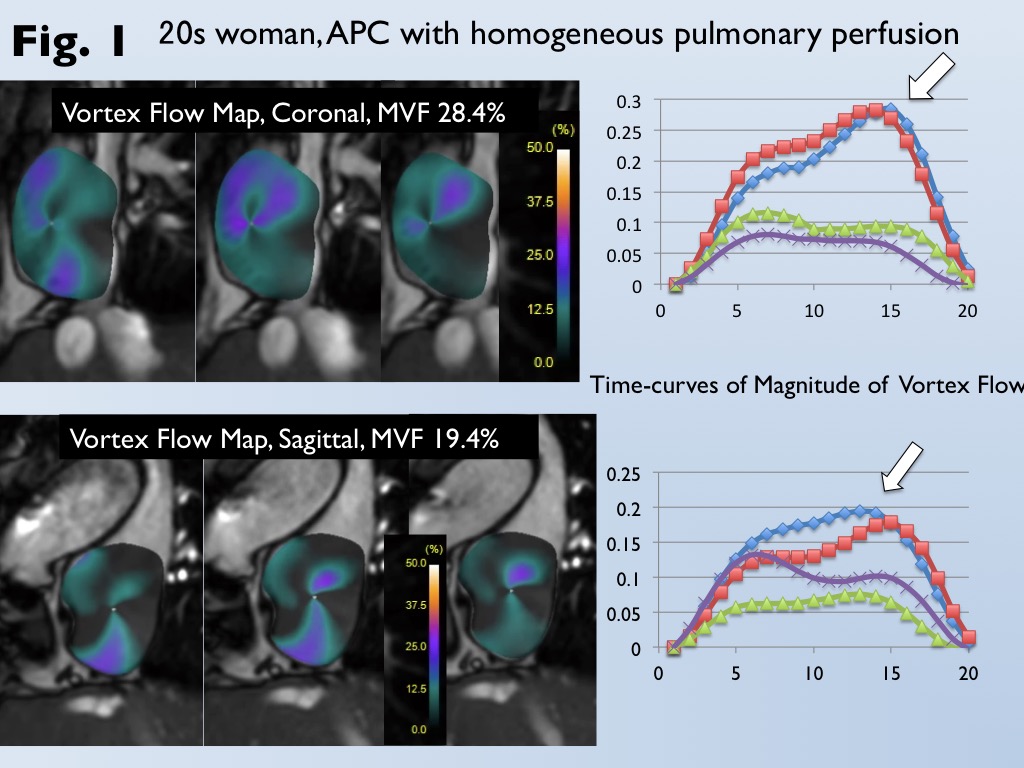
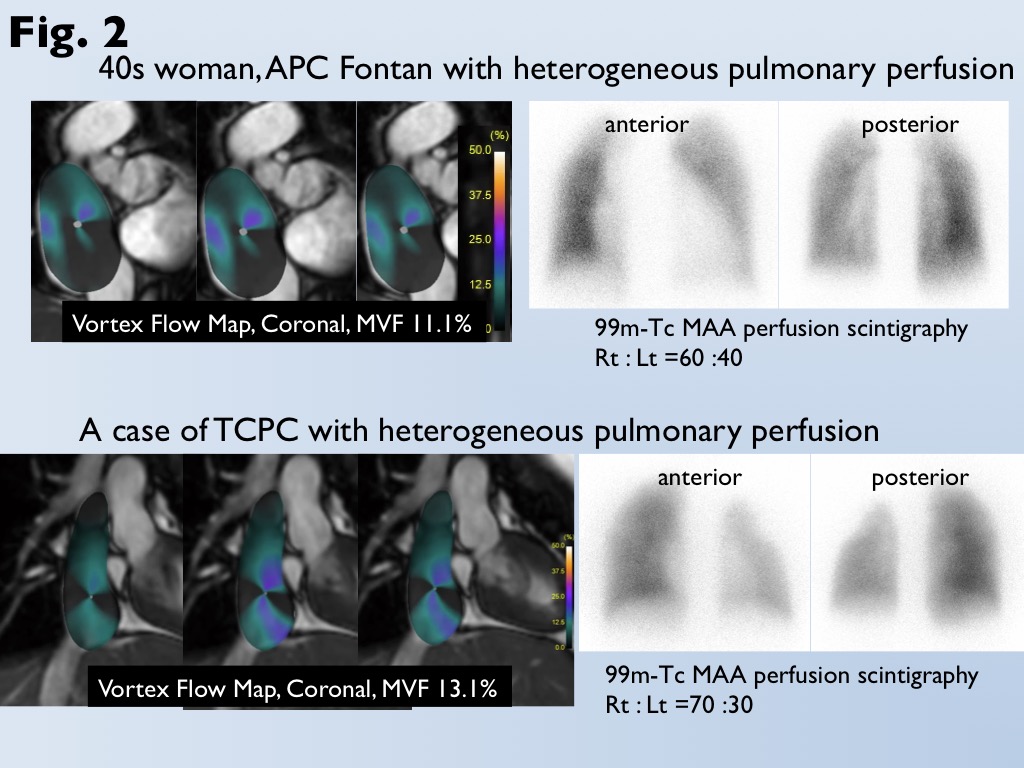
Data of cardiac MRI for 35 patients after atriopulmonary connection (APC) Fontan and 20 patients after total cavopulmonary conversion (TCPC) for single-ventricle heart were analyzed (mean age, 35). Conventional 2D cine images with 1.5-tesla MRI scanner (1.5 Tesla Gyroscan; Philips Healthcare) and balanced turbo field-echo sequence were scanned for the trans-axial, sagittal, and coronal cross-section of Fontan circuit. We developed “vortex flow map” that can demonstrate the ratio of the voxel movement at each phase to the total voxel movement throughout a cardiac cycle in the circumferential direction from the center of Fontan circuit. The maximum ratio was used as a magnitude of vortex flow (MVF, %) (Fig. 1). When MVF could not be measured for patients after TCPC due to narrow conduit, 4D flow with 3 Tesla (Achieva 3T Quasar Dual; Philips Healthcare) and flow-sensitive 3D gradient sequence was performed. 4D flow images were reconstructed using available software (GT flow; Gyrotools LLC) (2). Heterogeneous pulmonary perfusion was assessed by perfusion scintigraphy, and was identified as the reduced perfusion more than 20% in the affected lung against to the contralateral lung (Fig. 2). Comparison of MVF between patients with and without heterogeneous pulmonary perfusion was analyzed by the Mann-Whitney u-test. Receiver-operating-characteristic curve analysis was performed to determine optimal cutoff of MVF for prediction of heterogeneous pulmonary perfusion.RESULTS
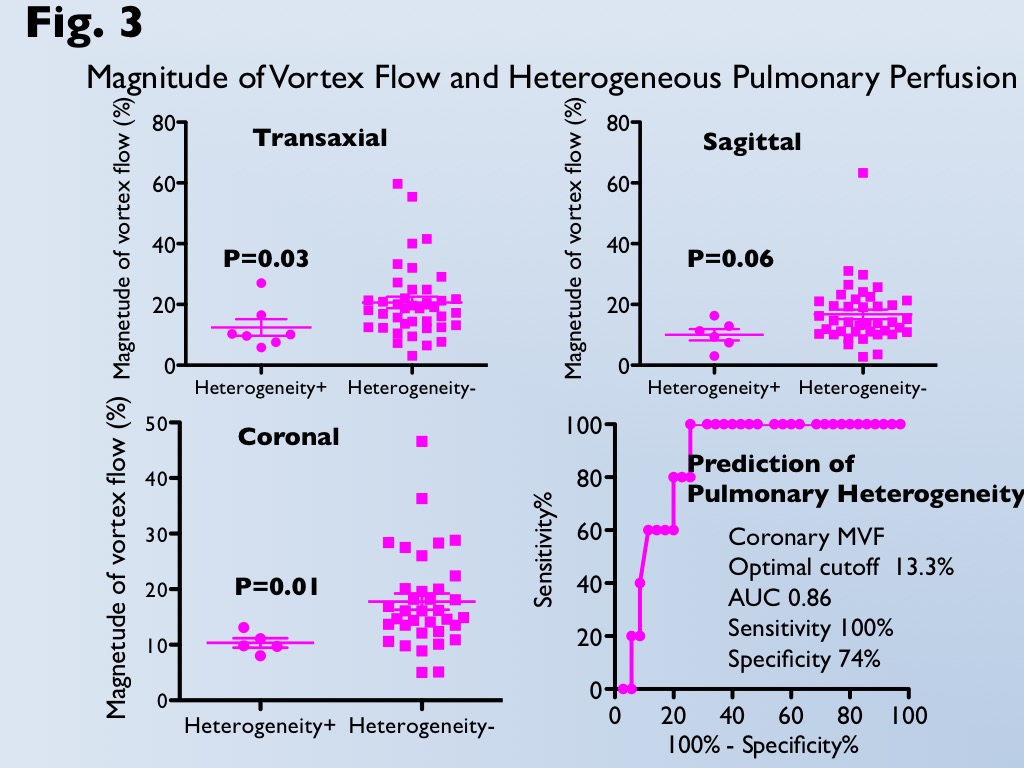
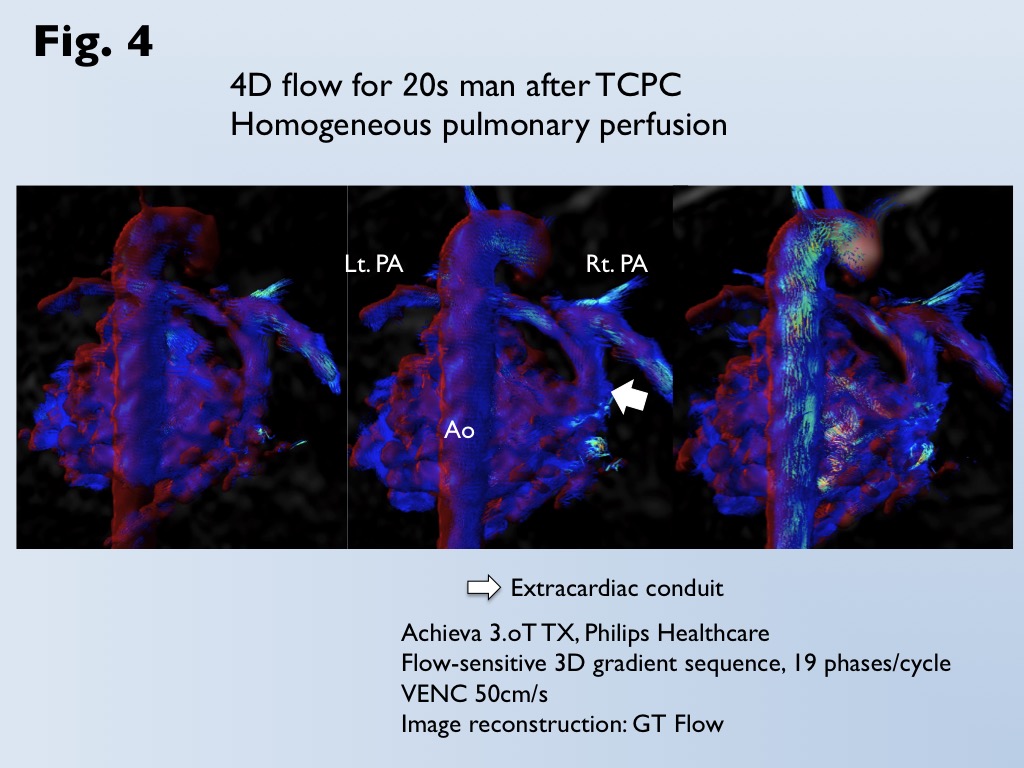
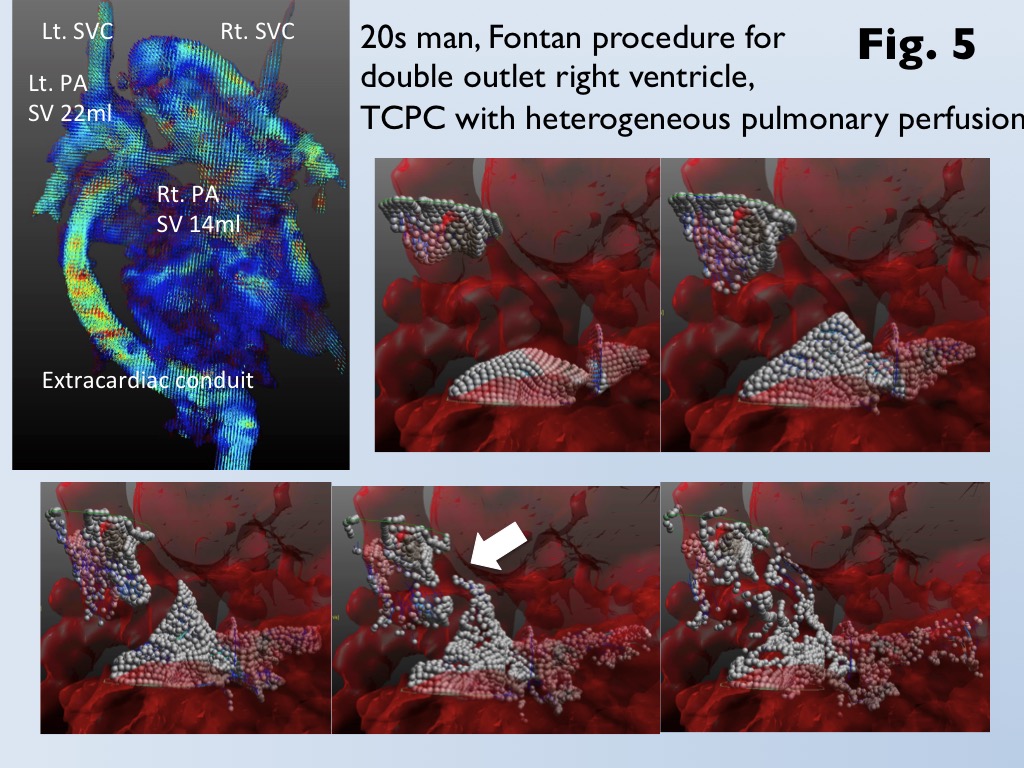
Heterogeneous pulmonary perfusion in 8 of 55 patients with was observed (3 after APC-Fontan, 5 after TCPC). MVF was for was significantly lower for patients with heterogeneous pulmonary perfusion than those without it (trans-axial MVF, 12.4±7.2% vs. 20.7±12.0%, p<0.05; sagittal MVF, 10.1±4.8% vs. 16.8±10.0%, p=0.06; coronal MVF, 10.3±1.9% vs. 17.8±8.8%, p=0.01). Use of the optimal cutoff of coronal MVF 13.3% can predict patients with heterogeneous pulmonary perfusion with an area under the curve of 0.86, sensitivity of 100%, and specificity of 74% (Fig 3). Since MVF could not be measured due to narrow conduit in 5 patients after TCPC, 4D flow MRI was performed. 4D flow shows homogeneous laminar flows in the bilateral pulmonary arteries from a relative short and straight extra-cardiac conduit (Fig. 4). On the other hand, 4D flow demonstrates the conflict with a long meandering extra-cardiac conduit and supra vena cava, leading to flow energy loss and reduced perfusion in the contralateral lung (Fig. 5).DISCUSSION
A recent technique, 4D MRI can visualize a vortex flow and can quantify wall shear stress and flow velocity (3, 4), whereas a special sequence and software are required. Moreover, data acquisition and post-processing analysis are time-consuming. Therefore, a clinical usage is still limited. On the conventional 2D cine imaging, dark flow artefact with steady state free precession or balanced turbo field-echo sequences is often seen in an enlarged Fontan circuit or normal right atrium, which is partially caused by spins moving within an inhomogeneous magnetic field (5). On the basis of voxel tracking and motion coherence technique, we have modified strain analysis of myocardial tagging image as an existing product (Ziostation 2, Ziosoft Inc,) (6). Finally, we developed vortex flow map that can quantify the turbulent flow mixed by the rapid fast inflow and the stagnation in the dilated Fontan circuit. We suppose that a reduced vortex flow is caused by the elevations of pulmonary artery pressure and pulmonary vascular resistance, resulting to the disturbance of passive pulmonary artery flow. We focused on developing a simple, easy and user-friendly 2D technique, which is expected for clinical contributions.CONCLUSION
Hybrid analysis of 2D vortex flow map and 4D flow MRI enables the quantification and visualization of flow energy-loss in Fontan circuit. Energy-loss by expressed as reduced vortex flow in Fontan circuit develops heterogeneous pulmonary perfusion. Coronal MVF can predict it at high accuracy. 4D flow is a helpful tool to detect flow energy-loss by the conflict flow with narrow conduit and supra vena cava in TCPC cases.Acknowledgements
This work was supported by the Japan Society for the Promotion of Science (JSPS) KAKENHI (16K10321).References
1. Ascuitto RJ, Ross-Ascuitto NT. Systematic-to-pulmonary collaterals: a source of flow energy loss in Fontan physiology. Pediatr Cardiol 2004; 25: 472-481.
2. Sakamoto I, Takemoto M, Nagao M, Yamamura K, Hiasa K, Sunagawa K. Giant pulsatile coronary aneurysm associated with pulmonary atresia with an intact ventricular septum after a Fontan procedure. Circulation 2014; 130: e121-e123.
3. Moyle KR, Mallinson GD, Occleshaw CJ, Cowan BR, Gentles TL. Wall shear stress is the primary mechanism of energy loss in the Fontan connection. Pediatr Cardiol 2006; 27: 309-315.
4. Kawakubo M, Akamine H, Yamasaki Y, Takemura A, Abe K, Hosokawa K, et al. Three-dimensional phase contrast magnetic resonance imaging validated to assess pulmonary artery flow in patients with chronic thromboembolic pulmonary hypertension. Radiol Phys Technol 2016 doi: 10.1007/s12194-016-0383-0.
5. Li W, Storey P, Chen Q, Li BS, Prasad PV, Edelman RR. Dark flow artifacts with steady-state free precession cine MR technique: causes and implications for cardiac MR imaging. Radiology. 2004; 230: 569-575.
6. Yamasaki Y, Nagao M, Abe K, Hosokawa K, Kawanami S, Kamitani T, et al. Balloon pulmonary angioplasty improves intervenetricular dyssynchrony in patients with inoperable chronic thromboembolic pulmonary hypertension: a cardiac MR imaging study. Int J Cardiovasc Imaging 2016 doi: 10.1007/210554-016-0985-y
Figures