3222
Evaluate right ventricle-pulmonary artery interaction in patients with repaired tetralogy of Fallot by 4D flow-derived kinetic energy1National Tsing Hua University, Hsinchu, Taiwan, 2Department of Radiology, Kaohsiung Veterans General Hospital, Kaohsiung, Taiwan, 3Department of Pediatrics, Kaohsiung Veterans General Hospital, Kaohsiung, Taiwan, 4Department of Medical Imaging, National Taiwan University Hospital, Taipei, Taiwan, 5Medical Physics, Department of Radiology, University Hospital Freiburg, Freiburg, Germany
Synopsis
We quantified the kinetic energy (KE) of intraventricular RV flow (KERV,flow), PA forward flow (KEPA) and PA retrograde flow (KEPA,regur). The purpose is to establish 4D flow-derived KE-related indices for better understanding of the RV-PA interaction. We observed the interaction between RV and PA by assessing the correlation between diastolic KEPA,regur and late diastolic KERV,flow as well as between systolic KEPA and RV mean pressure. In conclusion, we verified that altered hemodynamic conditions of RV interacted with severe PR, which may lead to RV overloading pathology and adverse outcome in rTOF patients.
Introduction
Residual pulmonary regurgitation (PR) can lead to right ventricular (RV) injury in patients with repaired tetralogy of Fallot (rTOF).1, 2 Nowadays, the determinant of cardiac performance mainly relies on RV anatomic and global functional parameters.3 Moreover, the influence of PR on ventricular tachycardia and sudden death has been reported by Gatzoulis et al.4 Although Geva et al mentioned that the pathological process of RV is coupled with pulmonary system,5 less is known about the interaction of RV and main pulmonary artery (PA). In this study, we quantified the kinetic energy (KE) of intraventricular RV flow (KERV,flow), PA forward flow (KEPA) and PA retrograde flow (KEPA,regur). We aim to establish 4D flow-derived KE-related indices for better understanding of the RV-PA interaction.Method
This study recruited 15 rTOF patients (22.9±3.4 y/o, male/female: 12/3) and 15 age-matched normal subjects (22.1±1.2 y/o male/female: 8/7) without any known cardiovascular diseases. Images were acquired at a 3.0-T MR scanner (Tim Trio or Skyra, Siemens, Erlangen, Germany). All subjects underwent 4D flow MRI (TR/TE=10.8/2.9 ms, flip angle=7°, VENC=1.5 m/s, voxel size=1.2×1.2×3.5 mm3). Prospective ECG-triggering and navigator-echo were performed to synchronize with cardiac and respiratory motion, respectively.
In Figure 1, the planes for computing KERV,flow and KEPA or KEPA,regur were determined manually on a 4-chamber view for RV and on a 3D angiogram for PA. The kinetic energy was calculated as:
$$ KE=\frac{1}{2}\times\rho\times V\times v^{2} $$
where ρ was blood density with a value of 1060 kg/m3, V denoted voxel volume, and v represented the voxel velocity. The late diastolic KERV,flow was calculated as the summation of RV intraventricular KE on a 4-chamber view during the period from peak KERV,flow to the end of the cardiac cycle. We characterized the histogram of late diastolic KERV,flow by several indices, including the total, maximum, second quartile (Q2), and third quartile (Q3) for each subject. Further, the top 5% of the KERV,flow in the histogram was selected as the local maximum, and voxels with KERV,flow greater than local maximum were labeled as high KE region. The mean KE value and the area of the high KE region were also determined.
Two-tailed Student t test was used to assess the statistically significant difference. A P value<0.05 was considered statistically significant. The Pearson correlation coefficient was calculated when appropriate.
Results
Table 1 summarizes the basic characteristics of cardiac function and pressure-related indices of the study population. rTOF patients were with the presence of RV dilation but preserved RV ejection fraction (P = 0.154). All pressure indices in rTOF group were significantly higher than the normal standards reported by AHA, suggesting that patients presented pressure overload.
As illustrated in Figures 2a and 2b, the rTOF group presented substantial higher KERV,flow and KEPA during late diastolic period (after 180 %ES) and the whole time course, respectively. The increased KEPA after 160 %ES can be attributed to the regurgitation flow. In Figure 2c, higher summation of KEPA and KEPA,regur over the whole time course were observed in rTOF group (both P<0.01).
As shown in Figures 3a and 3b, a normal subject typically demonstrated a narrower distribution of late diastolic KERV,flow than an rTOF patient, reflected by the lower maximum (0.09 mJ vs. 0.20 mJ). Figure 3c presents the characterized indices of the histogram distribution of the two groups. The rTOF group demonstrated significantly larger maximum, Q2, and total KERV,flow (all with P<0.05). As for high KE area, rTOF group exhibited higher local maximum and sum high KE than normal group (both P<0.05), implying the RV flow in rTOF group maintains at high energy level during the late diastolic period.
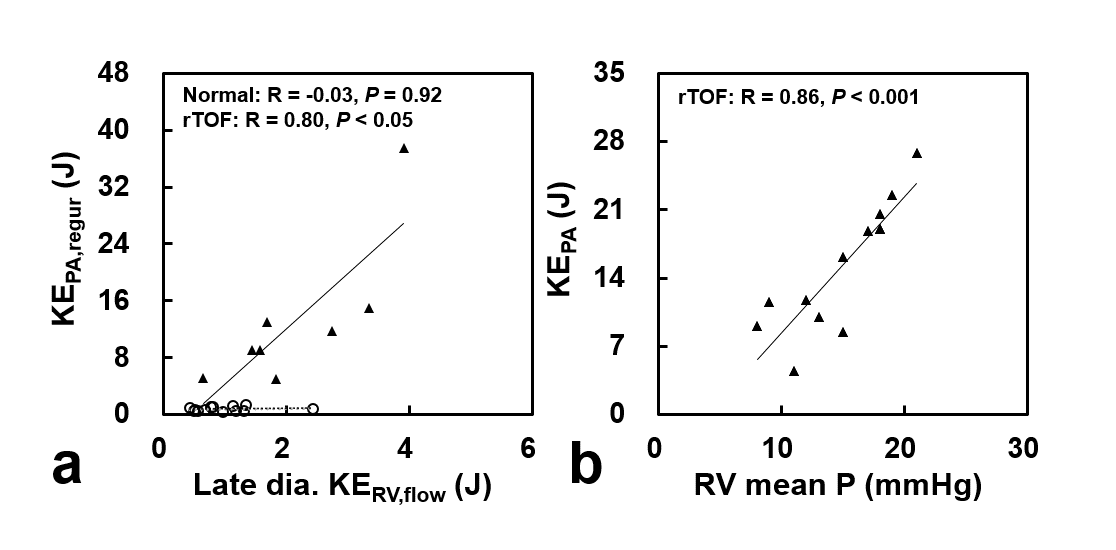
In rTOF group, total late diastolic KERV,flow correlated with KEPA,regur (R=0.80, P<0.05), as illustrated in Figure 4a. Further, Figure 4b illustrates a strong positive correlation between KEPA and RV mean pressure in rTOF group (R=0.86, P<0.001).
Discussion
In this study, the rTOF patients demonstrated significantly higher diastolic KERV,flow, increased systolic KEPA, higher diastolic KEPA,regur, and abnormal late diastolic KERV,flow distribution. We observed the interaction between RV and PA by assessing the correlation between diastolic KEPA,regur and late diastolic KERV,flow as well as between systolic KEPA and RV mean pressure. Our finding is consistent with the previous study with visualization of flow patterns in right heart.6
In conclusion, we verified that altered hemodynamic conditions of RV interacted with severe PR, which may lead to RV overloading pathology and adverse outcome in rTOF patients. To assess the RV-PA interaction by evaluating KE can help to monitor the abnormal hemodynamics and establish 4D flow-derived KE-related indices in rTOF patients.
Acknowledgements
No acknowledgement found.References
1. Geva T. Indications and timing of pulmonary valve replacement after tetralogy of Fallot repair. Seminars in Thoracic and Cardiovascular Surgery: Pediatric Cardiac Surgery Annual. 2006;9:11-22.
2. Helbing WA, Niezen RA, Le Cessie S, Van Der Geest RJ, Ottenkamp J and De Roos A. Right ventricular diastolic function in children with pulmonary regurgitation after repair of tetralogy of Fallot: volumetric evaluation by magnetic resonance velocity mapping. Journal of the American College of Cardiology. 1996;28:1827-1835.
3. Geva T. Repaired tetralogy of Fallot: the roles of cardiovascular magnetic resonance in evaluating pathophysiology and for pulmonary valve replacement decision support. Journal of Cardiovascular Magnetic Resonance. 2011;13:1.
4. Gatzoulis MA, Balaji S, Webber SA, Siu SC, Hokanson JS, Poile C, Rosenthal M, Nakazawa M, Moller JH and Gillette PC. Risk factors for arrhythmia and sudden cardiac death late after repair of tetralogy of Fallot: a multicentre study. The Lancet. 2000;356:975-981.
5. Kussmaul WG, Noordergraaf A and Laskey WK. Right ventricular-pulmonary arterial interactions. Annals of biomedical engineering. 1992;20:63-80.
6. François CJ, Srinivasan S, Schiebler ML, Reeder SB, Niespodzany E, Landgraf BR, Wieben O and Frydrychowicz A. 4D cardiovascular magnetic resonance velocity mapping of alterations of right heart flow patterns and main pulmonary artery hemodynamics in tetralogy of Fallot. Journal of Cardiovascular Magnetic Resonance. 2012;14:1.
Figures
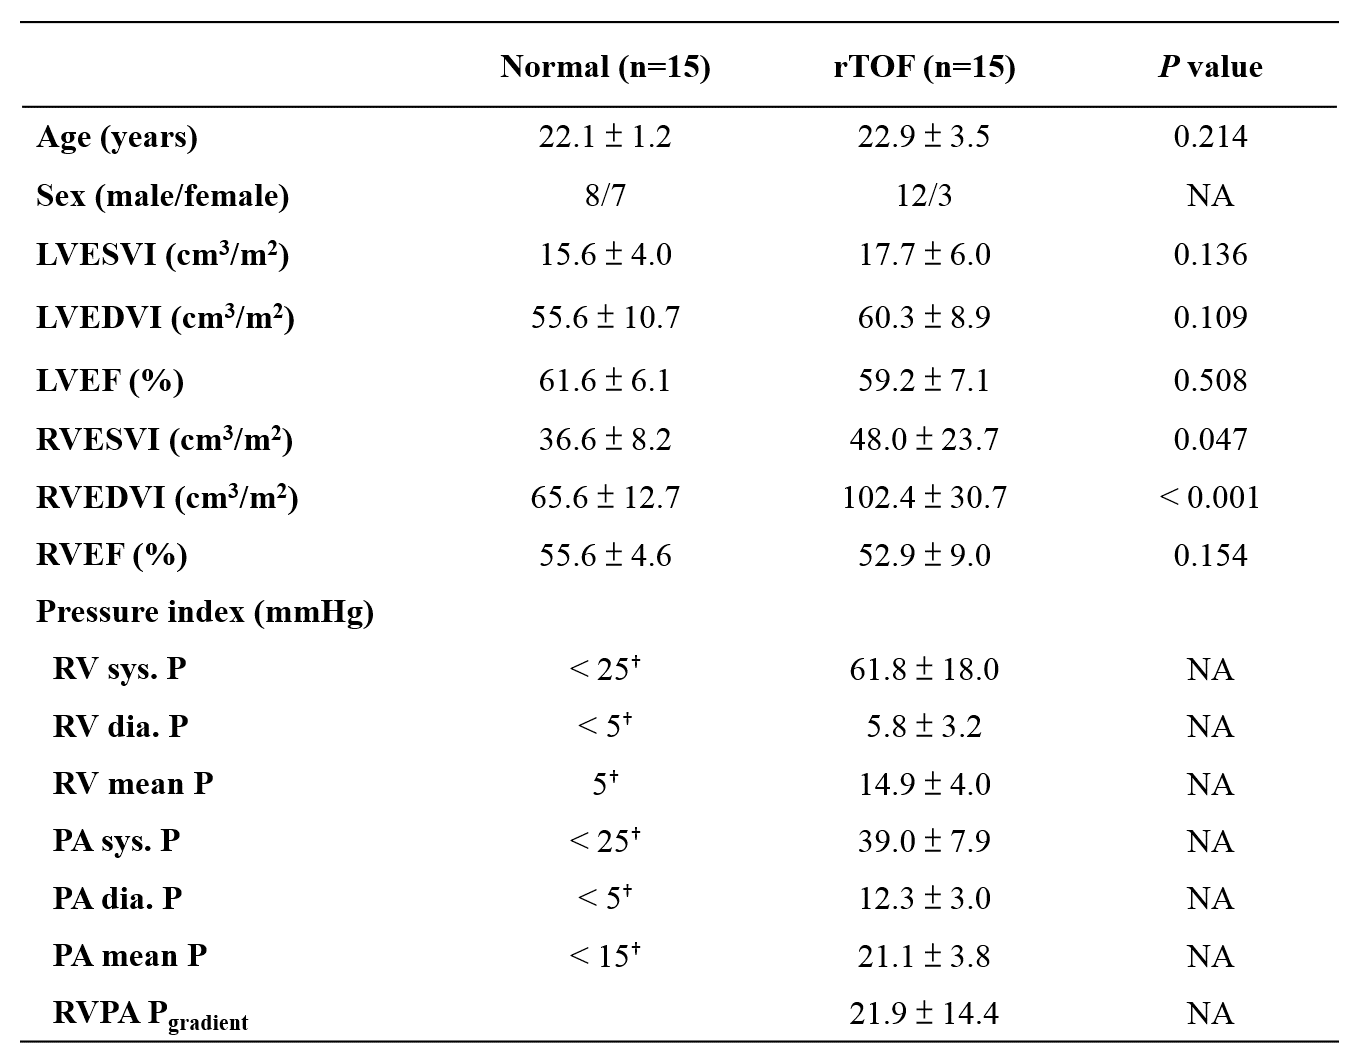
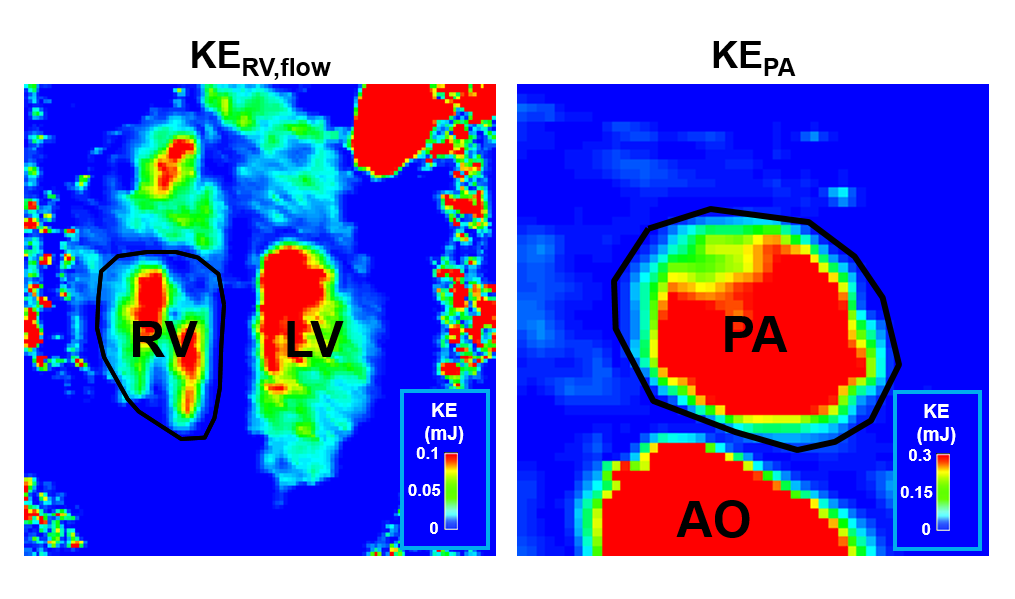
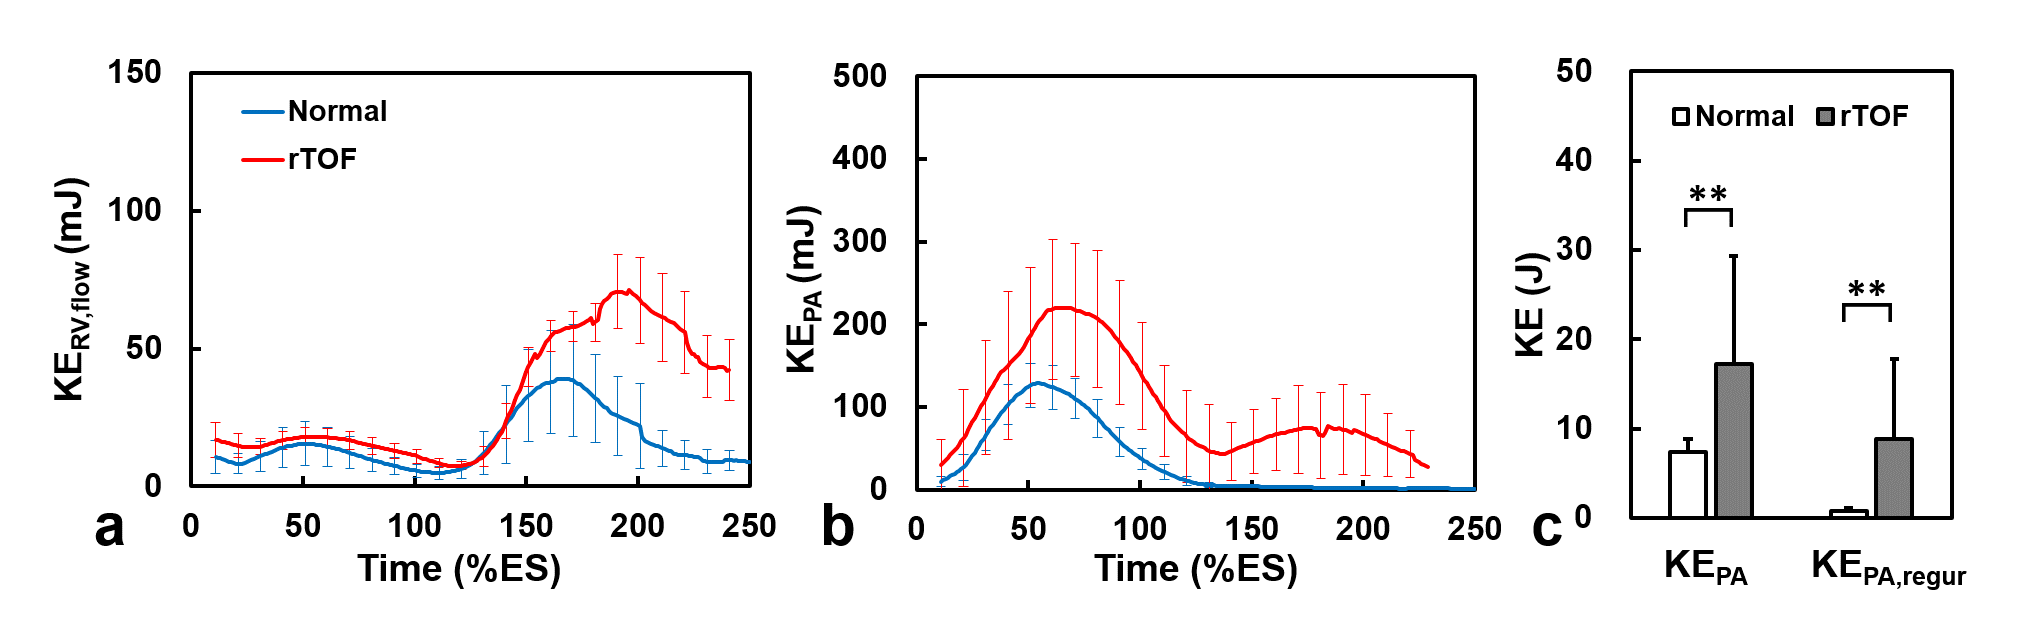
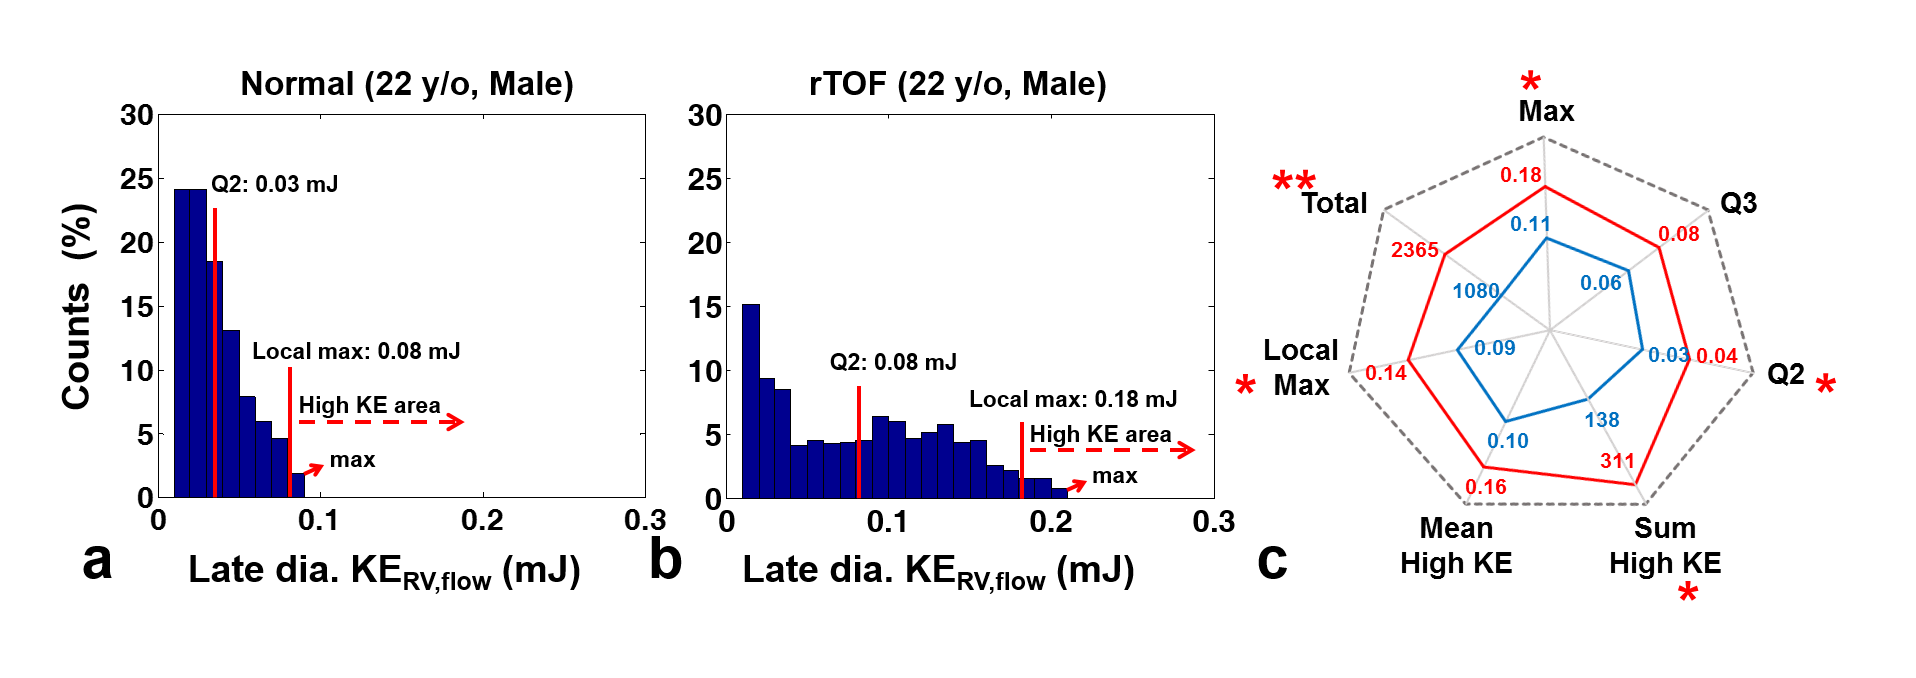
Figure 3. Late dia. KERV,flow histogram and characterizing indices. (a,b) Typical histogram from a normal subject (22 y/o male) and an rTOF patient (22 y/o male). The rTOF patient presented a bimodal distribution with a wider range of KERV,flow. (c) The rTOF group exhibited increased KERV,flow values in most of indices. *P < 0.05, **P < 0.01.