3220
Respiratory changes in pulmonary flow distribution in Fontan circulation using “5-D” flow MRI1Mechanical Engineering, UW Madison, Madison, WI, United States, 2Radiology, UW Madison, Madison, WI, United States, 3Biomedical Engineering, UW Madison, Madison, WI, United States
Synopsis
The purpose of this study was to evaluate the respiratory effects on particle trace distribution from the vena cava to the pulmonary arteries in single ventricle patients with TCPC. Six patients were imaged using PC-VIPR and a scheme that allows for double gating to the ECG and respiratory cycles, providing flow data for separate respiratory phases. Results displayed a non-equal flow distribution to the pulmonary arteries from the vena cava and a significant difference in pulmonary flow distribution between inspiration and expiration. This may indicate the importance accounting for respiratory cycle variations when interpreting clinical TCPC results.
BACKGROUND
Altered hemodynamics in total cavopulmonary connection (TCPC), a palliation of single ventricle defects, can result in long-term complications.1,2 An important complication is the formation of artero-venous malformations in the lungs which is thought to arise from unbalanced flow distribution to the pulmonary arteries from the hepatic veins through the Fontan. Furthermore, the magnitude of these alterations may be different in expiration and inspiration due to the transient nature of the respiratory cycle. Such effects may be examined with 4D flow MRI using radial projections (PC-VIPR3), which allows for flexible retrospective sorting of data, adding a fifth dimension. The purpose of this study was to evaluate the respiratory effects on particle trace distribution from the vena cava to the pulmonary arteries in single ventricle patients with TCPC.METHODS
In this IRB-approved and HIPAA-compliant study, six (6) patients with TCPC (2M/4F, 24 ± 5.9 years old, 59.8 ± 7 kg) were imaged on a 3T system (Discovery MR750, GE Healthcare) using PC-VIPR prescribed over a large chest imaging volume (FOV = 32 x 32 x 32 cm3, TR/TE = 5.5/2.3 ms, α = 15°, Venc = 150 cm/s, projection number ≈ 22000, 16 reconstructed cardiac time frames, scan time: 11 minutes 30 seconds). A scheme was implemented that allows for double gating to the ECG and respiratory cycles so that two data sets were produced for each patient: expiration and inspiration4,5. Both inspiration and expiration data sets were exported to an advanced software package (EnSight, CEI) for visualization and quantification. The distribution of flow was analyzed by emitting three-hundred particle traces from the inferior vena cava (IVC) and superior vena cava (SVC) planes to produce streamlines throughout the model. A streamline analyzer tool was then used to count the number of particles that flowed through each plane of the model. The number of particles passing through each pulmonary branch were recorded based on their origin (IVC or SVC), and flow percentages were obtained. This process was performed for both inspiration and expiration plateaus for each patient. Differences between cycles were analyzed statistically with a 2-sided t-test with a significance level of p<0.05.RESULTS
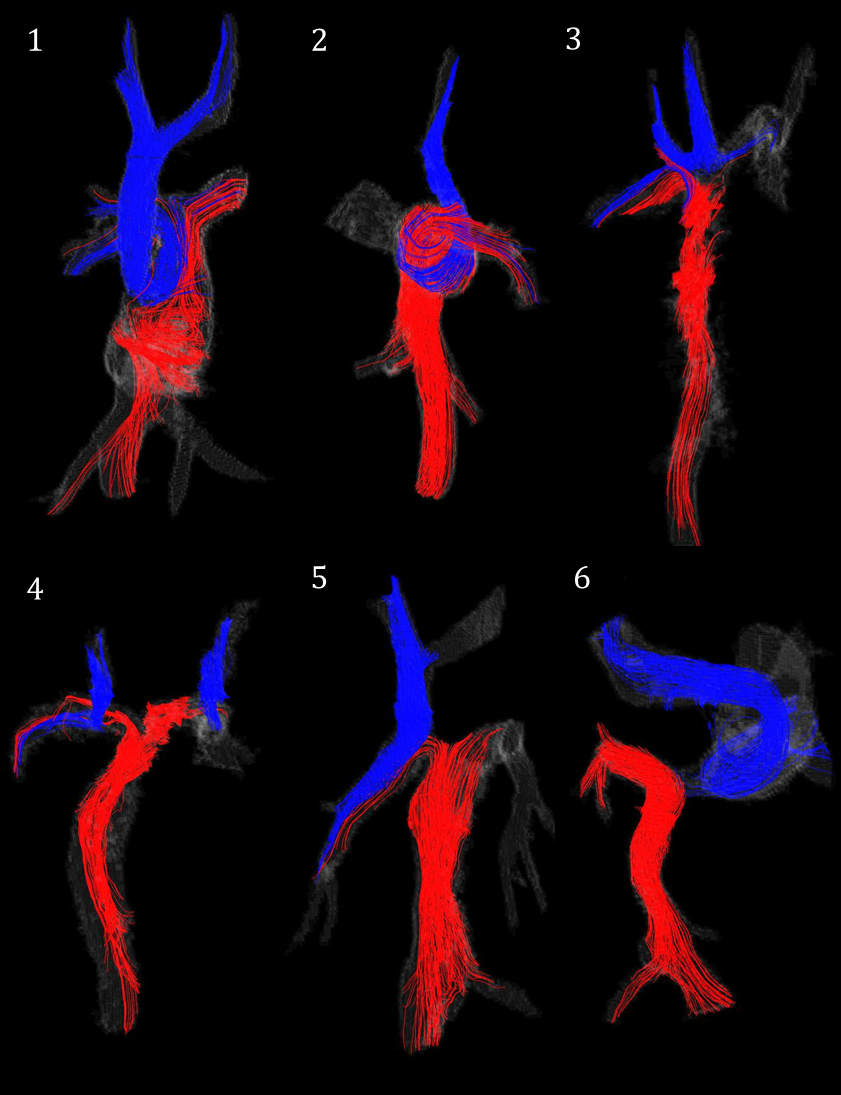
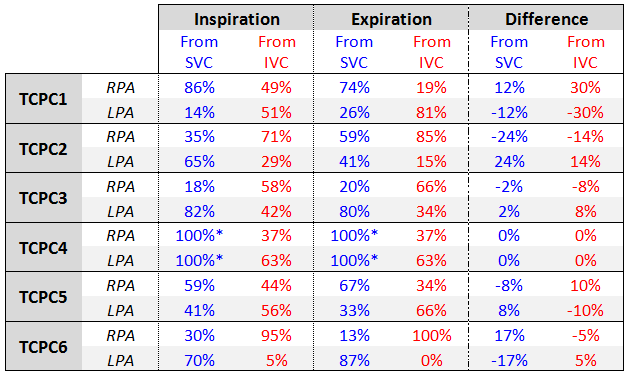
The streamlines that were used to analyze the particle distribution in each patient are shown in Figure 1. The flow distribution percentages obtained from the particle trace analysis for each pulmonary branch, from both the IVC and SVC, during both respiratory cycles are displayed in Table 1. Note that the TCPC of patient 4 includes two superior vena cava connections, which produced unique flow distribution results. A significant difference was seen in the pulmonary flow distribution from the SVC between inspiration and expiration cycles (p=0.009). A significant difference was also observed for the flow distribution from the IVC between respiratory cycles (p=0.025).DISCUSSION and CONCLUSION
Respiratory gated 4D flow MRI data on the TCPC of six patients was analyzed to determine the contribution of SVC and IVC flow to the flow distribution in the pulmonary arteries during expiration and inspiration. The flow from vena cava distributed unequally to the right and left pulmonary arteries in every case, except for case 4, which presented a unique dual SVC. This uneven distribution may have negative implications for downstream pulmonary function such as artero-venous malformations in the lungs. The flow distributions varied between patients, with the most severe discrepancy seen in case 6, where the superior and inferior vena cava distribute almost completely to the left and right pulmonary branches, respectively. A significant difference was also observed between expiration and inspiration distributions. If not accounted for, this difference may alter the interpretation of clinical results.Acknowledgements
We gratefully acknowledge funding by AHA grant 14SDG19690010 (AR), NIH awards UL1TR000427, TL1TR000429NIH, and 2R01HL072260, and GE Healthcare for their assistance and support.References
1. Khairy P1, Fernandes SM, Mayer JE Jr, Triedman JK, Walsh EP, Lock JE, Landzberg MJ. “Long-term survival, modes of death, and predictors of mortality in patients with Fontan surgery.” Circulation. 2008 Jan 1;117(1):85-92
2. Körperich H1, Barth P2, Gieseke J3, Müller K4, Burchert W2, Esdorn H2, Kececioglu D4, Beerbaum P5, Laser KT4. “Impact of respiration on stroke volumes in paediatric controls and in patients after Fontan procedure assessed by MR real-time phase-velocity mapping.” Eur Heart J Cardiovasc Imaging. 2015 Feb;16(2):198-209
3. Johnson, K M, O Wieben, and A A Samsonov. "Phase-contrast velocimetry with simultaneous fat/water separation." Magnetic Resonance in Medicine Magn. Reson. Med. 63.6 (2010): 1564-574
4. Alejandro Roldán-Alzate, Eric Schrauben, Oliver Wieben, and Christopher J Francois. “Kinetic Energy Distributions in Fontan Circulation - Evaluation of Respiration Effects.” ISMRM, Singapore, May 7-13, 2016.
5. Schrauben EM, Anderson AG, Johnson KM, Wieben O. “Respiratory-induced venous blood flow effects using flexible retrospective double-gating.” J Magn Reson Imaging. 2015 Jul;42(1):211-6
Figures