3219
UNFOLDed Spiral SPiRIT Phase Contrast Velocity Mapping for Scan Time Reduction of Coronary Blood Flow Measurements1Radiology – Medical Physics, Medical Center – University of Freiburg, Freiburg, Germany
Synopsis
Coronary flow measurements can provide important information, e.g. to assess coronary stenosis, but remain challenging due to the need for high spatio-temporal resolution in the presence of heart and respiratory motion. Progress has been made by using spiral acquisitions enabling data acquisition within a breath hold. We combined spiral SPiRIT flow measurements with UNFOLD, a technique that allows for further data undersampling and scan time shortening (here by a factor of 2), to achieve coronary flow measurements with a spatio-temporal resolution of 1×1×8mm³/<15.5msec. The combined UNFOLD-spiral approach was implemented into different spiral sampling patterns and evaluated in healthy volunteers.
Introduction
Measurements of coronary blood flow can provide important information on disease state, e.g. to assess coronary stenosis1. Although initial studies on MR-based phase contrast velocity mapping in the coronary arteries have been published about 20 years ago2-4, reliable assessment of coronary flow remains challenging due to the need for high spatio-temporal resolution in the presence of heart and breathing motion. Navigator-gating has been demonstrated to compensate breathing motion5,6, but might be hampered in case of irregular breathing so that spiral acquisitions with their efficient k-space coverage have been proposed5,7 to measure coronary flow in a single breath hold. Recently, a retrospectively ECG-gated breath hold (BH) spiral sequence collecting data within 17 heart beats (spatio-temporal resolution: 1.4×1.4x8 mm³/19 ms) was successfully validated against Doppler guidewire8. However, patients with cardiovascular diseases often suffer from shortness of breath so that BH for about 20 secs can be difficult. Therefore, scan time has to be as short as possible to avoid motion artifacts while maintaining sufficient spatio-temporal resolution for correct flow detection in small coronary vessels.
In this work, we combined spiral SPiRIT9,10 flow measurements with UNFOLD11,12, a technique that enables further data undersampling and thus shorter scan times while improving spatio-temporal resolution to 1.0×1.0x8 mm³/<15.5 ms. The combined UNFOLDed spiral-SPiRIT approach was implemented into different spiral sampling patterns and evaluated in healthy volunteers.
Methods
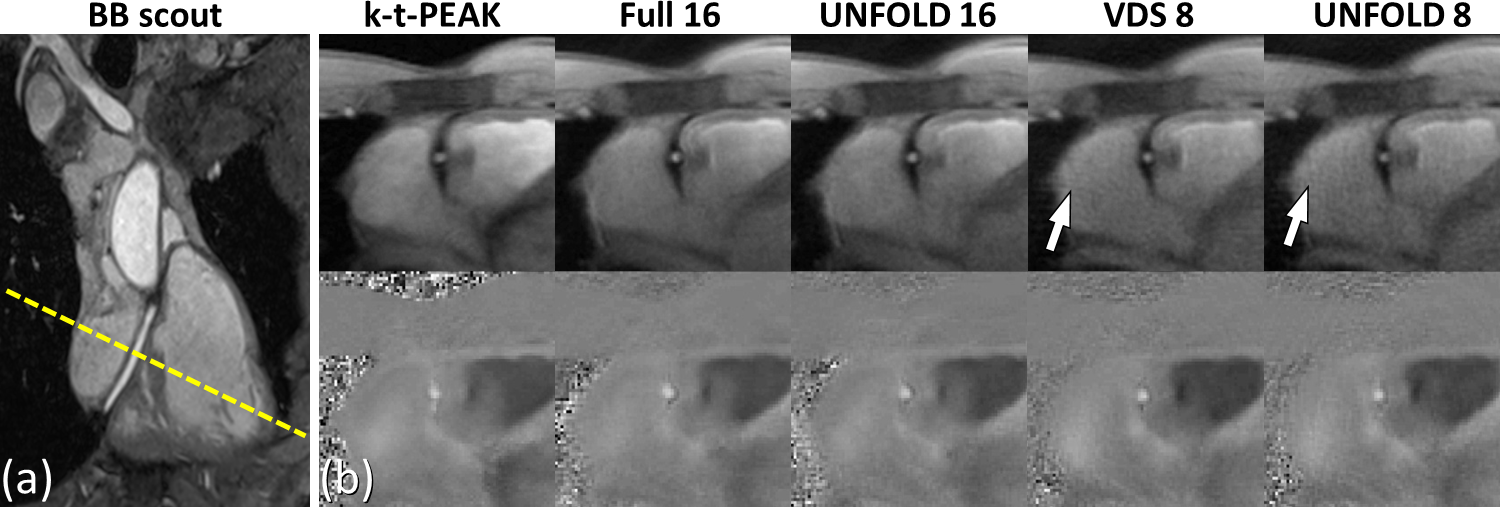
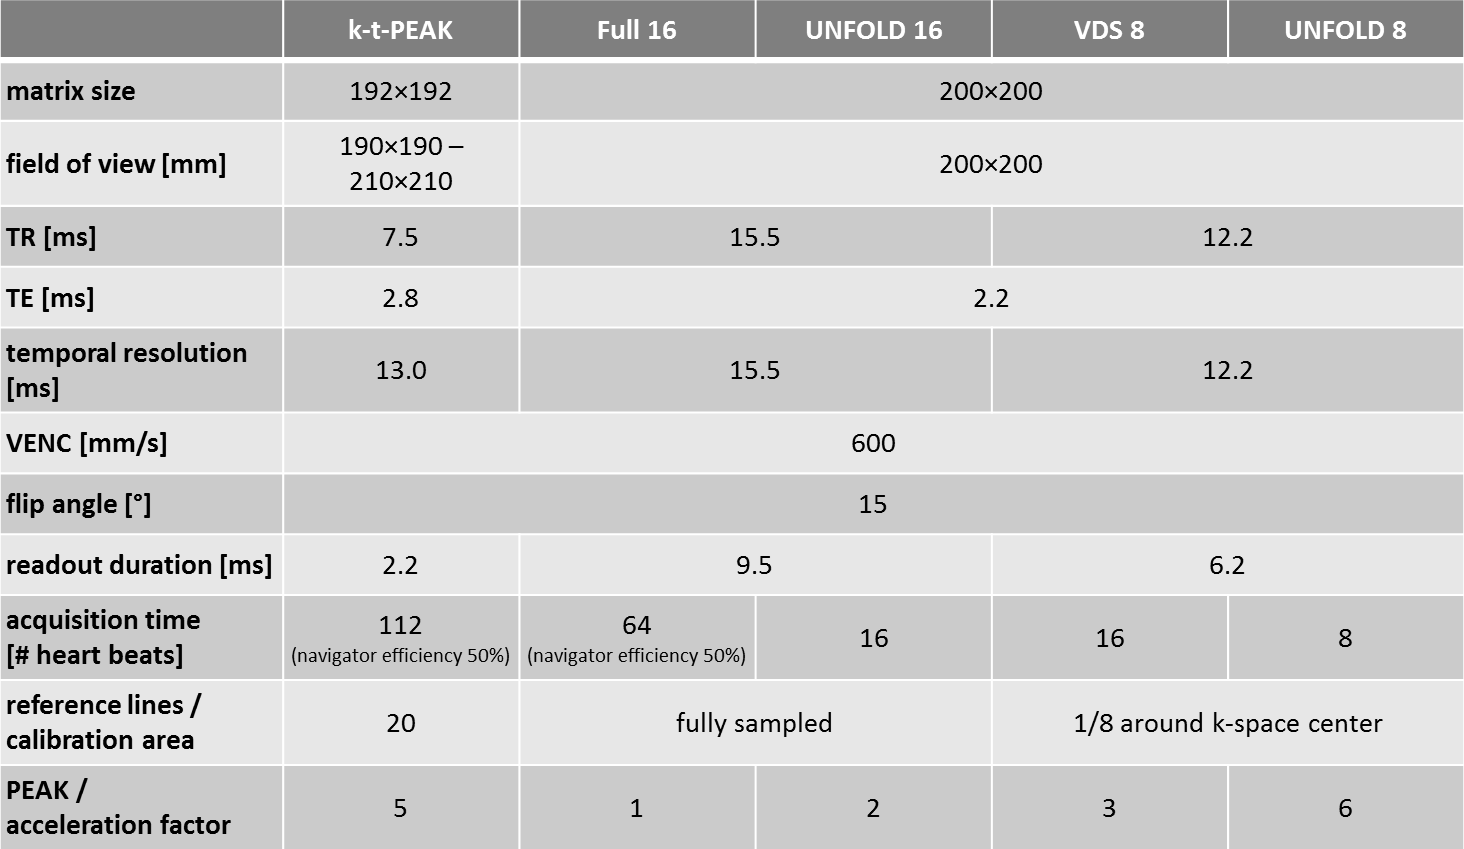
Phase contrast velocity mapping was done at 3T (Prisma, Siemens) with five different protocols in a straight proximal segment of the right coronary artery (RCA) of five healthy volunteers (4 male, age: 37±11 yrs). Navigator-gated, 3D bright-blood scout images were acquired to subsequently define a single slice for flow measurements perpendicular to the vessel’s main direction (Fig. 1a). The following five protocols with prospective ECG gating and through-plane velocity encoding (VENC = 600 mm/s) were applied: i) respiratory-gated k-t-accelerated13 (R = 5) Cartesian acquisition (‘k-t-PEAK’), ii) respiratory-gated spiral acquisition with 16 interleaves (‘Full 16’), iii) respiratory-gated/BH (depending on subject’s heart rate and resulting scan time) spiral acquisition with 16 interleaves and two-fold UNFOLD11,12 undersampling (‘UNFOLD 16’), iv) BH three-fold variable density spiral10 (VDS) acquisition with 8 interleaves (‘VDS 8’), v) three-fold VDS acquisition with 8 interleaves and two-fold UNFOLD undersampling (‘UNFOLD 8’). Further sequence parameters are summarized in Table 1.
UNFOLDing via forward Fourier transformation into k-f-space, filtering with a simple box-car filter (75% window around the k-f-space center), and inverse Fourier transformation as well as further SPiRIT image reconstruction10 was implemented in MATLAB. For all five protocols, the RCA was manually segmented in all time frames to measure flow velocities through the vessel’s cross section. Maximum velocity values and mean flow volume were compared.
Results
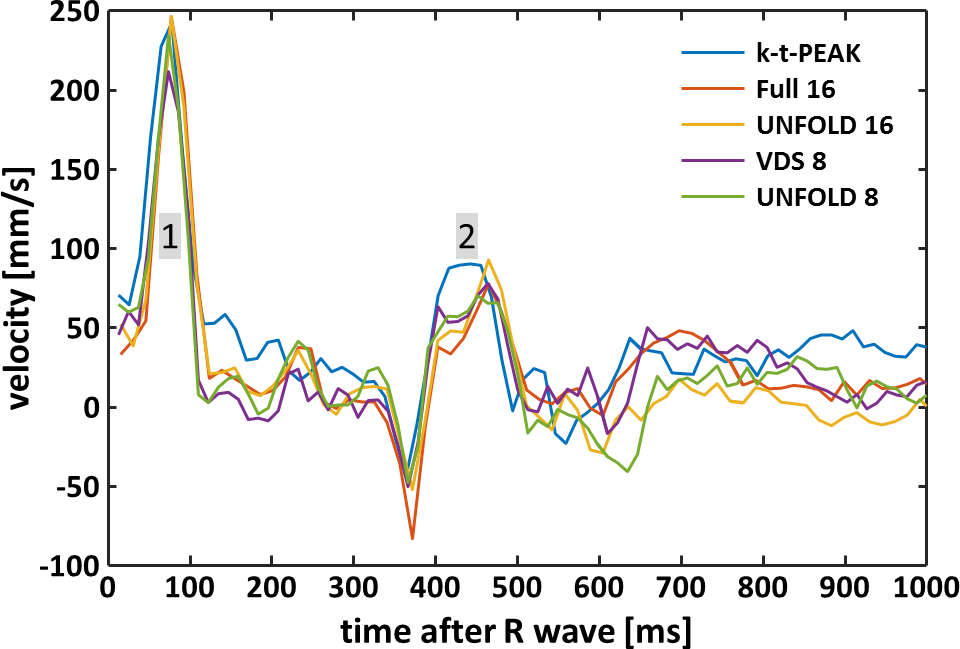
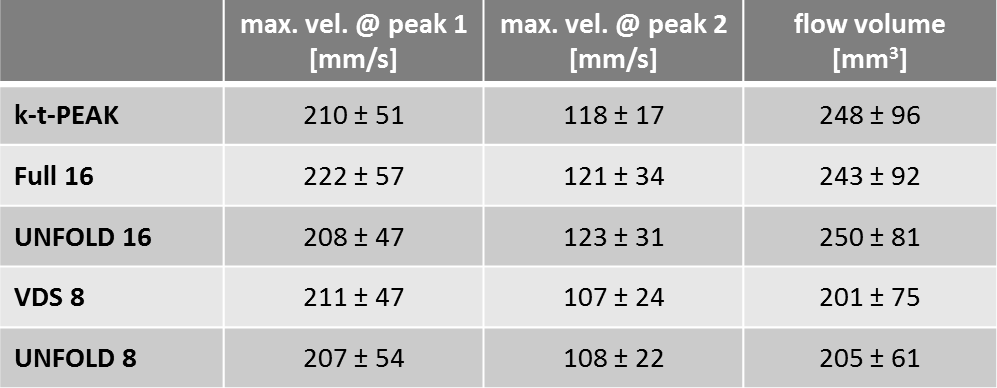
Figure 1 displays magnitude and phase contrast images acquired with the five different flow protocols together with a BB scout image from one volunteer. The cross section of the RCA is clearly visible and could be successfully segmented in all time frames. Minor artifacts can be seen mainly in the magnitude images obtained with the two 8-interleave spiral acquisitions. Exemplary velocity-time courses are illustrated in Fig. 2 exhibiting two velocity peaks at around 50-100 ms and 400-500 ms, respectively. The mean (= average values over all five volunteers) maximum velocities for peak 1 & 2 (cf. Fig. 2) and mean flow volumes are summarized in Table 1. Maximum velocities at peak 1 appear highly consistent whereas maximum velocities at peak 2 and flow volumes were smaller for the 8-interleave spirals compared to values measured with k-t-PEAK and 16-interleave spirals.Discussion & Conclusion
Overall, we found consistent velocity data in the RCA with the five different flow protocols, although some values retrieved from the 8-interleave spirals appeared systematically smaller. Remaining differences might be explained by effects from eddy currents which vary depending on the sampling trajectory. Results from UNFOLD-undersampled and respective non-UNFOLDed spirals were in good agreement. Our preliminary data suggests that UNFOLD might be used to further accelerate spiral velocity measurements (here by factor of 2) without substantially altering flow quantification. Our flow profiles appear consistent to published results5,8, however, eddy current correction and correction of surrounding tissue motion has to be included to improve coronary flow assessment in future. Further validation and optimization should be done in a larger cohort.
The combination of UNFOLD and 8-interleave VDS acquisitions achieves data collection at a spatio-temporal resolution of 1.0×1.0x8 mm³/12.2 ms in 8 heart beats reducing scan times to below 10 secs which might be tolerable even for BH-impaired patients. UNFOLDed spiral SPiRIT might be a further step to enable MR-based coronary flow measurements in patients with cardiovascular diseases.
Acknowledgements
References
1. Ofili EO, Kern MJ, Labovitz AJ, St Vrain JA, Segal J, Aguirre FV, Castello R. Analysis of coronary blood flow velocity dynamics in angiographically normal and stenosed arteries before and after endolumen enlargement by angioplasty. J Am Coll Cardiol. 1993;21(2):308-16.
2. Keegan J, Firmin D, Gatehouse P, Longmore D. The application of breath hold phase velocity mapping techniques to the measurement of coronary artery blood flow velocity: phantom data and initial in vivo results. Magn Reson Med. 1994;31(5):526-36.
3. Clarke GD, Eckels R, Chaney C, Smith D, Dittrich J, Hundley WG, NessAiver M, Li HF, Parkey RW, Peshock RM. Measurement of absolute epicardial coronary artery flow and flow reserve with breath-hold cine phase-contrast magnetic resonance imaging. Circulation. 1995;91(10):2627-34.
4. Hundley WG, Lange RA, Clarke GD, Meshack BM, Payne J, Landau C, McColl R, Sayad DE, Willett DL, Willard JE, Hillis LD, Peshock RM. Assessment of coronary arterial flow and flow reserve in humans with magnetic resonance imaging. Circulation. 1996;93(8):1502-8.
5. Keegan J, Gatehouse PD, Mohiaddin RH, Yang GZ, Firmin DN. Comparison of spiral and FLASH phase velocity mapping, with and without breath-holding, for the assessment of left and right coronary artery blood flow velocity. J Magn Reson Imaging. 2004;19(1):40-9.
6. Kevin Johnson, Puneet Sharma, John Oshinski. Coronary Artery Flow Measurement Using Navigator Echo Gated Phase Contrast Magnetic Resonance Velocity Mapping at 3.0 Tesla. J Biomech. 2008;41(3): 595-602.
7. Keegan J, Gatehouse PD, Yang GZ, Firmin DN. Spiral phase velocity mapping of left and right coronary artery blood flow: correction for through-plane motion using selective fat-only excitation. J Magn Reson Imaging. 2004;20(6):953-60.
8. Keegan J, Raphael CE, Parker K, Simpson RM, Strain S, de Silva R, Di Mario C, Collinson J, Stables RH, Wage R, Drivas P, Sugathapala M, Prasad SK, Firmin DN. Validation of high temporal resolution spiral phase velocity mapping of temporal patterns of left and right coronary artery blood flow against Doppler guidewire. J Cardiovasc Magn Reson. 2015;17:85. doi: 10.1186/s12968-015-0189-y
9. Lustig M, Pauly JM. SPIRiT: Iterative self-consistent parallel imaging reconstruction from arbitrary k-space. Magn. Reson. Med. 2010;64:457-71. doi: 10.1002/mrm.22428.
10. Menza M, Föll D, Hennig J, Jung B. Spiral SPIRIT Tissue Phase Mapping enables the acquisition of myocardial motion with high temporal and spatial resolution during breath-hold. In: Proceedings of the 24th Annual Meeting of the ISMRM, Singapore, 2016. Abstract: 3131.
11. Madore B, Glover GH, Pelc NJ. Unaliasing by Fourier-encoding the overlaps using the temporal dimension (UNFOLD), applied to cardiac imaging and fMRI. Magn. Reson. Med. 1999;42:813-828. doi: 10.1002/(SICI)1522-2594(199911)42:5<813::AID-MRM1>3.0.CO;2-S
12. Tsao J. On the UNFOLD method. Magn. Reson. Med. 2002;47:202-207. doi: 10.1002/mrm.10024
13. Bauer S, Markl M, Föll D, Russe M, Stankovic Z, Jung B. K-t GRAPPA accelerated
phase contrast MRI: Improved assessment of blood flow and 3-directional
myocardial motion during breath-hold. J Magn Reson Imaging. 2013;38(5):1054-62.
doi: 10.1002/jmri.24077
Figures