3217
Interobserver reproducibility of blood flow measurements with an abdominal 4D flow MRI sequence with spiral sampling and compressed sensing1Translational and Molecular Imaging Institute, Icahn School of Medicine at Mount Sinai, New York, NY, United States, 2Department of Radiology, Icahn School of Medicine at Mount Sinai, New York, NY, United States, 3Radiology, Groupe Hospitalier Pitié Salpêtrière, Paris, France, 44Catalyzer, Guilford, CT, United States
Synopsis
Our study evaluated the interobserver reproducibility of flow quantification in abdominal vessels using a novel 4D flow phase-contrast (PC) MRI sequence. The effect of liver fibrosis on blood flow metrics was also examined in 20 patients. Time-averaged vessel cross-section area, through-plane velocity and volume flow measured in 14 abdominal vessels in a subset of 10 patients were found to have acceptable interobserver agreement (Cohen’s kappa 0.762). A significant increase in the hepatic artery velocity and flow, splenic vein area and flow, middle hepatic vein velocity and flow, and right hepatic vein velocity was observed in patients with advanced fibrosis/cirrhosis.
Purpose
To determine the interobserver reproducibility of flow quantification in abdominal vessels using a novel 4D flow phase-contrast (PC) MRI sequenceMethods
20 initial patients (M/F 13/7, mean age 52y) with liver fibrosis confirmed at biopsy were enrolled in this prospective study. All patients underwent multiparametric abdominal MRI at 1.5T (Siemens Aera) including a cardiac-triggered, PC sequence with 3D velocity encoding (velocity encoding parameter VENC=60 cm/sec in each direction) and undersampled variable-density spiral trajectory, acquired before injection of gadolinium-based contrast agent1. A coronal-oblique abdominal 60 mm slab (TR/TE/FA 16.5 ms/3.8 ms/90, FOV 400x400 mm2, acquired matrix size 160 x 160 x 12, acquired voxel size 2.5 x 2.5 x 5 mm3, interpolated voxel size 1.3 x 1.3 x 2.5 mm3, temporal resolution 66-71 ms), covering abdominal vessels, was acquired over 24 cardiac cycles, in one 22-sec breath-hold. Image reconstruction was performed offline using a dynamic compressed sensing framework and an open-source GPU re-gridding software for radial 3D MRI, implemented in MATLAB_R2015a (The MathWorks)1,2. Reconstruction of each dataset took 1 hour with use of a computing server (32 Intel Xeon CPUs, 2.2GHz, 256 GB RAM, K20 NVIDIA graphics card) running Ubuntu.
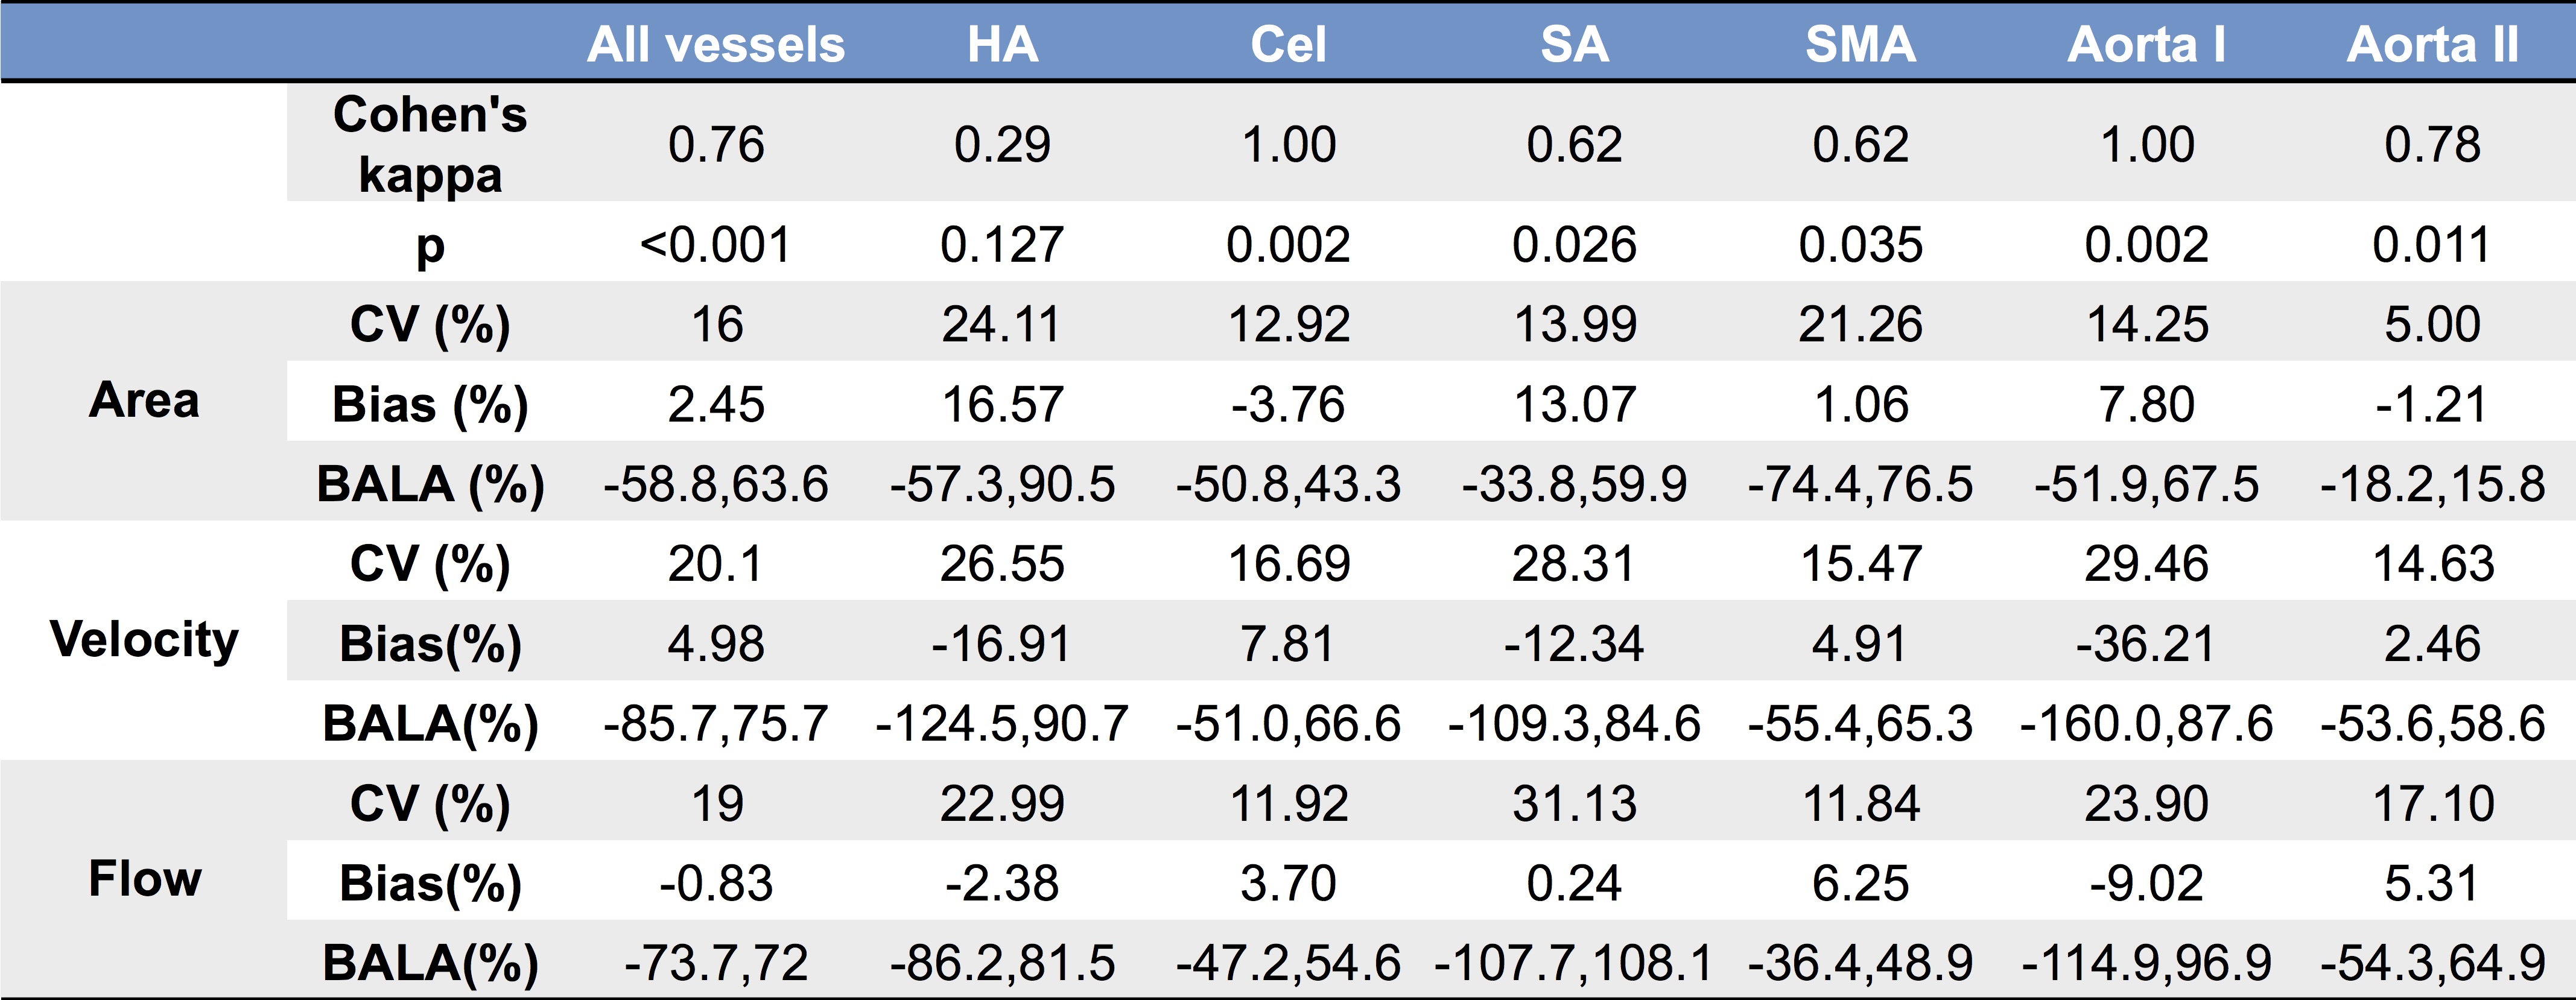
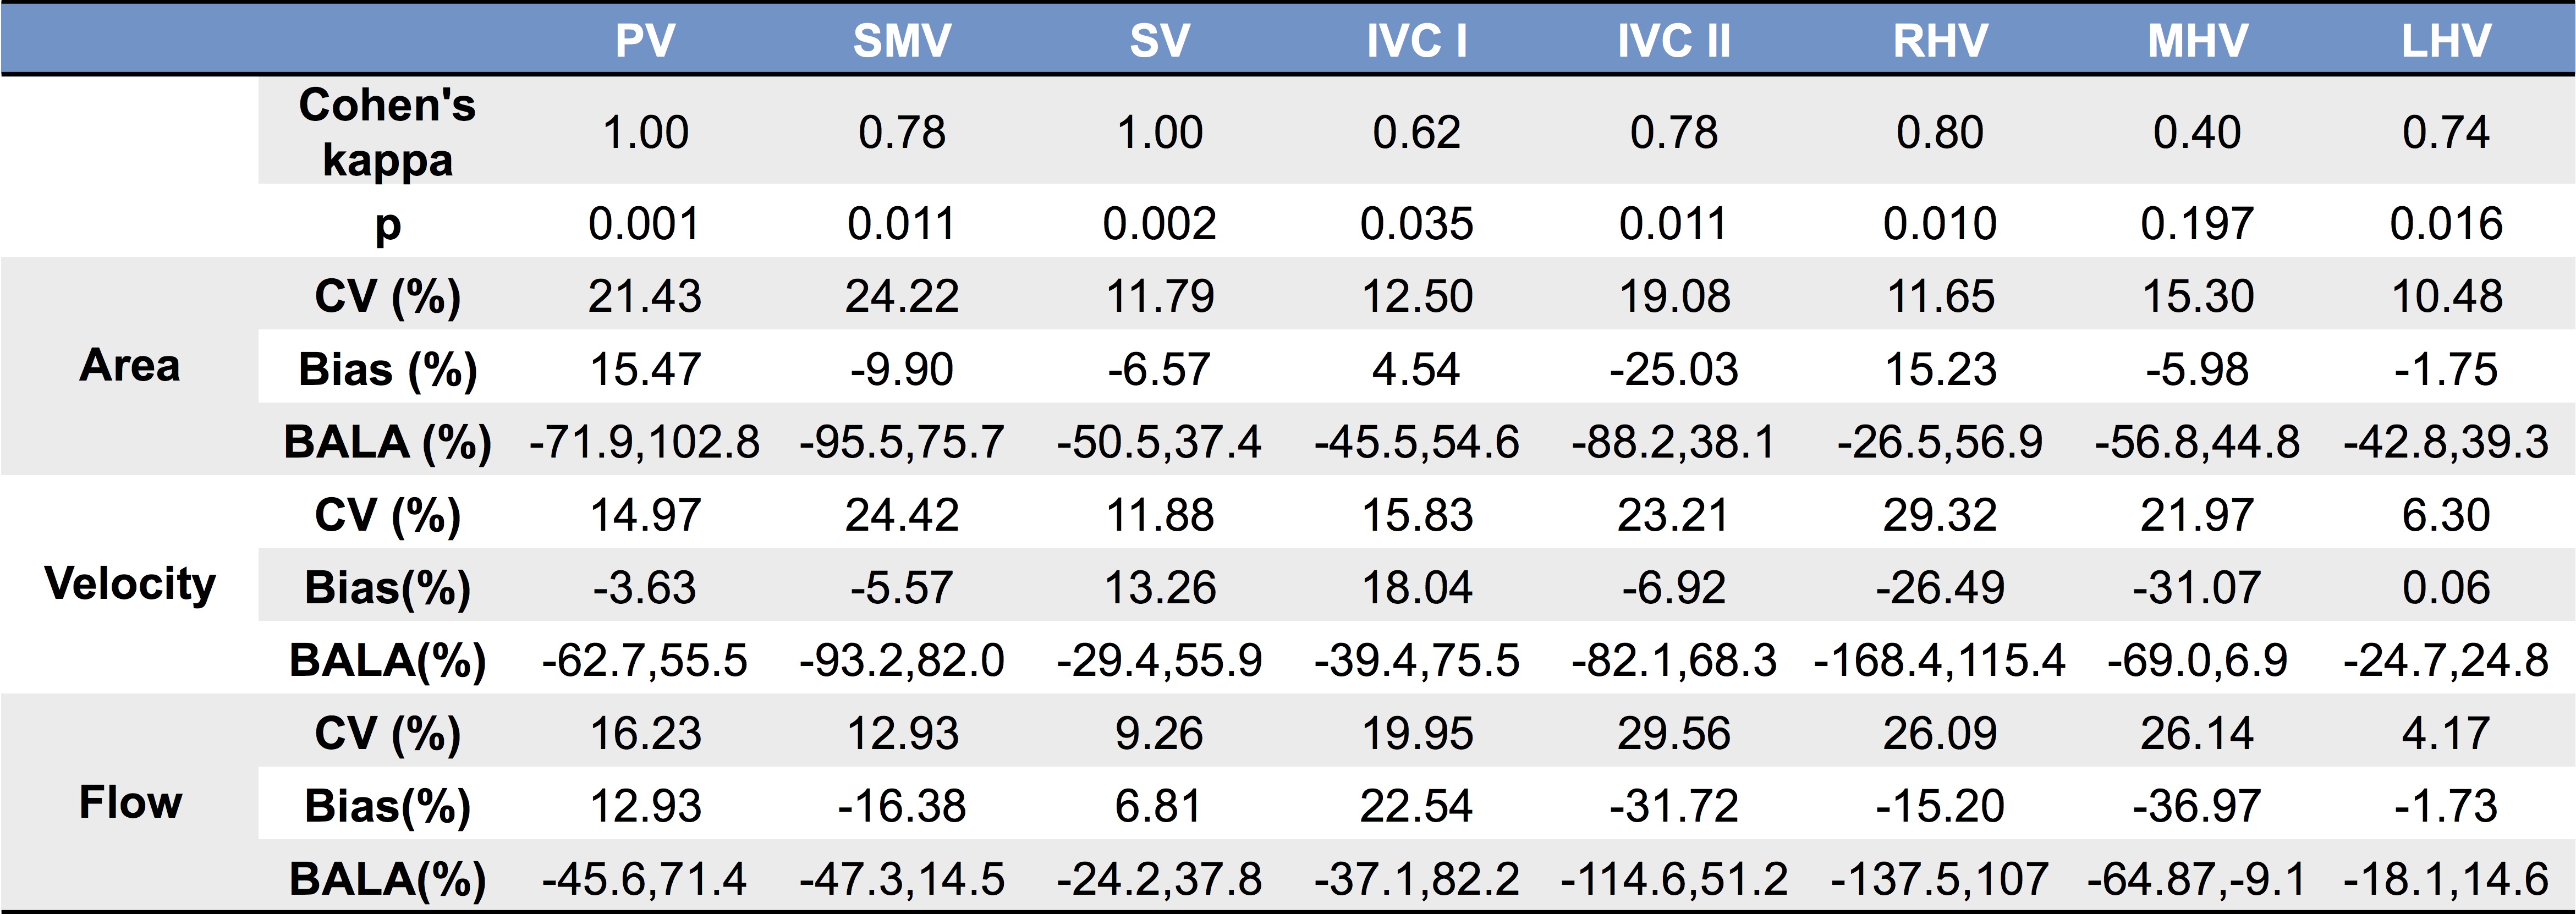
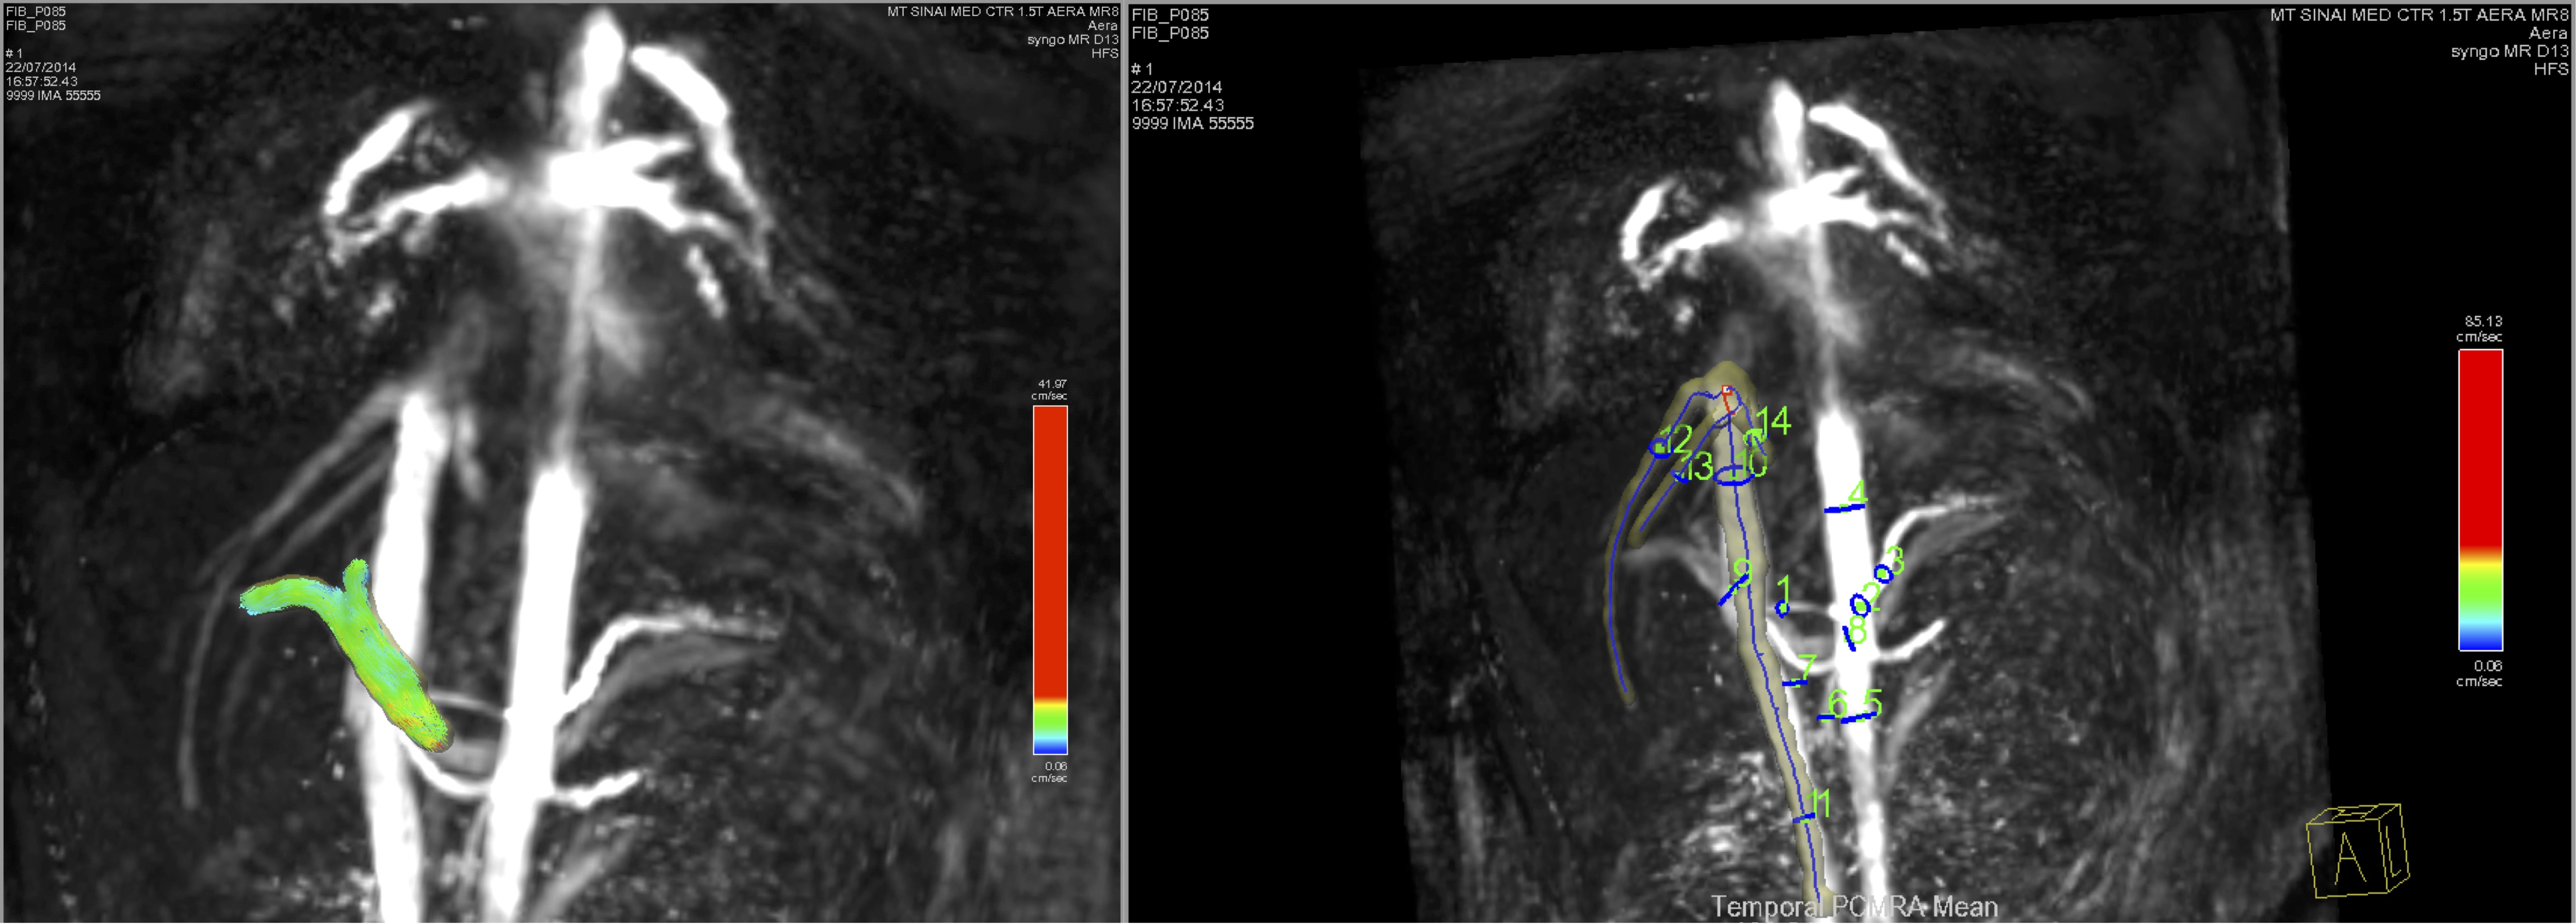
Images were analyzed using prototype software (Siemens Healthcare). After performing corrections for phase aliasing, eddy currents and motion, up to 14 abdominal vessels, including the aorta and its celiac branches, the portal vein (PV) and inferior vena cava (IVC) (Fig. 1) were identified and segmented 1. Two independent observers performed segmentation for a subsample of 10 cases. Time-averaged vessel cross-section area, through-plane velocity and flow were measured. Interobserver agreement on vessel identification was evaluated by Cohen’s kappa. Interobserver agreement of area, velocity and flow measurements was evaluated by coefficient of variation (CV) and Bland-Altman statistics.
Results
Patients had the following distribution of liver fibrosis stages: F0 (n=1), F1 (n=3), F2 (n=4), F3 (n=5) and cirrhosis (F4, n=7). Tables 1 and 2 show interobserver statistics for individual vessels, and all vessels combined. There was substantial overall agreement between observers in segmenting the vessels (all vessels Cohen’s kappa=0.762, p<0.001). The celiac trunk, aorta above the celiac trunk, portal (PV) and splenic (SV) veins were segmented with perfect interobserver agreement (Table 1,2: kappa=1, p=0.002), while the hepatic artery (HA) had the poorest interobserver agreement (Table 1: kappa=0.29, p=0.127). For all vessels combined, area, velocity and flow measurements showed acceptable agreement between observers, with CV < 21%, Bland-Altman bias <5%, but high limits of agreement ([-75%, 75%]). Area measurements in the aorta below renal arteries had the best interobserver reproducibility (Table 1: CV= 5%, bias= -1.21%, BALA=[-18.2%, 15.8%]). Velocity and flow measurements in the left hepatic vein (LHV) had the best interobserver agreement (Table 2: velocity: CV 6.3%, bias 0.06 %, BALA [-24.7%, 24.8%]; flow: CV 4.17%, bias -1.73%, BALA [-18.1%, 14.6%]).
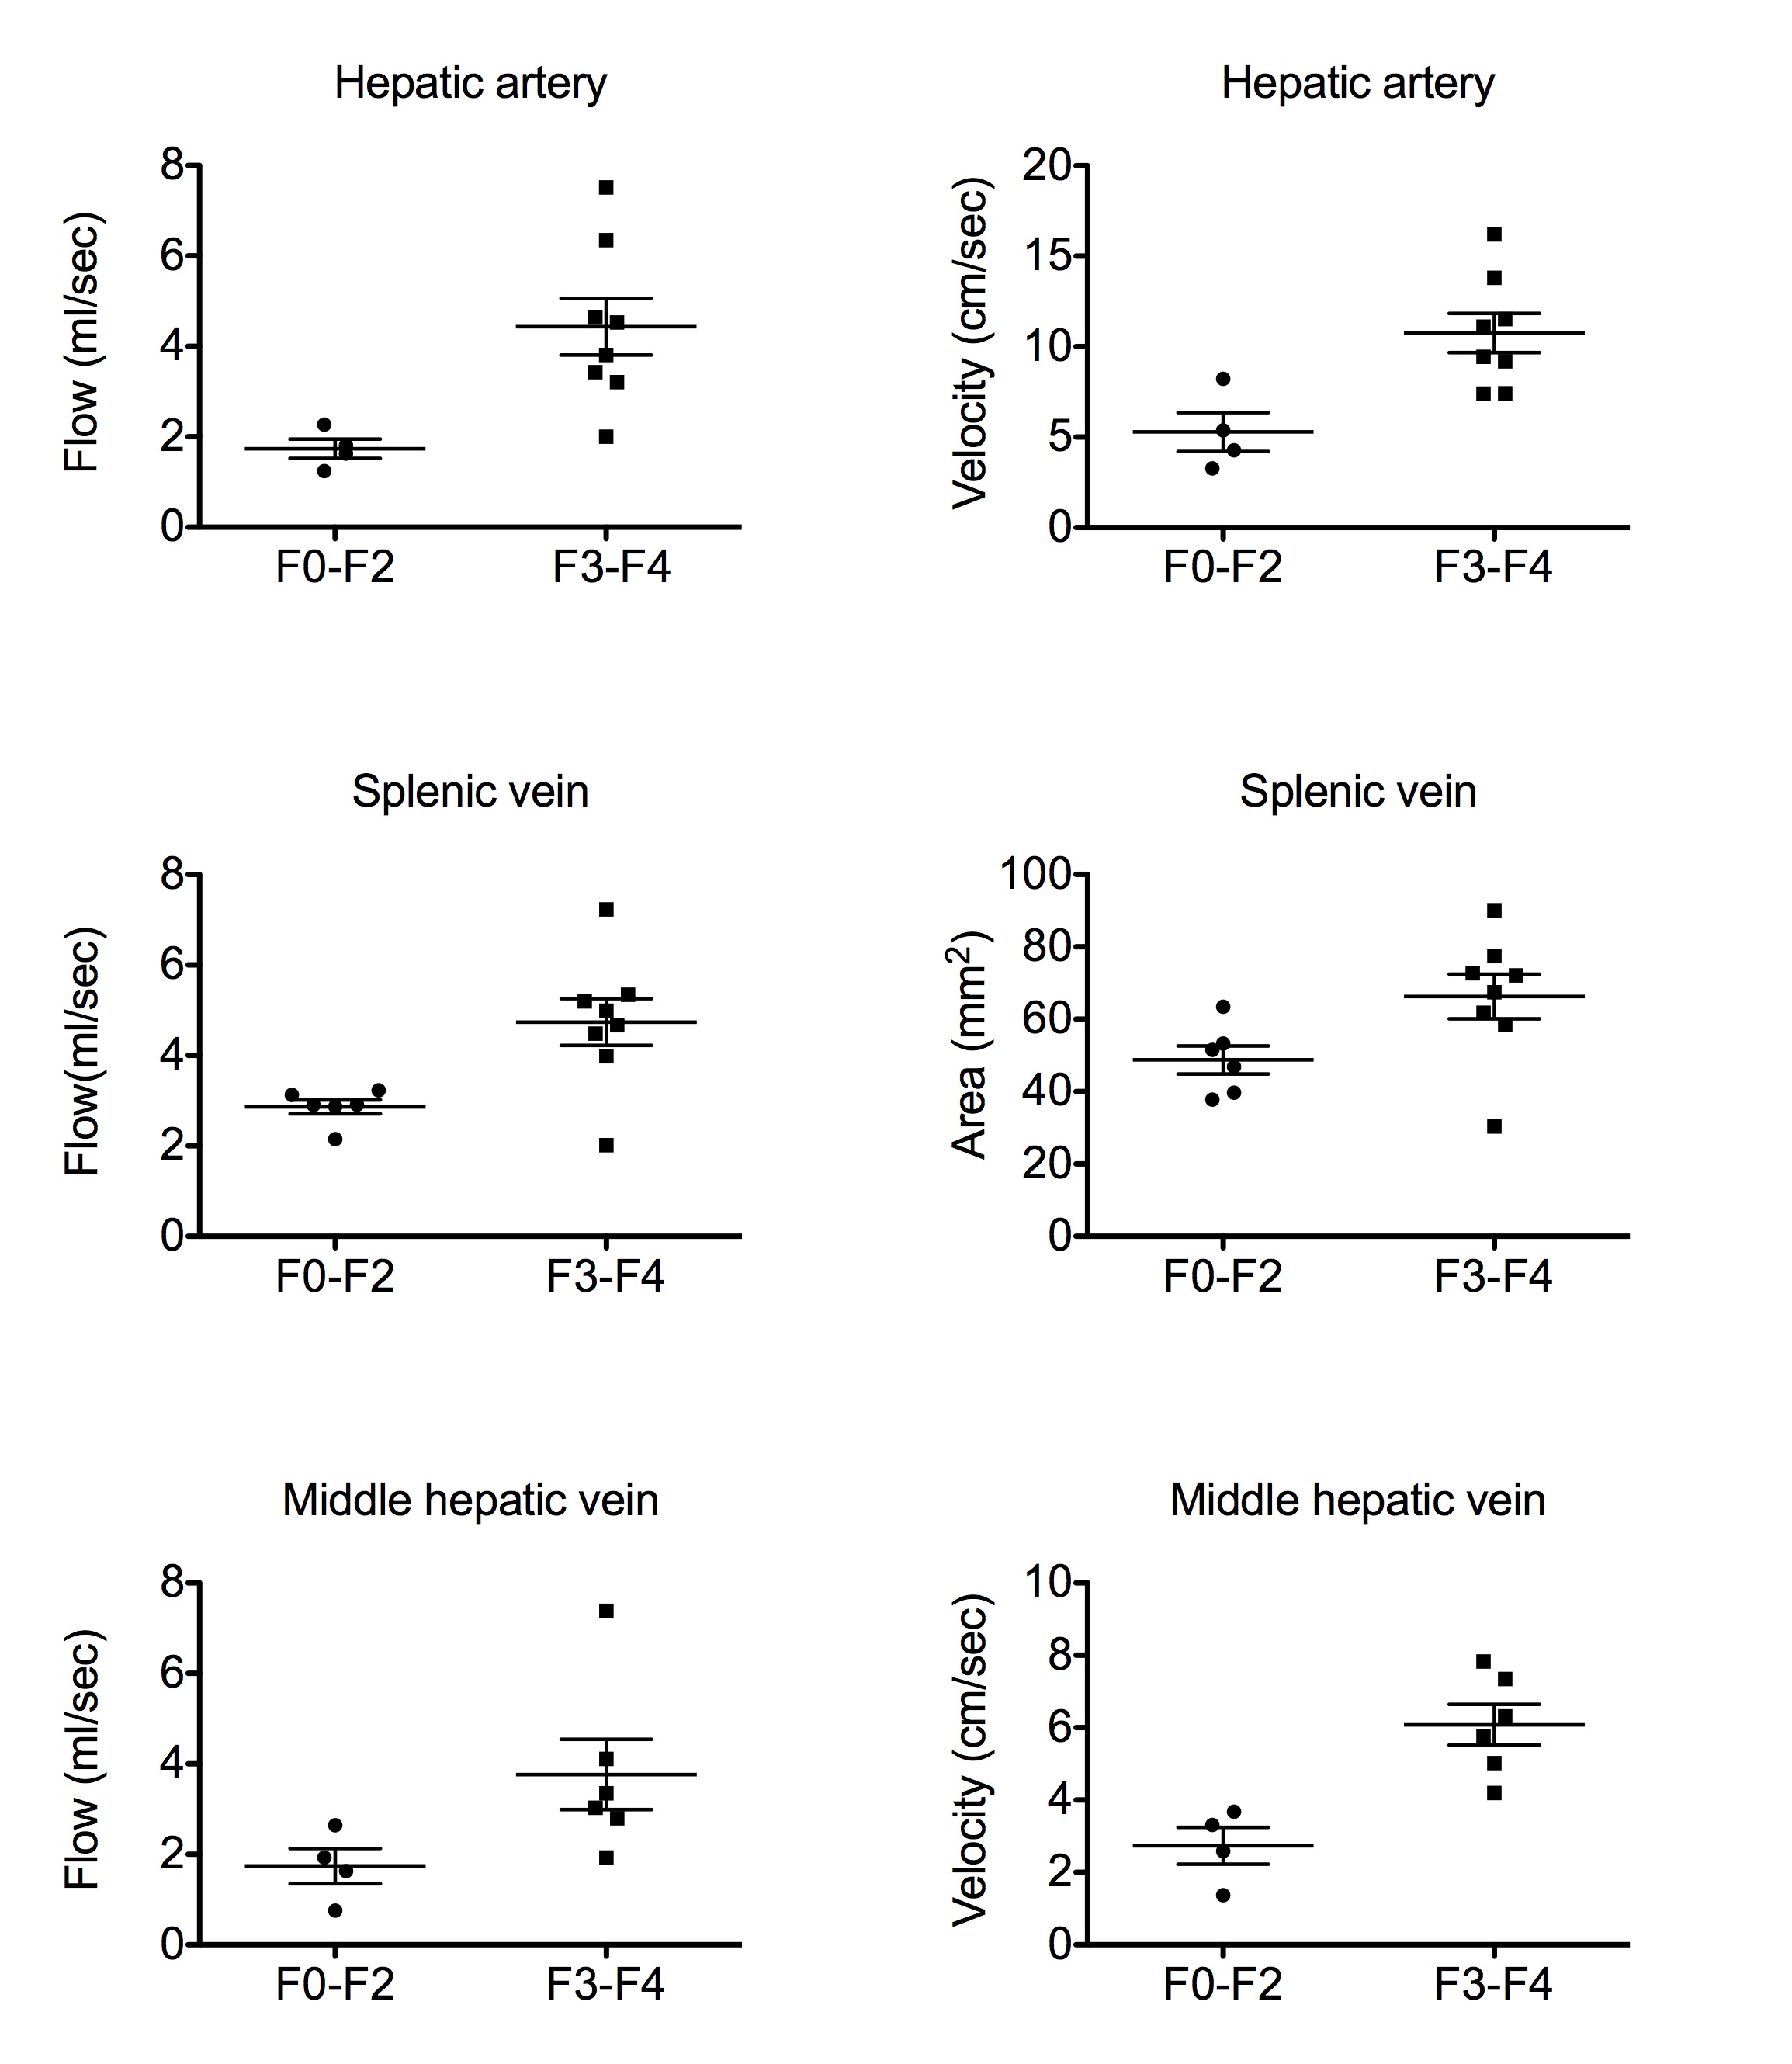
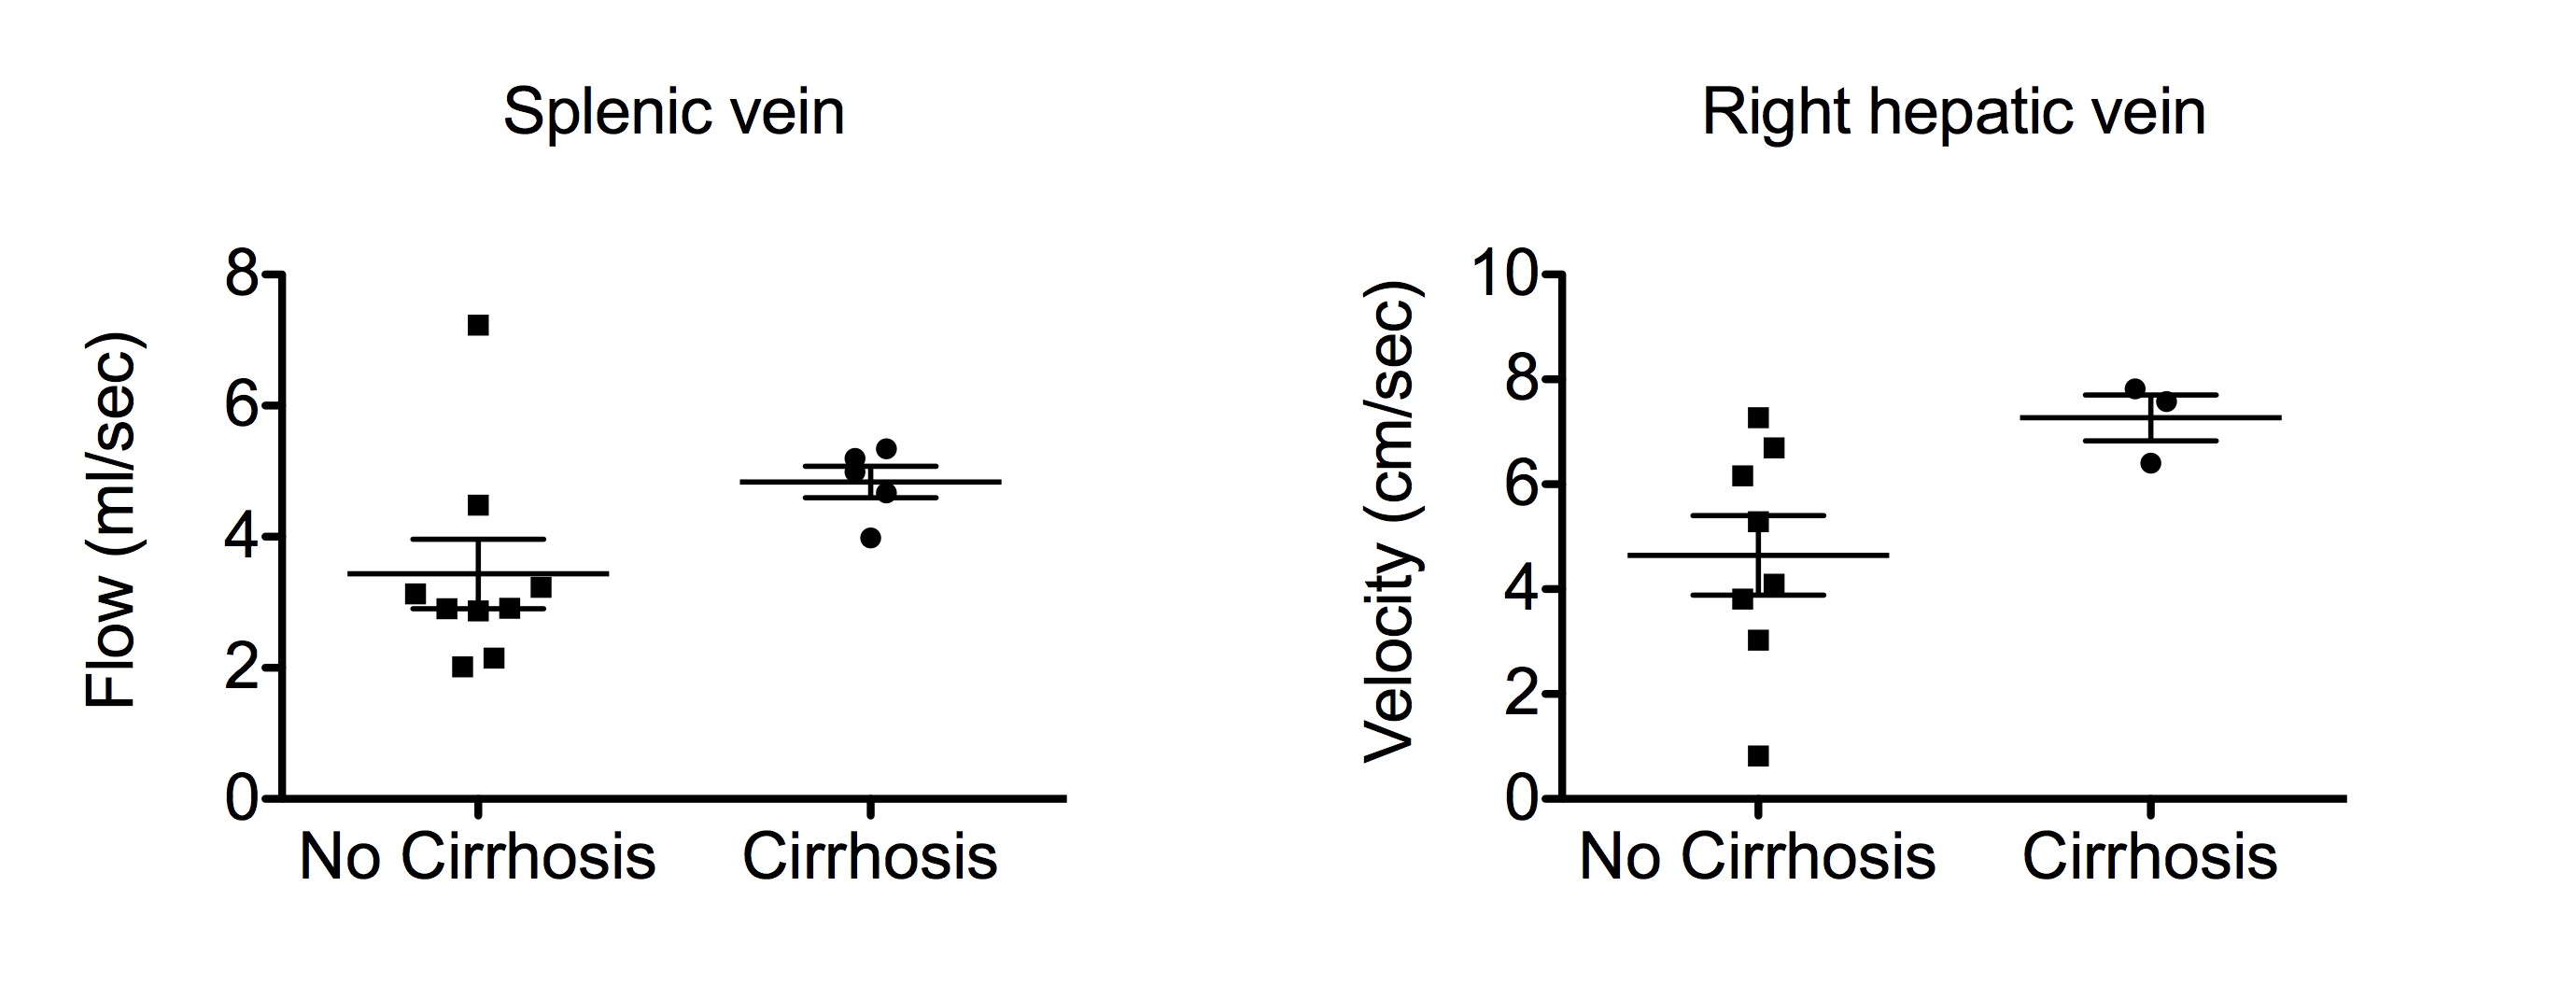
Preliminary results (Fig. 2) show significantly higher flow (p=0.0081) and velocity (p=0.0162) in the HA, flow (p=0.02) and area (p=0.0426) in the SV, flow (p=0.035) and velocity (p=0.0095) in the middle hepatic vein (MHV), in patients with advanced liver fibrosis (stage F3-F4) compared to patients with no/moderate liver fibrosis (F0-F2). Elevated mean blood flow velocities for patients with advanced liver fibrosis were also observed in the splenic artery (p=0.0312), aorta above celiac trunk (p=0.0033) and right hepatic vein (RHV) (p=0.03). In patients with liver cirrhosis vs those without cirrhosis, SV flow (p=0.029) and RHV velocity (p=0.049) were increased (Fig 3).
Discussion and conclusions
Blood flow measurements in abdominal vessels with the single-breath hold 4D flow MRI sequence have acceptable interobserver reproducibility. Interobserver Cohen’s kappa for vessel identification was comparable to reported values in the portal circulation using a Cartesian 4D flow respiratory gated acquisition with 20 minutes acquisition time3. In these initial patients, we observed increased blood flow and velocity in the HA of patients with advanced fibrosis and cirrhosis. The increase in HA flow is consistent with the hepatic arterial buffer response4, by which increased arterial perfusion compensates for decreased portal vein flow in patients with liver cirrhosis. We also observed paradoxical increase in flow and area in the SV, and flow and velocity in the RHV, in patients with advanced fibrosis and cirrhosis. The increase in SV area and flow was observed by other investigators, in patients with cirrhosis vs age-matched and young controls, and may be due to changes in vascular geometry with cirrhosis 5. Future work will correlate flow data with degree of portal hypertension based on hepatic venous pressure gradient measurement.Acknowledgements
This research was supported by the National Institutes of Health (grant 1R01DK087877).References
1. Dyvorne H, Knight-Greenfield A, Jajamovich G, et al. Abdominal 4D flow MR imaging in a breath hold: combination of spiral sampling and dynamic compressed sensing for highly accelerated acquisition. Radiology 2015;275(1):245-254.
2. Schwarzl A. GPU Regridding of Radial 3D MRI Data. Graz, Austria: Graz University of Technology; 2012. 36 p.
3. Stankovic Z, Frydrychowicz A, Csatari Z, et al. MR-based visualization and quantification of three-dimensional flow characteristics in the portal venous system. Journal of magnetic resonance imaging : JMRI 2010;32(2):466-475.
4. Gulberg V, Haag K, Rossle M, Gerbes AL. Hepatic arterial buffer response in patients with advanced cirrhosis. Hepatology (Baltimore, Md) 2002;35(3):630-634.
5. Stankovic Z, Csatari Z, Deibert P, et al. Normal and altered three-dimensional portal venous hemodynamics in patients with liver cirrhosis. Radiology 2012;262(3):862-873.
Figures