3215
Effect of field strength and spatial resolution on quantifying intracranial hemodynamics with PEAK-GRAPPA accelerated Dual-Venc 4D flow MRI1Radiology, Northwestern University, Chicago, IL, United States, 2Philips Healthcare, Gainesville, FL, United States, 3Center for Magnetic Resonance in Medicine, University of Minnesota, Minneapolis, MN, United States, 4University of Minnesota, Minneapolis, MN, United States, 5Biomedical Engineering, Northwestern University, Evanston, IL, United States, 6Physikalisch-Technische Bundesanstalt, Braunschweig and Berlin, Germany
Synopsis
Dual-venc 4D flow MRI was applied in 5 healthy volunteers at two different field strengths of 3T and 7T and at two different isotropic spatial image resolutions, approximately (1.2mm)3 and (0.8mm)3. The aim of this study was to systematically investigate the effect of field strength as well as the impact of resolution for intracranial 4D flow MRI with respect to image quality (vessel sharpness and depiction of small intracranial vessels) and quantification of intracranial flow parameters (net flow, peak velocity).
Purpose
To investigate whether PEAK-GRAPPA accelerated high spatial resolution dual-venc 4D flow MRI at 3T and 7T yields improved image quality and flow quantification compared to a lower resolution with standard acceleration (GRAPPA with R=2).Methods
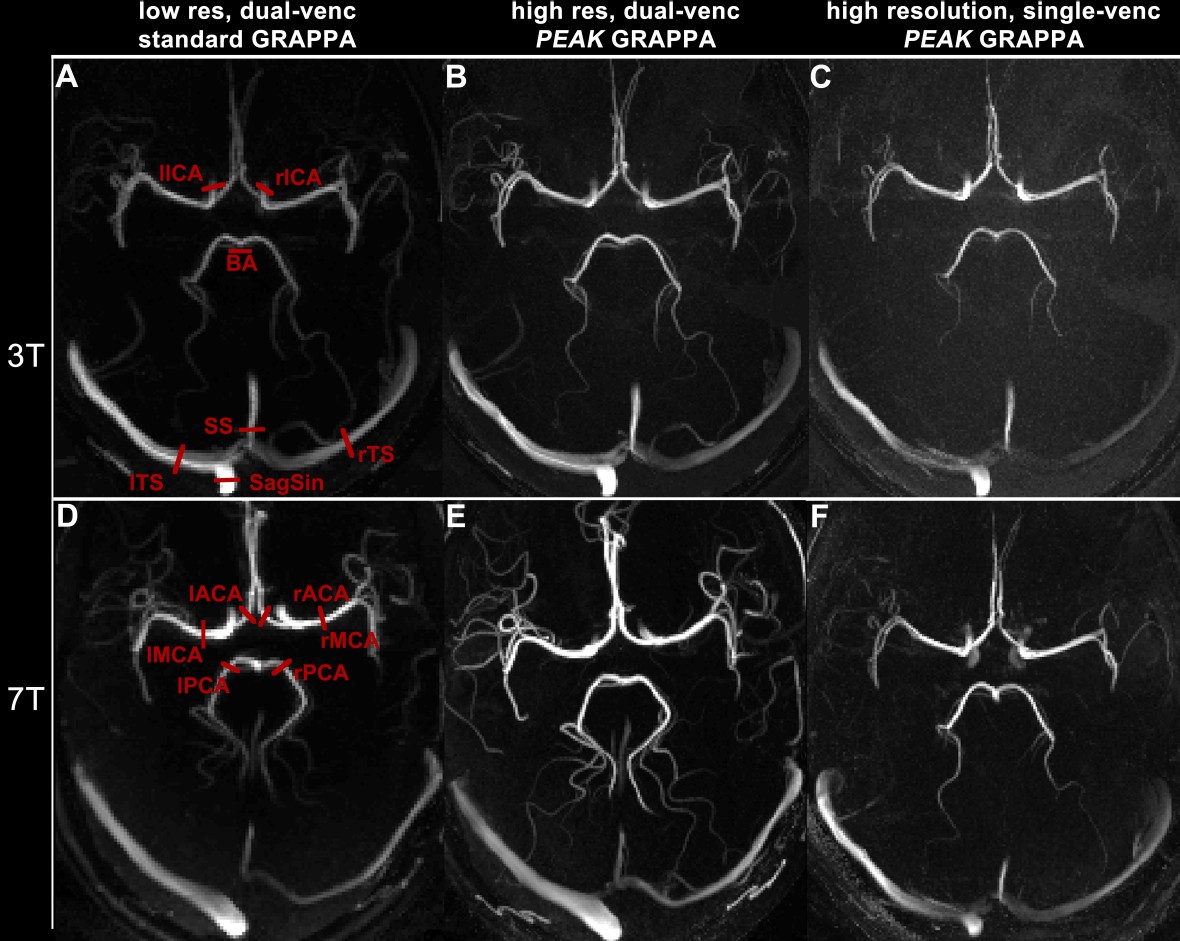
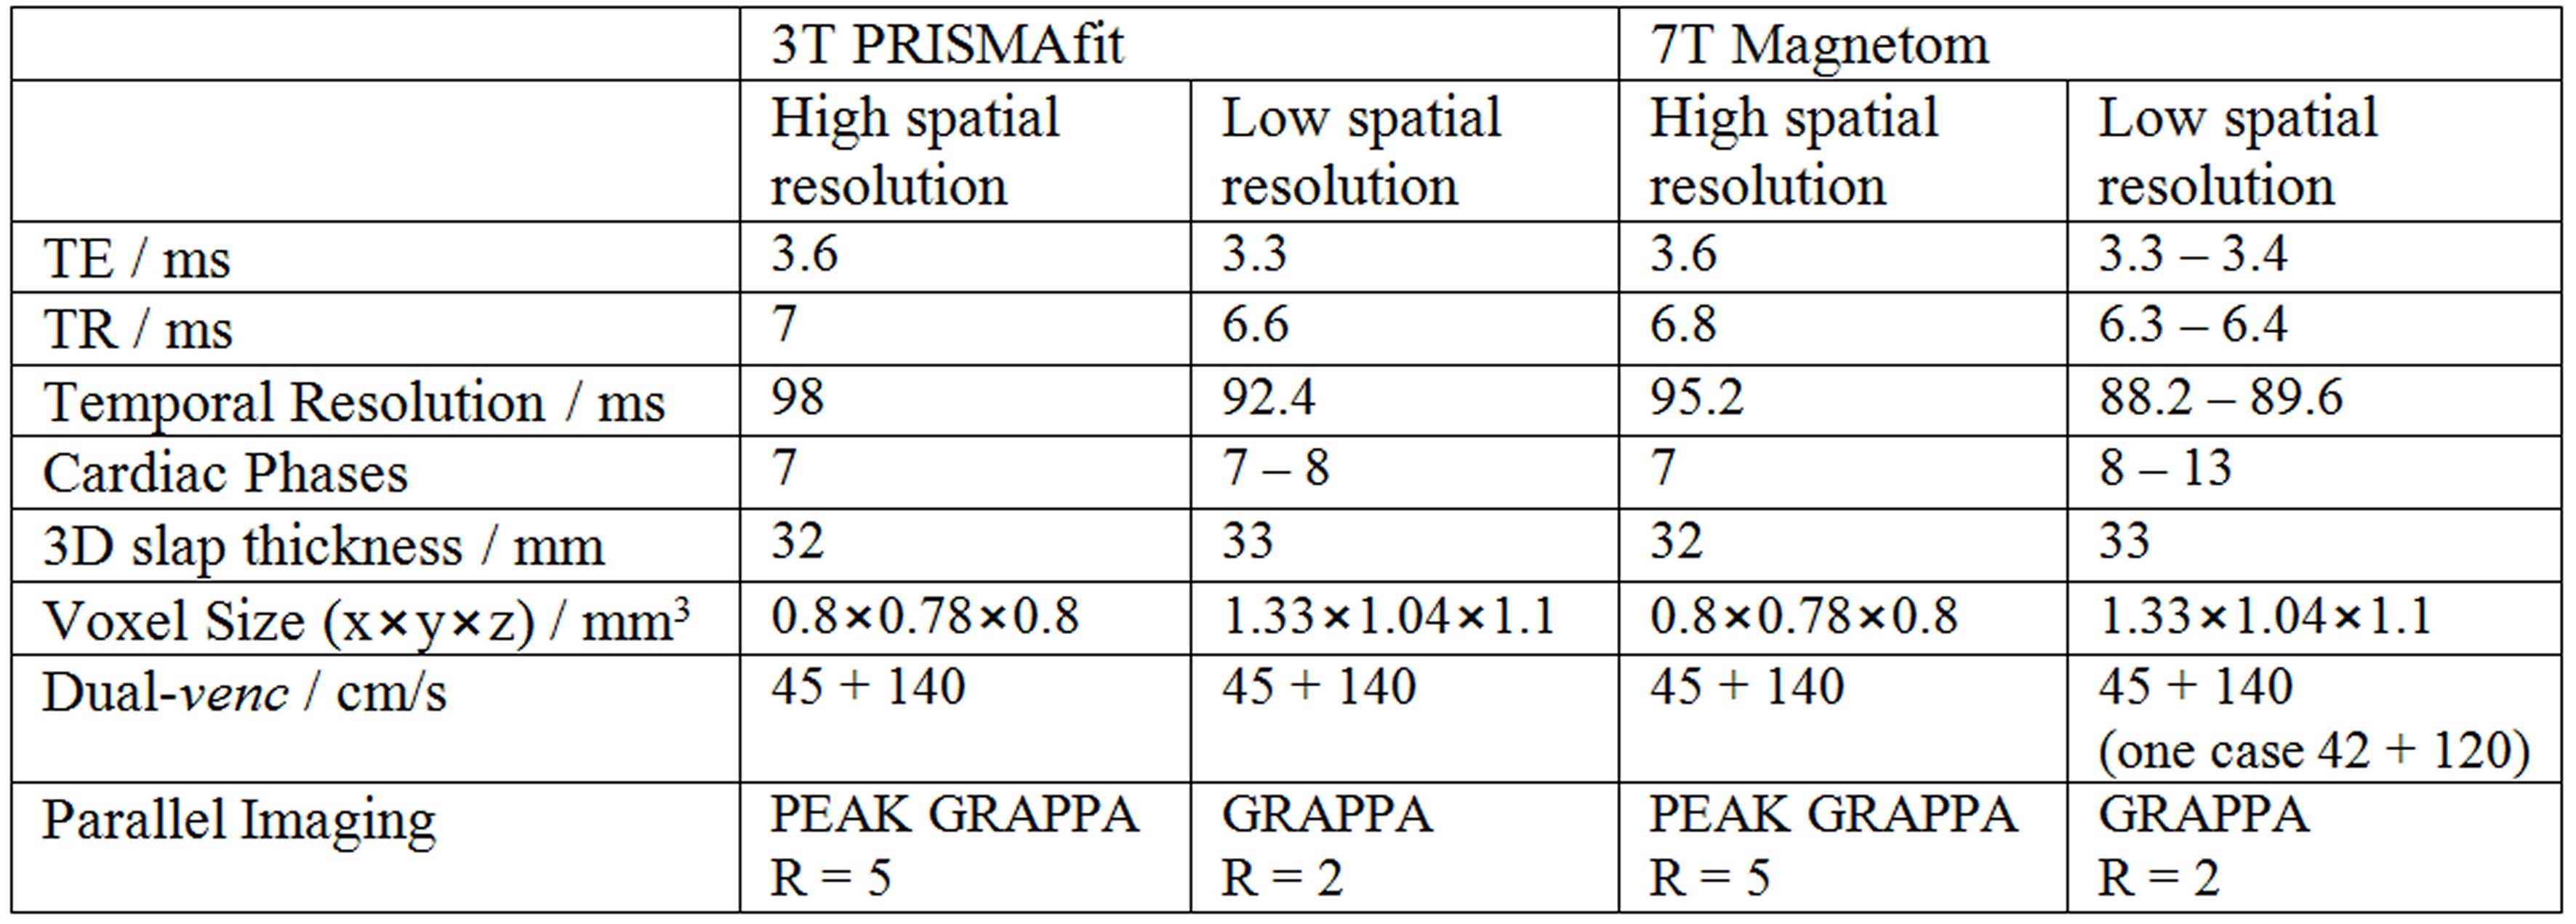
Intracranial 0.8mm3 isotropic high-resolution ECG-gated dual-venc 4D flow MRI was acquired with PEAK-GRAPPA acceleration (1) on a 7T MRI scanner (Siemens Magnetom, SC72 gradients; 16x1kW RF amplifier (Stolberg); 32RX/1TX head coil (Nova Medical)) and a Siemens PRISMAfit 3T MRI scanner (32 channel head coil) in 5 healthy volunteers (mean age=31±14.5yrs, age range=21-56yrs, 1 female). Scan parameters are summarized in Table 1. To study the impact of spatial resolution, a second dual-venc dataset with standard GRAPPA (R=2) acceleration at standard resolution (approximately 1.2mm3 isotropic) was acquired for both field strengths. The number of slices was adjusted such that both acquisitions covered a similar 3D volume. All data sets were corrected for background phase offsets (2). A dual-venc 4D flow MRI data set was reconstructed by correcting velocity aliasing in the low-venc data using the high-venc data. The resulting dual-venc data set provides high dynamic velocity range and low velocity noise (3). Phase-contrast angiograms (PC-MRA, Fig.1) were calculated from the velocity and magnitude data that were used to identify vessel boundaries to mask blood flow. Vessel sharpness was evaluated by determining the vessel width using the signal profile across the vessel at the M1 segment of the left or right middle cerebral arteries (lMCA, rMCA) in the axial PC-MRA maximum intensity projection (MIP) images. Further analysis included net flow and peak velocity quantification at the left and right internal carotid arteries (lICA, rICA), lMCA, rMCA, left and right anterior cerebral arteries (lACA, rACA), basilar artery (BA), left and right posterior cerebral arteries (lPCA, rPCA) as well as the left and right transverse sinuses (lTS, rTS), the straight sinus (SS) and superior sagittal sinus (SagSin) (Figure 1A,D) using a commercial software (EnSight, CEI).Results
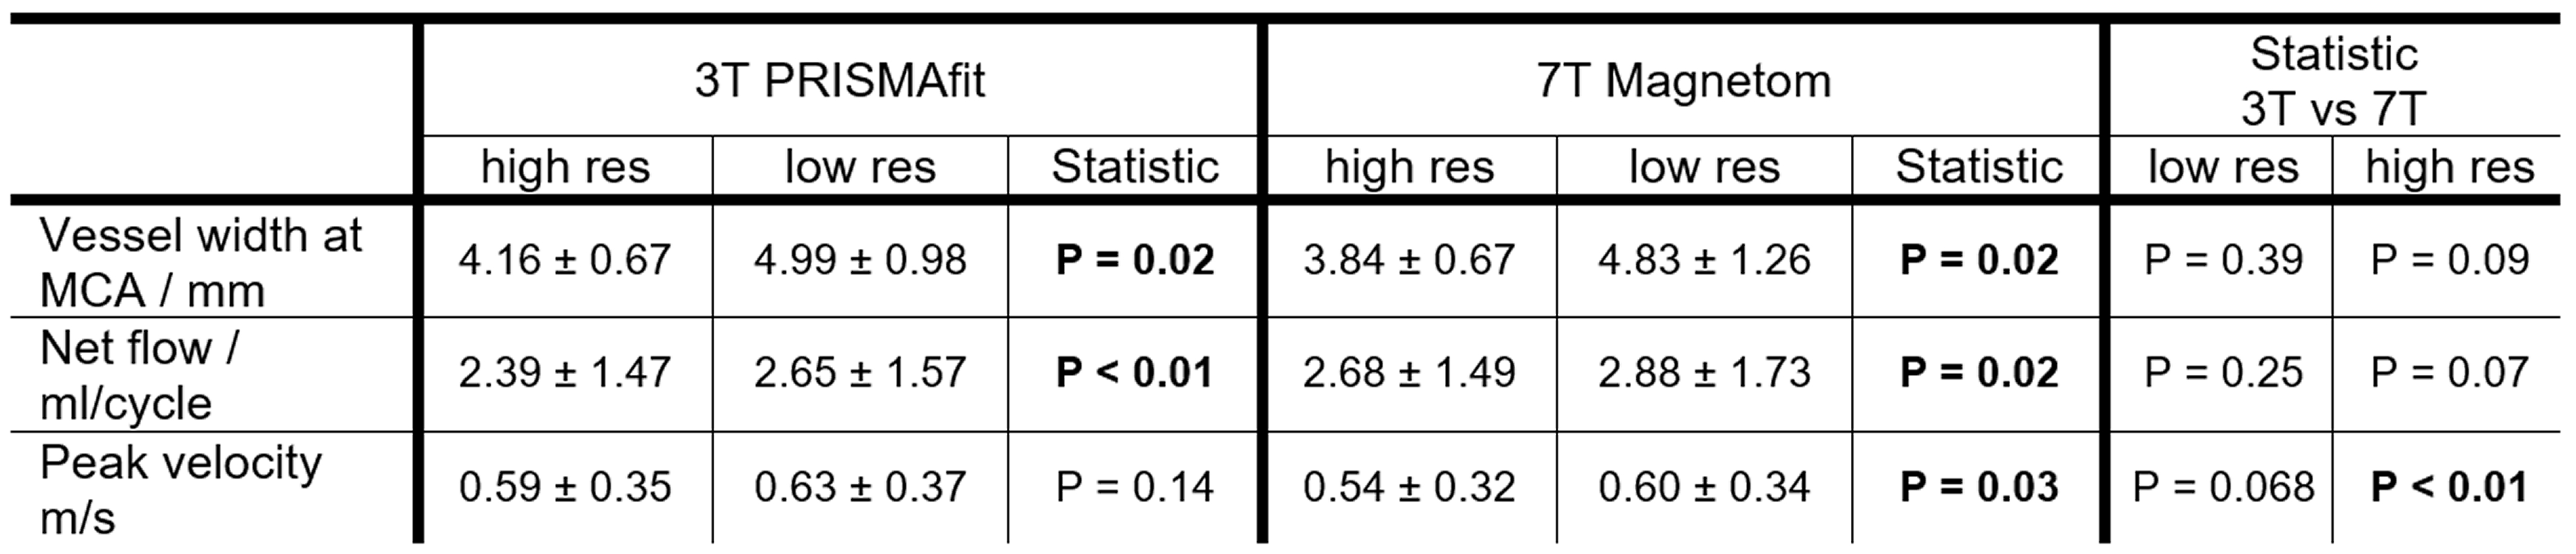
PEAK-GRAPPA accelerated dual-venc 4D flow MRI data was successfully acquired in all subjects with an average scan time of 21min (±3min) for the standard resolution scan at both fields. Scan time for the high resolution and PEAK-GRAPPA accelerated scan was 16min (±2min). All quantitative results for vessel width, peak velocity and net flow are summarized in Table 2. Peak velocities and net flow agreed well between standard and high resolution scan, however, net flow was systematically higher in the standard resolution scan. At 7T peak velocity was higher than in the standard resolution scan. Improvement in vessel depiction was evident for the high resolution scan at 3T and 7T as represented by the significantly smaller measured vessel width. Vessel width was similar for the same resolution at the two field strengths. It can be appreciated in Figure 1 that the reconstructed high-resolution dual-venc data set for both field strengths showed more details and less noise than the single-venc, smaller vessel branches can be seen in the 7T acquisition.Discussion and Conclusions
The findings of this 4D flow feasibility study demonstrate that the combination of 7 Tesla and dual velocity encoding allows for high spatial resolution with high dynamic velocity range. By utilizing PEAK-GRAPPA the scan time can be reduced by 30% compared to an acquisition with standard resolution and acceleration. The higher resolution also reduces the systematically overestimated net flow values obtained by the standard acquisition, which is expected due to partial volume effects. In conclusion, the high spatial resolution in addition to dual-venc encoding at 7T was shown to be highly beneficial compared to standard resolution scans typically done at 3T MRI, for example for the quantification of hemodynamics in arteriovenous malformation or aneurysms with typically large velocity ranges.Acknowledgements
Work supported in part by NIH grants P41 EB015894 and P30 NS076408 and AHA 16SDG30420005References
1. Jung B, Honal M, Ullmann P, Hennig J, Markl M. Highly k-t-space–accelerated phase-contrast MRI. J Magn Reson Imaging, 2008; 28(5):1226-1232.
2. Walker PG, Cranney GB, Scheidegger MB, Waseleski G, Pohost GM, Yoganathan AP. Semiautomated Method for Noise Reduction and Background Phase Error Correction in MR Phase Velocity Data. J Magn Reson Imaging, 1993. 3(3): p. 521-30.
3. Schnell S, Wu C, Garcia F, Murphy I, Markl M. Intracranial k-t Accelerated Dual-Venc 4D flow MRI. Proc. Intl. Soc. Mag. Reson. Med. 2015, abstract 4543
Figures