3214
Cardiac 4D phase-contrast MRI at 9.4 T using self-gated ultra-short echo time (UTE) imaging1Medical Physics Group, Institute of Diagnostic and Interventional Radiology, Jena University Hospital - Friedrich Schiller University Jena, Jena, Germany, 2Biomedical NMR, Department of Biomedical Engineering, Eindhoven University of Technology, Eindhoven, Netherlands, 3Institute of Medical Microbiology, Jena University Hospital - Friedrich Schiller University Jena, Jena, Germany, 4Michael Stifel Center for Data-driven and Simulation Science Jena, Friedrich Schiller University Jena, Jena, Germany, 5Abbe School of Photonics, Friedrich Schiller University Jena, Jena, Germany, 6Center of Medical Optics and Photonics, Friedrich Schiller University Jena, Jena, Germany, 7Biomedical Engineering and Physics, Academic Medical Center, Netherlands
Synopsis
Time resolved 4D phase contrast (PC) MRI in mice is challenging and often susceptible to artifacts due to long scan times, ECG-gating and the rapid blood flow and cardiac motion of small rodents. To overcome several of these technical challenges we implemented a retrospectively self-gated 4D-PC radial UTE acquisition scheme and assessed its performance in healthy mice by comparing the results with those obtained with an ECG-triggered 4D-PC fast low angle shot (FLASH) sequence.
Purpose
Quantitative blood flow analysis using 4D time-resolved phase-contrast (4D-PC) MRI is a valuable tool for studying the cardiovascular system1,2. Applying 4D-PC-MRI to small animals at high field strengths remains technically challenging and has only recently been implemented by using a Cartesian gradient echo sequence3. In this work we present a 4D-PC-UTE acquisition strategy that uses the shortest possible echo- and repetition-times in combination with an efficient self-gating. The proposed technique was validated in both flow phantoms and healthy mouse hearts.Materials and Methods
A center-out cone by cone 3D-UTE imaging sequence was modified by including a four-point Hadamard flow encoding encoding scheme4,5. To extract a stable navigator signal from the center of k-space of the non-selectively excited 3D imaging volume two modifications were made: 1) constant z-spoiling to reduce fluctuations caused by old magnetization and 2) switching on the ADC 100 µs prior to the readout gradient to reduce digital filtering artifacts.
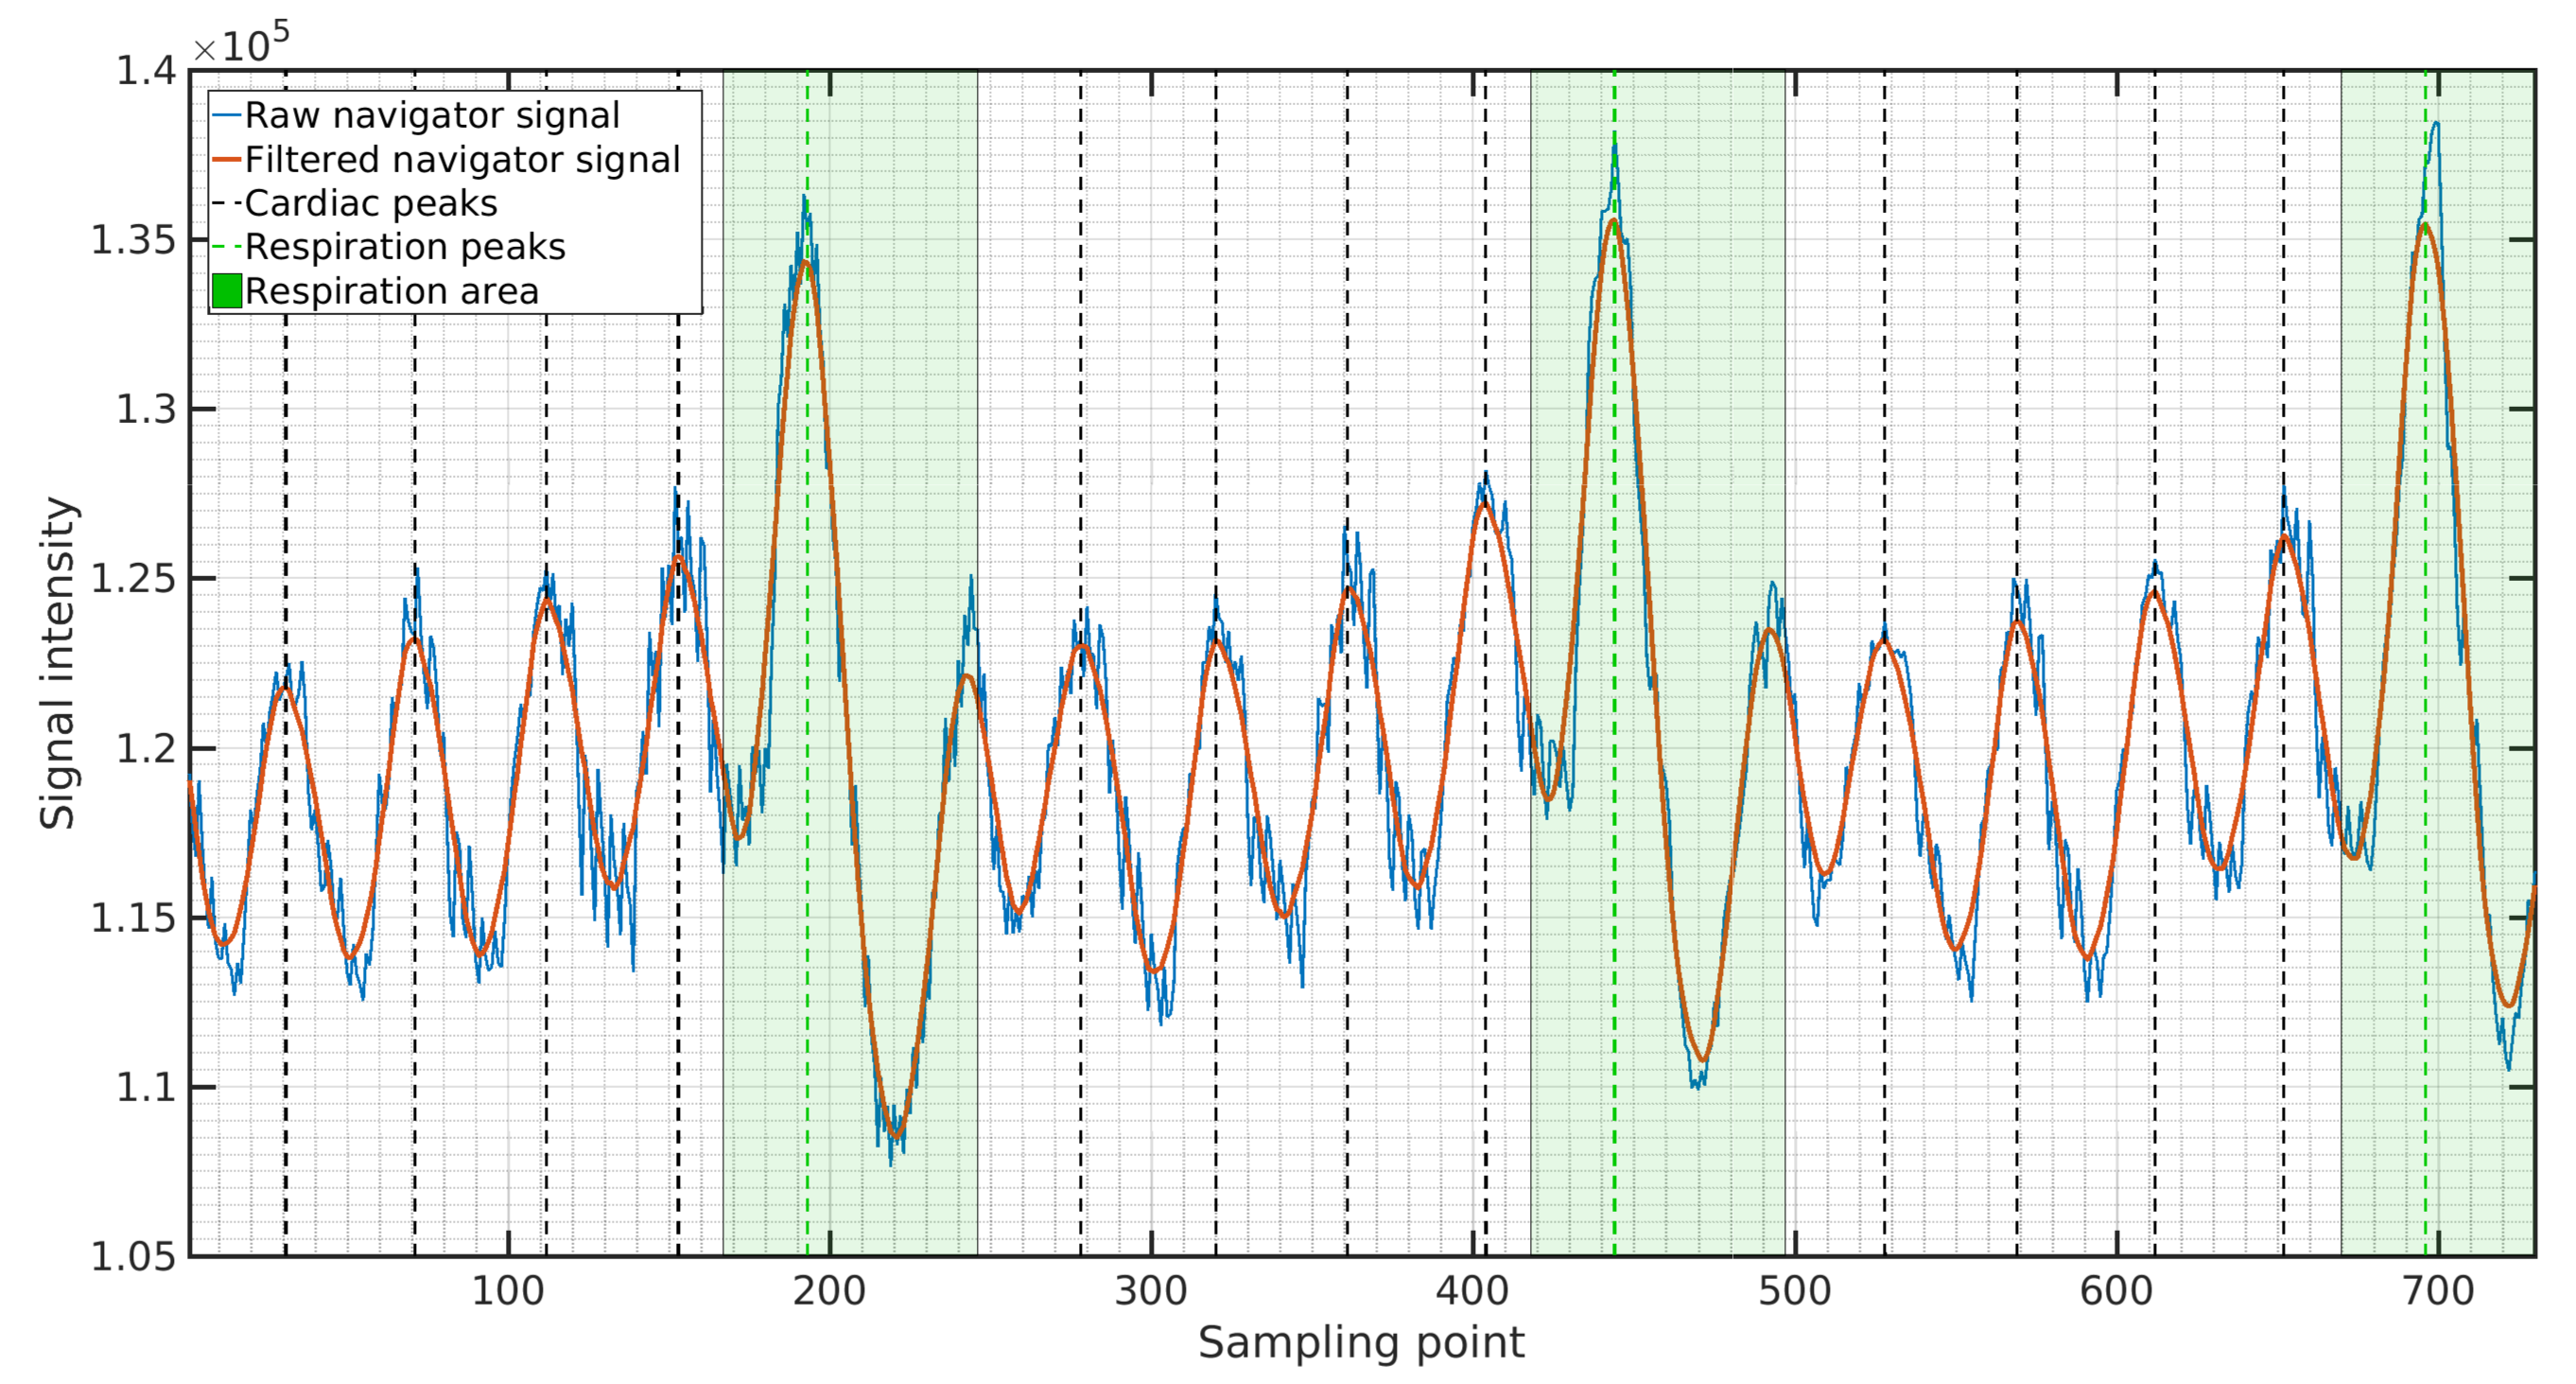
An intrinsic navigator signal was obtained from each acquired read-out by taking the last data point sampled before the start of the readout gradient. The resulting navigator function was then filtered using a Savitzky-Golay smoothing filter6 with a width of 90ms followed by peak detection to obtain cardiac cycle onsets. For respiration detection the original navigator function was smoothed with a broader filter of 400ms. To reconstruct cardiac cine frames a 15.5ms wide sliding-window-reconstruction7 was applied with a frame shift of 3.1ms (48 reconstructed cine). Image reconstruction was performed in MATLAB using state-of-the art regridding8.
Phantom: UTE-MRI measurements were performed on a home-built flow phantom3 with the following parameters: 0.5ms/5.0ms/1h45min TE/TR/TA and 2 averages. For comparison a Cartesian 3D-FLASH flow mapping sequence was used: 2.5ms/6.5ms/1h25min TE/TR/TA and 4 averages. Both sequences used: 32x32x32mm³ FOV and 200x200x200 matrix size.
In vivo: Measurements were performed in healthy mice (male, C57BL/6J, 6 months old) using a two-channel quadrature cryoprobe and either the FLASH sequence (n=5) with ECG- and respiratory gating or the 4D-PC-UTE sequence (n=5) with self-gating. An isotropic resolution of 230µm was acquired. The FLASH sequence used 25% readout Partial-Fourier, resulting in a TE/TR of 2.1ms/5.0ms acquiring 20 frames of the cardiac cycle with an effective TA between 1h35min and 1h55min. The UTE acquisition used TE/TR of 0.5ms/3.1ms and a fixed TA of 1h58min. All measurements were performed on a 9.4T Bruker BioSpec-USR 94/20 MR scanner.
Results
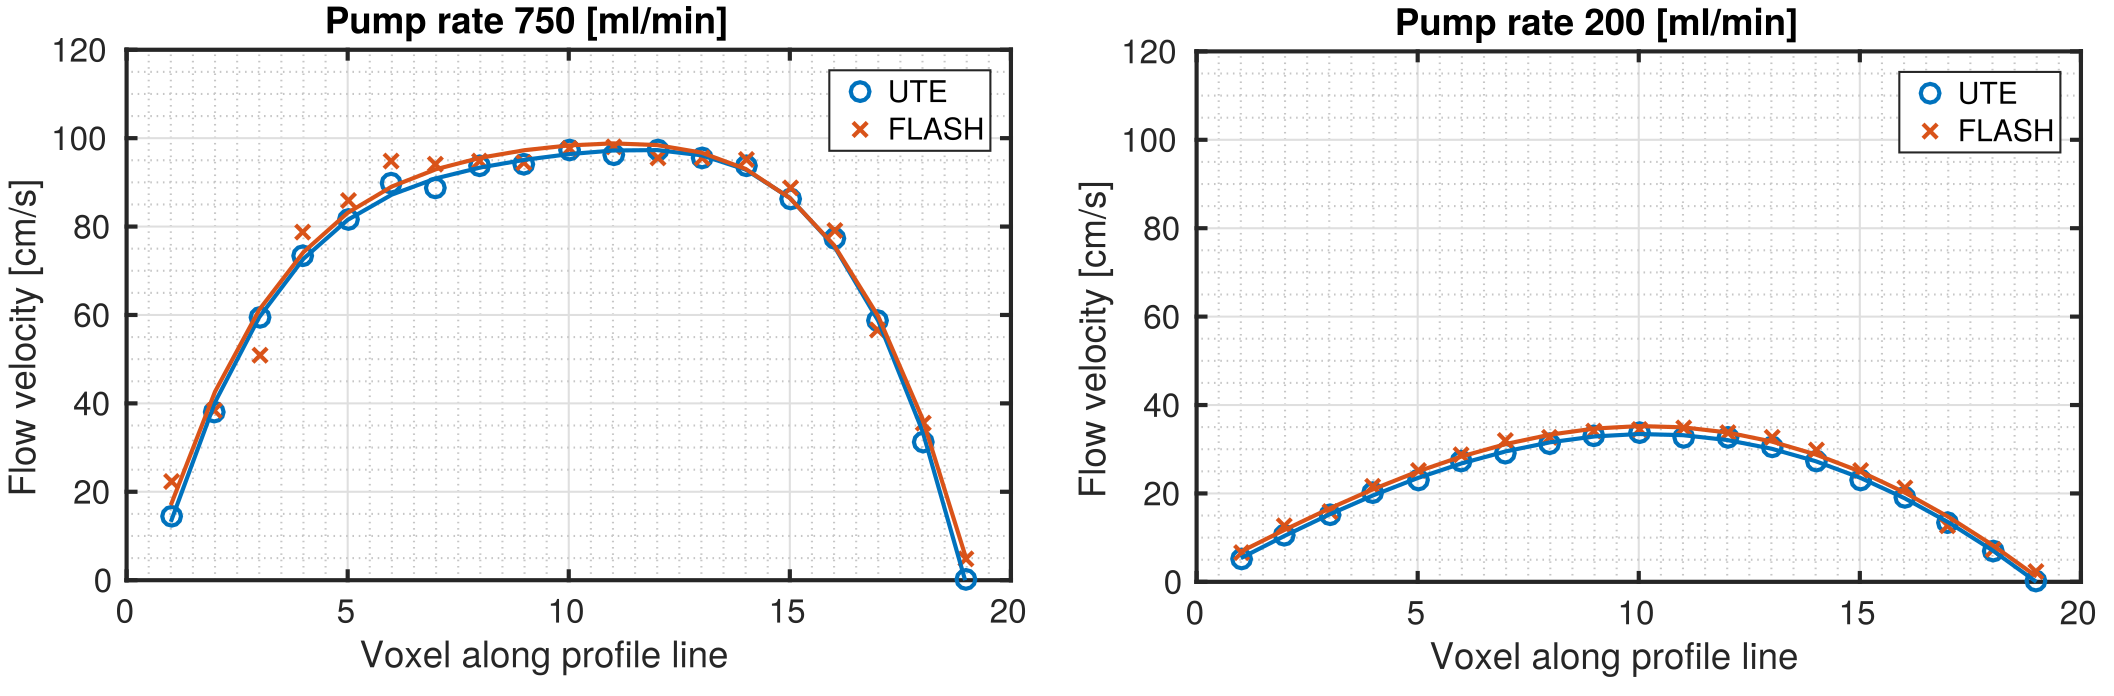
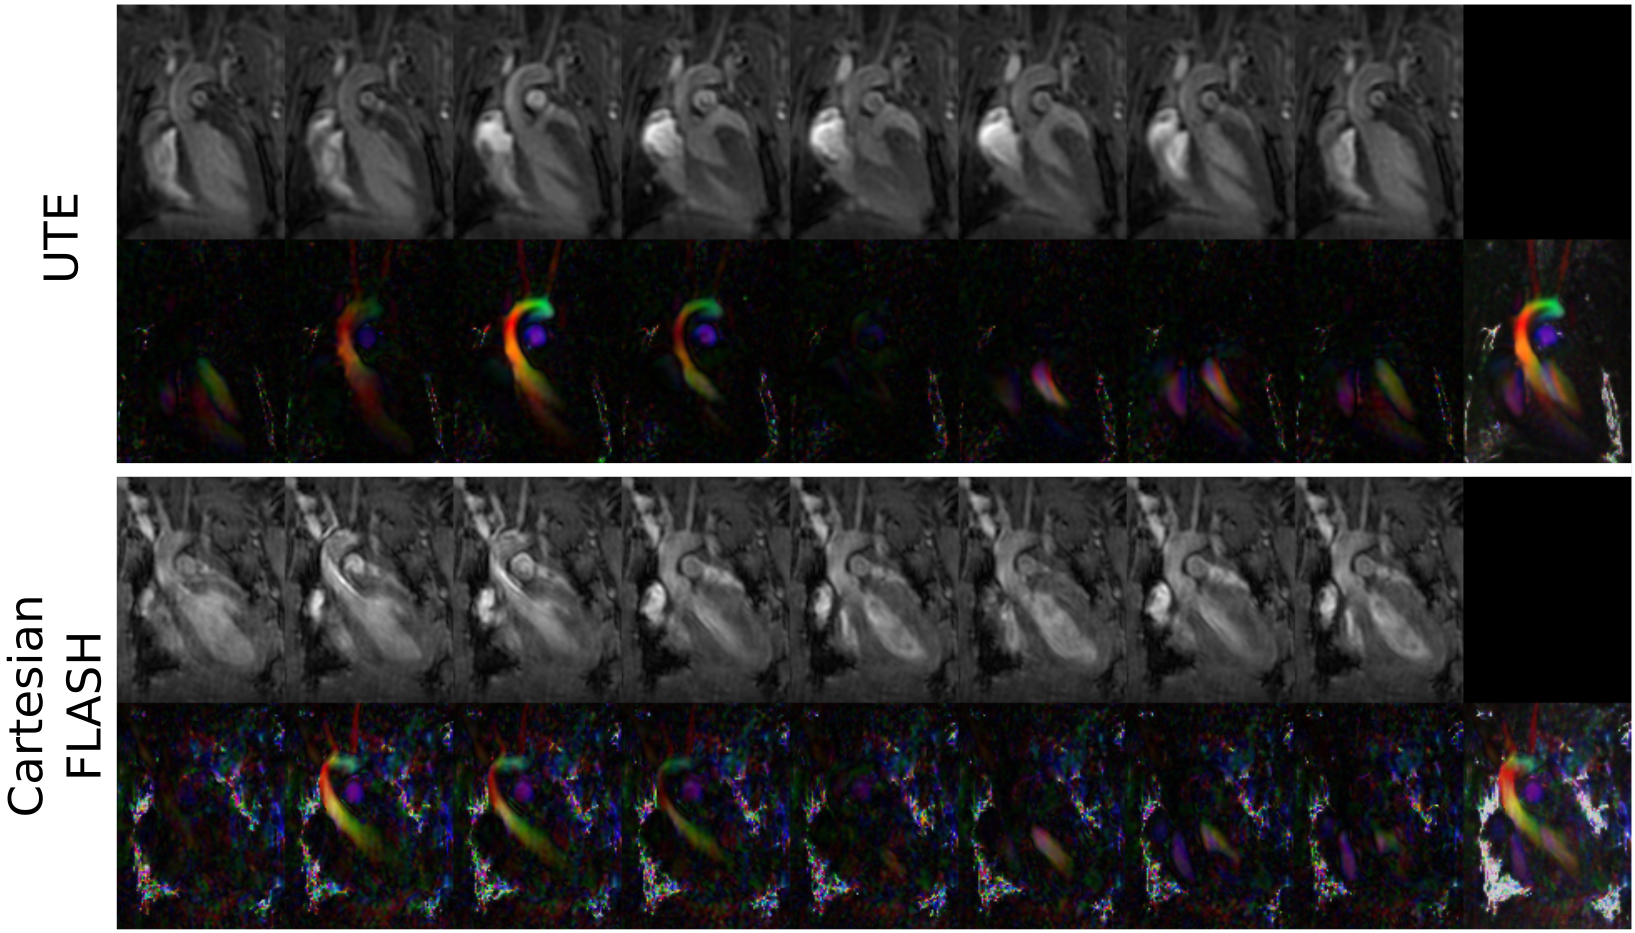
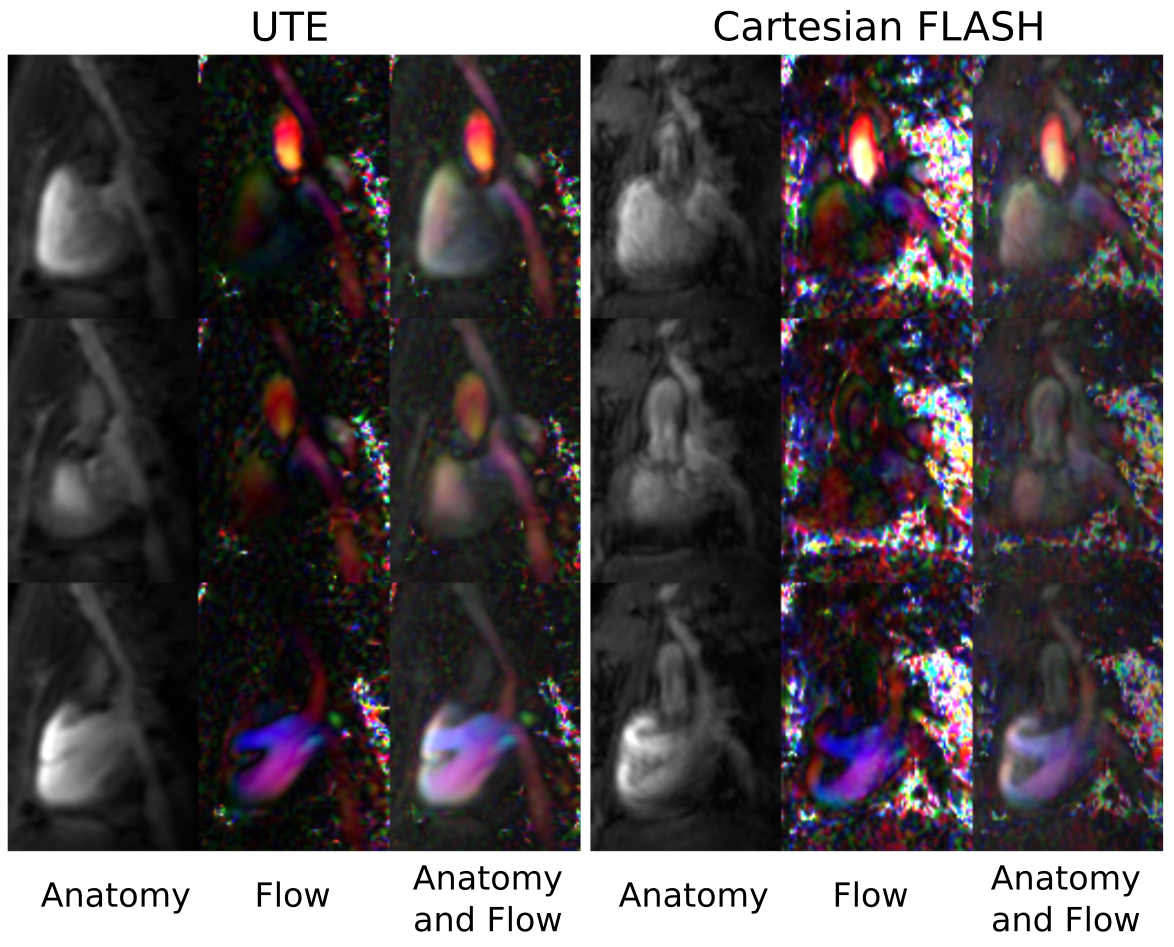
Velocity profiles across the tubes of the flow phantom for two different pump rates (Fig. 1), revealed close agreement between the 4D-PC-UTE and FLASH sequence with the FLASH sequence showing slightly higher flow velocities of 3.8±1.0% on average. In vivo, navigator signals (Fig. 2) obtained from the three-dimensional k-space center of the UTE acquisition were well suited for the detection of both cardiac and respiratory onsets and resulted in a superior gating efficiency of 61.8%±11.5% versus the external ECG- and respiratory triggered FLASH sequence (48.5%±4.9%).The reconstructed UTE images (Fig. 3 and 4) were free of major artifacts and SNR (left ventricular cavity (LVC): 8.9±2.5, myocardium (M): 15.7±1.9) and CNR (7.8±2.4) values were nearly a factor of two higher than those of the FLASH reference sequence (SNR(LVS): 5.6±1.2, SNR(M):10.1±1.4, CNR:4.5±2.2) resulting in a reduced standard deviation of the flow velocity in the myocardium (flow noise of 3.2±1.1cm/s) with the UTE sequence compared to the FLASH reference (10.8±6.8cm/s). The peak blood flow velocities in the ascending aorta were 132.8±18.3cm/s and 134.7±13.4cm/s for the UTE and FLASH sequence, respectively. Results obtained for the pulmonary artery were also similar for both sequences with respective values of 78.5±15.4cm/s (UTE) and 86.6±6.2cm/s (FLASH).Discussion and Conclusion
Our proposed self-gated 4D-PC-UTE sequence enabled measuring flow velocities of the whole heart in all three spatial dimensions with full temporal coverage of the cardiac cycle in healthy mice. Compared to a vendor supplied Cartesian 4D PC-FLASH sequence, image and flow artifacts were substantially reduced accompanied by higher SNR and CNR. In addition, the time consuming and unreliable active external ECG gating was unnecessary. Even though the applied center-out 3D-UTE sampling technique requires more readouts by a factor of π to fill the 3D k-space completely the increased amount of readouts can be compensated easily by shorter echo- and repetition-times in combination with a more efficient retrospective self-gating strategy. In future work the employed 3D-UTE sampling could be further improved by using golden-angle based rotation angles in order to further increase k-space homogeneity after self-gating and by including a compressed sensing reconstruction algorithm to ultimately reduce acquisition time.Acknowledgements
No acknowledgement found.References
1. Firmin DN, Nayler GL, Kilner PJ, Longmore DB. The application of phase shifts in NMR for flow measurement. Magn Reson Med. 1990;14:230–2412.
2. Rebergen SA, van der Wall EE, Doornbos J, de Roos A. Magnetic resonance measurement of velocity and flow: Technique, validation, and cardiovascular applications. Am Heart J. 1993;126:1439 – 1456.3.
3. Bovenkamp PR, Brix T, Lindemann F, Holtmeier R, Abdurrachim D, Kuhlmann MT, Strijkers GJ, Stypmann J, Hinrichs KH, Hoerr V. Velocity mapping of the aortic flow at 9.4 T in healthy mice and mice with induced heart failure using time-resolved three-dimensional phase-contrast MRI (4D PC MRI). MAGMA. 2015;28:315–3274.
4. Dumoulin CL, Souza SP, Darrow RD, Pelc NJ, Adams WJ, Ash SA. Simultaneous ac-quisition of phase-contrast angiograms and stationary-tissue images with Hadamard encoding of flow-induced phase shifts. J Magn Reson Imaging. 1991;1:399–404.5.
5. Pelc NJ, Bernstein MA, Shimakawa A, Glover GH. Encoding strategies for three-direction phase-contrast MR imaging of flow. J Magn Reson Imaging. 1991;1:405–4136.
6. Savitzky A, Golay MJE. Smoothing and Differentiation of Data by Simplified Least Squares Procedures. Anal Chem. 1964;36:1627–16397.
7. Riederer SJ, Tasciyan T, Farzaneh F, Lee JN, Wright RC, Herfkens RJ. MR fluoroscopy: Technical feasibility. Magn Reson Med. 1988;8:1–15
8. Zwart NR, Johnson KO, Pipe JG. Efficient sample density estimation by combining gridding and an optimized kernel. Magn Reson Med. 2012;67:701–710.
Figures