3213
Fast self-navigated PC-MRI for human cardiac flow measurements using retrospective radial sampling1Experimentelle Physik V, Universität Würzburg, Würzburg, Germany, 2Medizinische Klinik und Poliklinik I des Universitätsklinikums Würzburg, Würzburg, 3Fraunhofer IIS, Fraunhofer EZRT, Magnetresonanz- und Röntgenbildgebung (MRB)
Synopsis
A self-navigated radial PC-MRI sequence is presented for fast ECG-free 2D-Cine measurements with 3-dimensional flow encoding. The radial DC signal was used for retrospective self-navigation. Reconstructions were performed with an iterative CG-Sense algorithm. For each flow encoding step 2D-Cines with 30 frames, respectively, and a spatial resolution of 2.34 mm were reconstructed. The time-dependent volume flow through the pulmonary artery was quantified and the blood flow through the ventricles was visualized. The proposed method does not rely on ECG signals and is immune to distortions often observed with conventional triggering. It hence yields high potential for clinical applications.
Purpose
PC-Cine MRI is a potential early diagnostic tool of cardiovascular MRI since it provides non-invasive measurements of the blood flow and vascular hemodynamics as well as quantitative information such as the aortic pulse-wave velocity. Major drawbacks of conventional ECG-triggered flow-encoding techniques restricting the use of these methods in clinical applications is the long measurement time and the strong susceptibility to trigger errors, which are caused by magneto hydrodynamic effects in high magnetic fields and by arrhythmia. Retrospective radial PC-MRI is an alternative to these methods since it provides fast measurements and a very flexible data analysis as well as an intrinsic cardiac motion signal that can be used for self-navigation.Materials and Methods
MR measurements
All measurements are carried out in healthy volunteers on a 3T whole body MRI system with a 30-channel receiver channel. A custom-built radial FLASH sequence with a repetition time of 5.5 ms and an echo time of 3.6 ms was used for 2D-Cine measurements and 3D-flow encoding. For the 3-dimensional velocity quantification 4 encoding steps were acquired sequentially using a balanced 4-point encoding scheme and a VENC of 167 cm/s. Each velocity-encoding step consists of 2000 golden angle-distributed radial read-outs and was acquired during a breath-hold. The scan time for each velocity-encoding step was 11s, resulting into a total scan time of 44s.
Self-navigation
After the measurement the receiver channel closest to the heart was analyzed. Self-gating (SG) signals were extracted from the radial center k-space signal and processed with matched filters1 in order to reduce high frequency noise. For retrospective motion synchronization, trigger time stamps and the relative phases in the cardiac cycle were assessed with thresholds from the cardiac motion signals, as described previously2,3. The radial projections were afterwards sorted according to their corresponding cardiac phase.
Reconstruction
For image reconstruction coil maps were estimated by using adaptive combining4. Data was selected using KWIC filter view sharing5 and iterative Conjugate Gradient-SENSE6 was used in order to solve the Least-Squares minimization problem:
$$\Psi(x)=\text{argmin}_x ||y-G\cdot x||^2_2$$
where $$$\Psi(x)$$$ is a cost function which needs to be minimized in order to find the optimum image $$$x$$$ , $$$y$$$ the under sampled noisy data, and $$$G$$$ the encoding matrix, which also contains the information about the coil sensitivities. For each velocity encoding step 30 cine frames were reconstructed iteratively (FOV: 30x30 cm2, resolution 2.34x2.34 mm2, slice thickness: 5 mm). For data processing and visualization Matlab (The Mathworks, Inc., Natick, USA) and Ensight (CEI Software, USA) were used.
Results
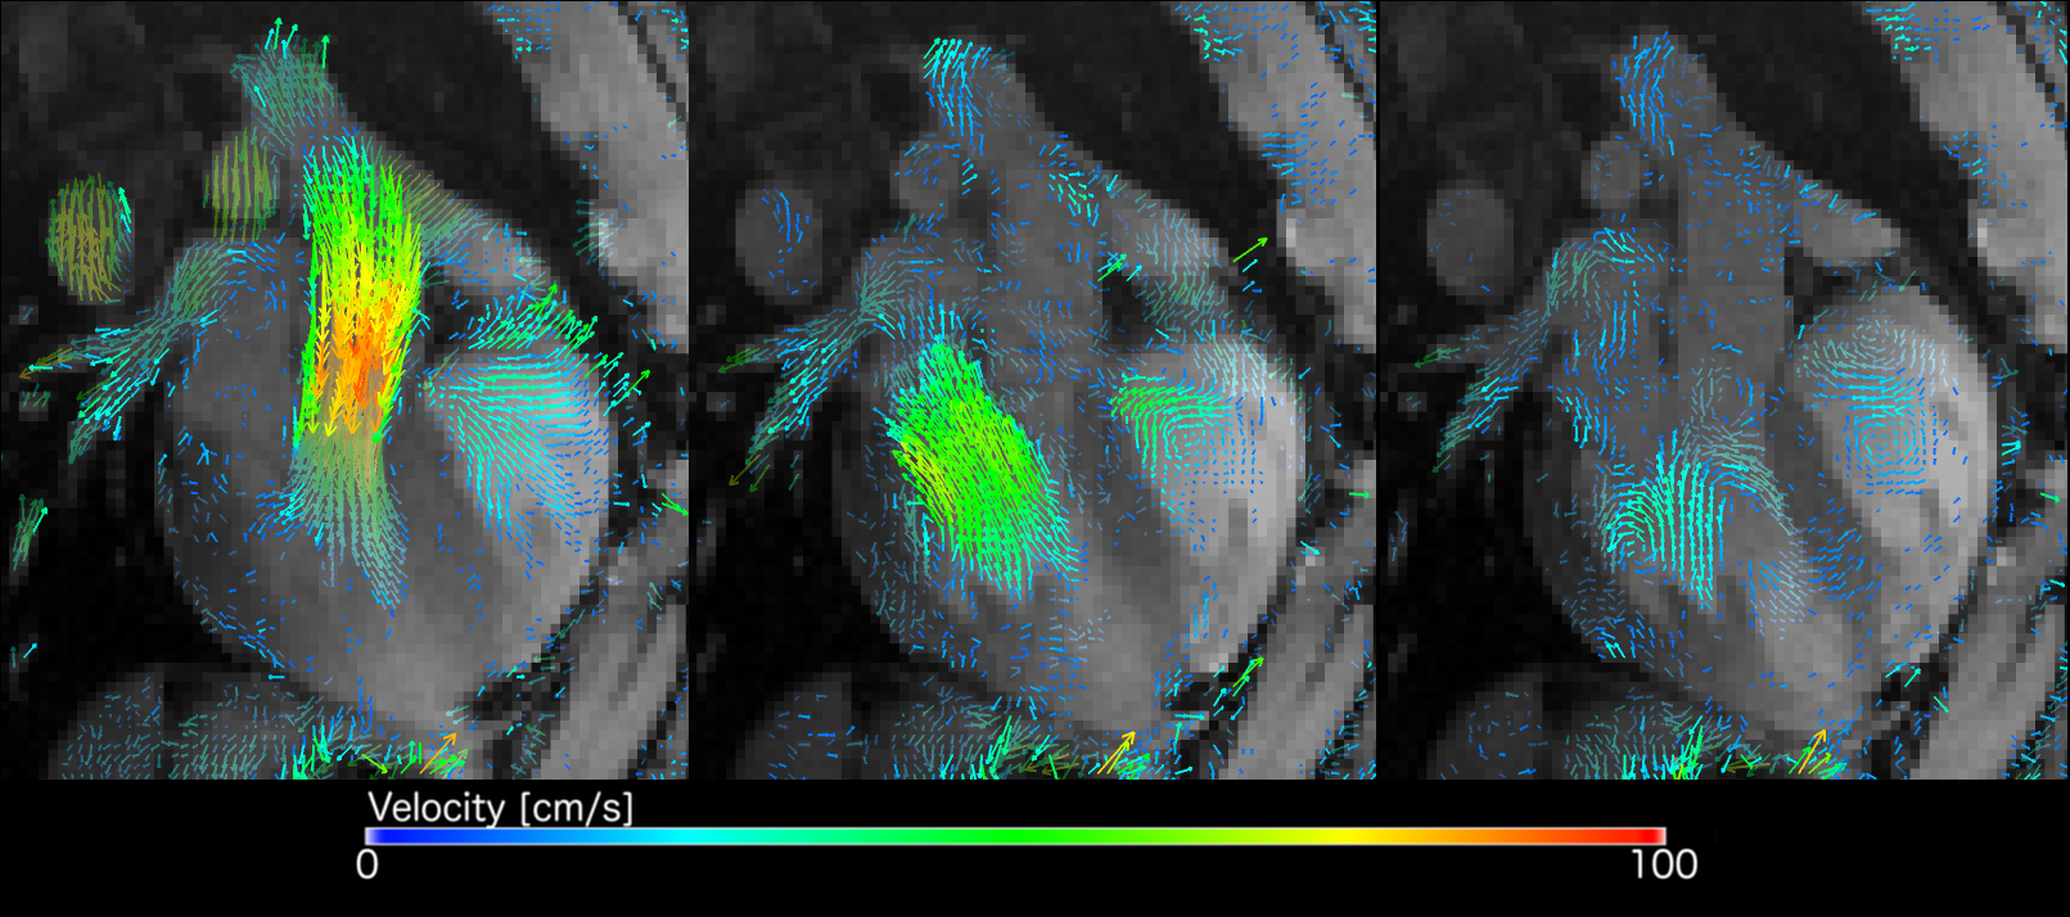
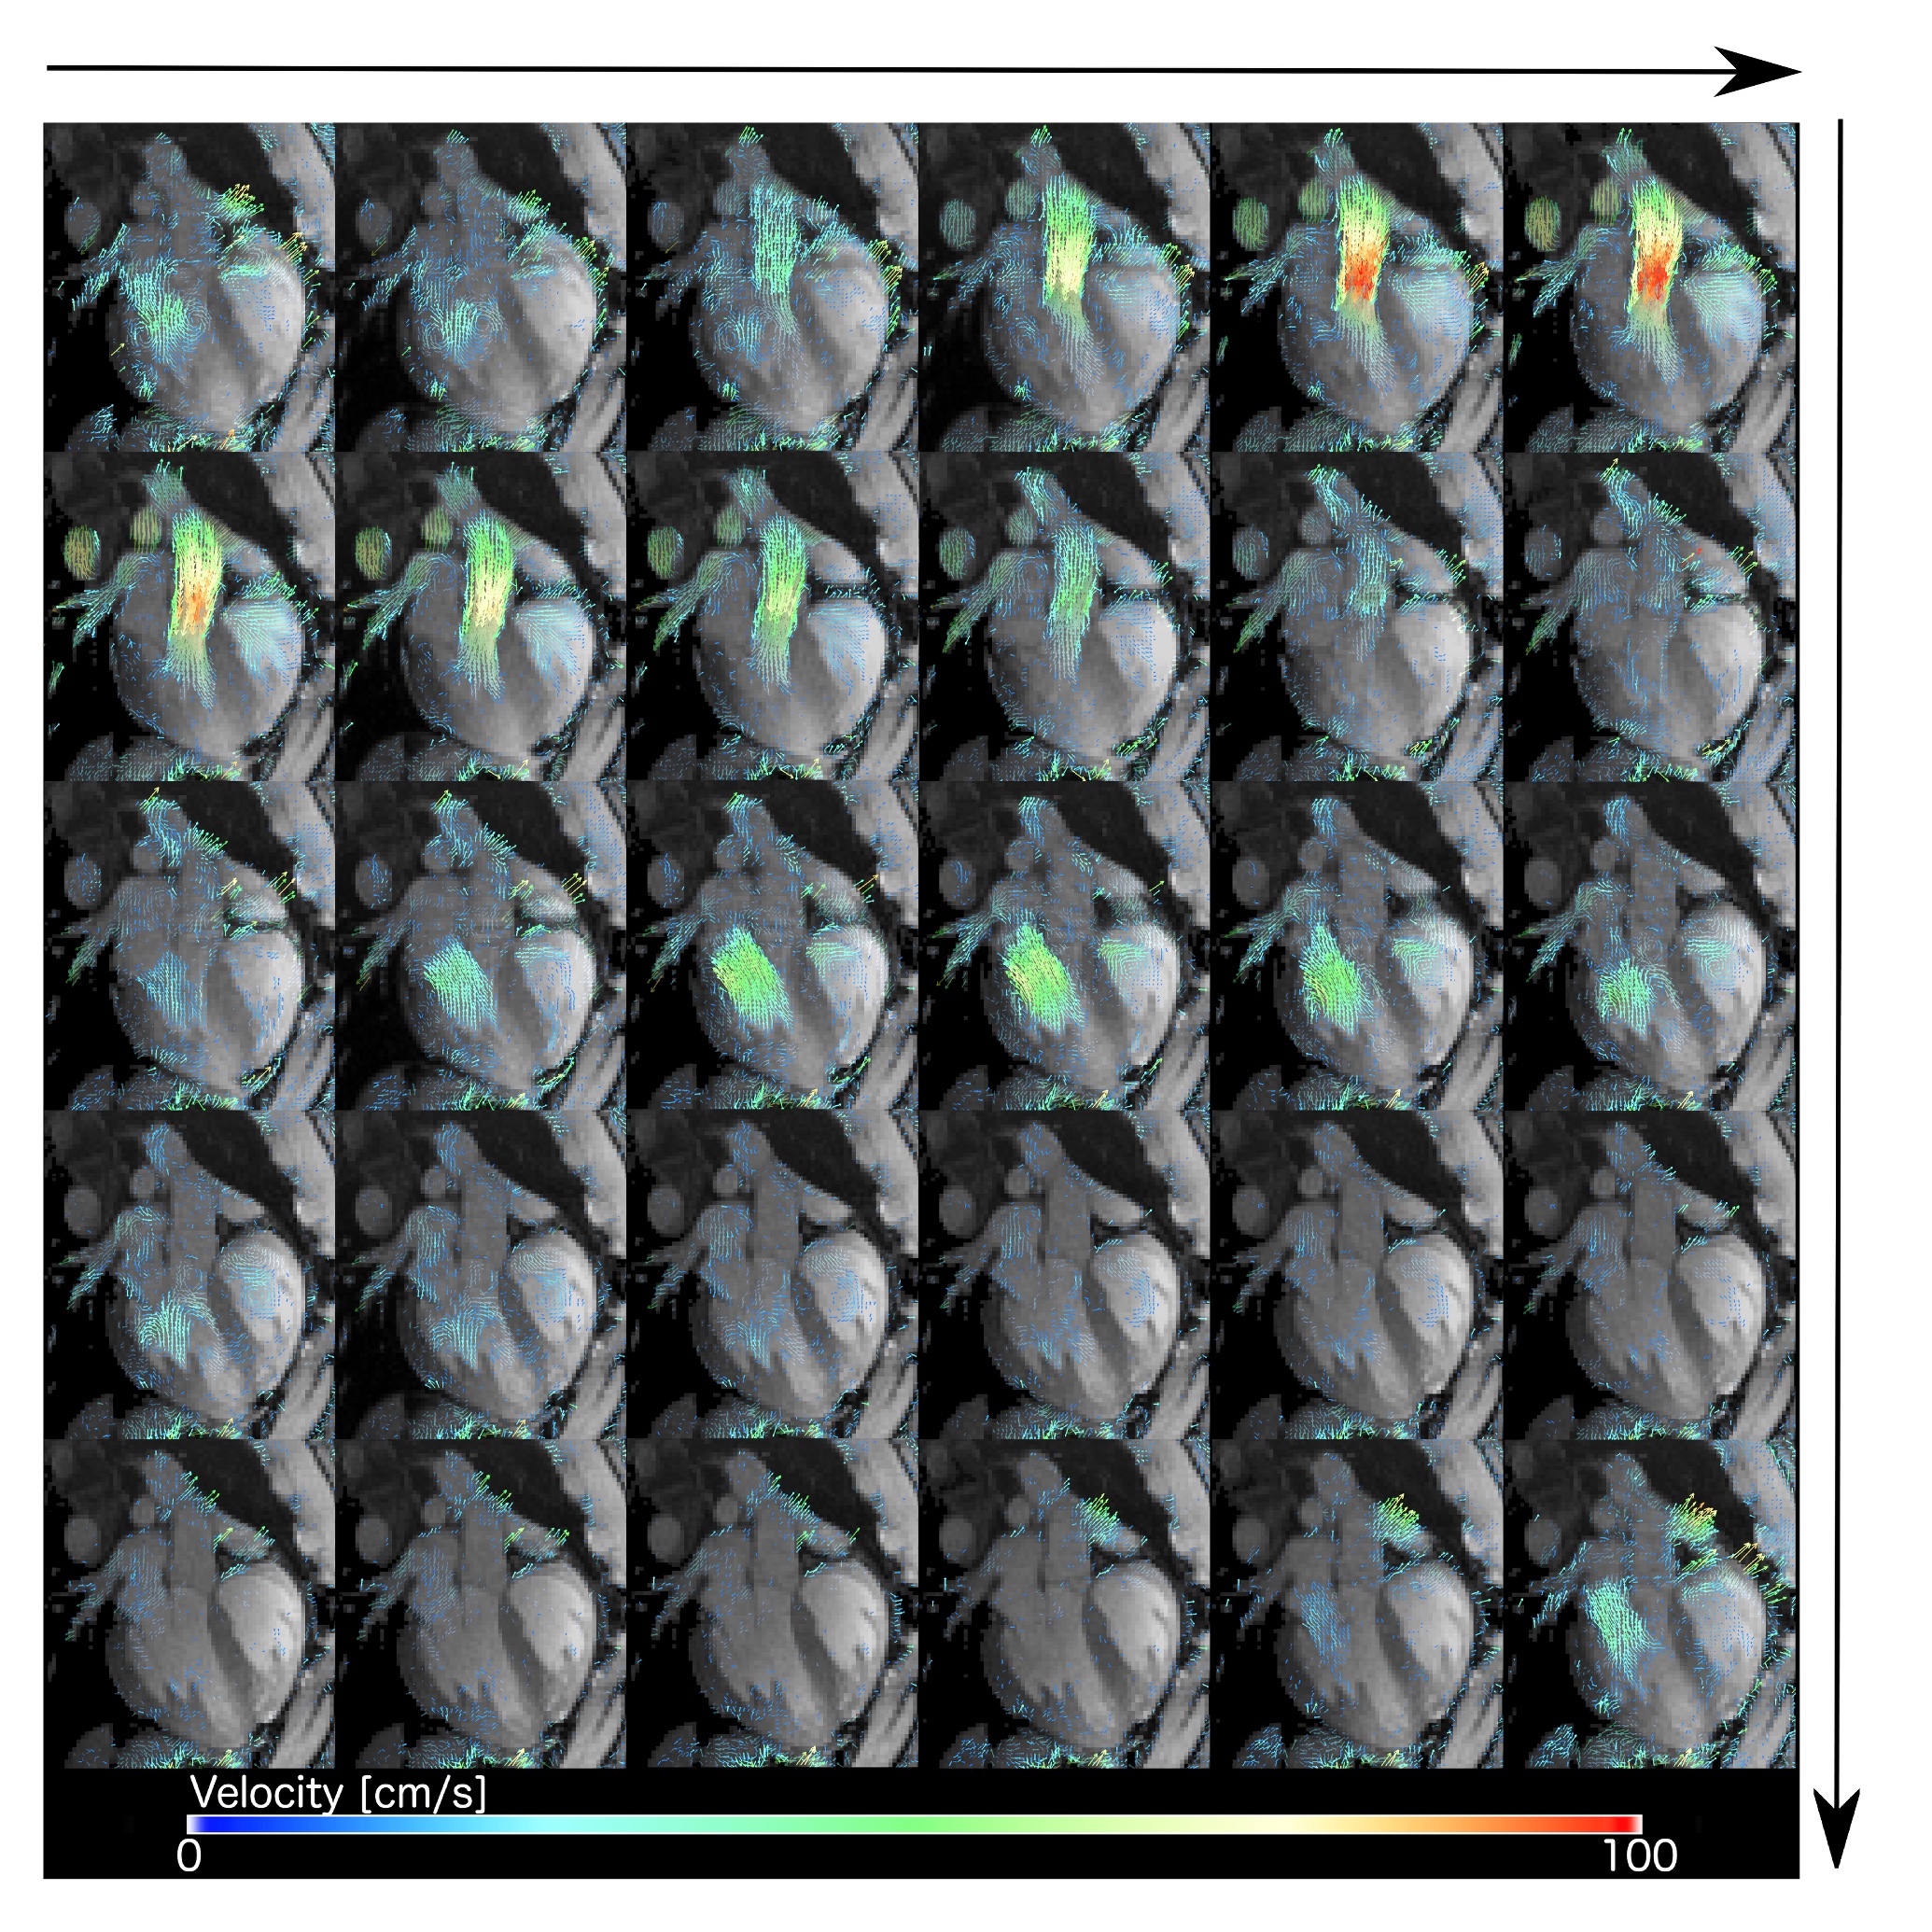
Flow-encoded radial data was obtained from healthy volunteers. Fig. 1a shows exemplary results of the extracted self-gating signal, acquired in a long axis view of the heart. A histogram of the cardiac periods determined from the SG signals is shown in Fig. 1b. In this exemplary measurement the mean cardiac period was (1.11±0.02)s. Fig. 1c displays a frame of the corresponding retrospective 2D-Cine reconstruction and Fig. 1d the measured volume flow through the pulmonary artery. To visualize the time dependent 3-dimensional blood flow through the heart, vector presentations of the velocities were plotted at different cardiac phases (Fig. 2). The inflow of blood during the systole into the right ventricle (left), the outflow (middle) as well as flow vortexes in both ventricles (right) are clearly recognizable. Fig. 3 illustrates the blood flow at all 30 phases of the cardiac cycle.Discussion and Conclusion
In this abstract we present a highly accelerated self-navigated PC-MRI technique based on a radial golden angle trajectory and retrospective reconstruction. The proposed techniques does not rely on ECG signals and is therefore immune distortions, which are common problems of triggered measurements at high magnetic field strengths. The retrospective analysis of the acquired data would also allow a correction of arrhyhthmic heart beats during the measurement. Due to the fast measurement and the flexible data analysis the proposed technique yields high potential for the use in clinical applications.Acknowledgements
Acknowledgments: This work was supported by grants from the Deutsche Forschungsgemeinschaft (SFB 688 B5, Z2), the Bundesministerium für Bildung und Forschung (BMBF01 EO1004) and the Comprehensive Heart Failure Center (CHFC).References
[1] Herold et al, Proc. ISMRM 2016: 0466
[2] Winter et al., JCMR, [2013], 15:88-98
[3] Winter et al., Magn Reson Med, [2016]; DOI: 10.1002/mrm.26068
[4] Walsh et al., Magn Reson Med, [2000]; 43:682-690
[5] Song et al., Magn Reson Med, [2000]; 44:825-832
[6] Pruessman et al., NMR in Biomed, [2006], 19:288-299
Figures
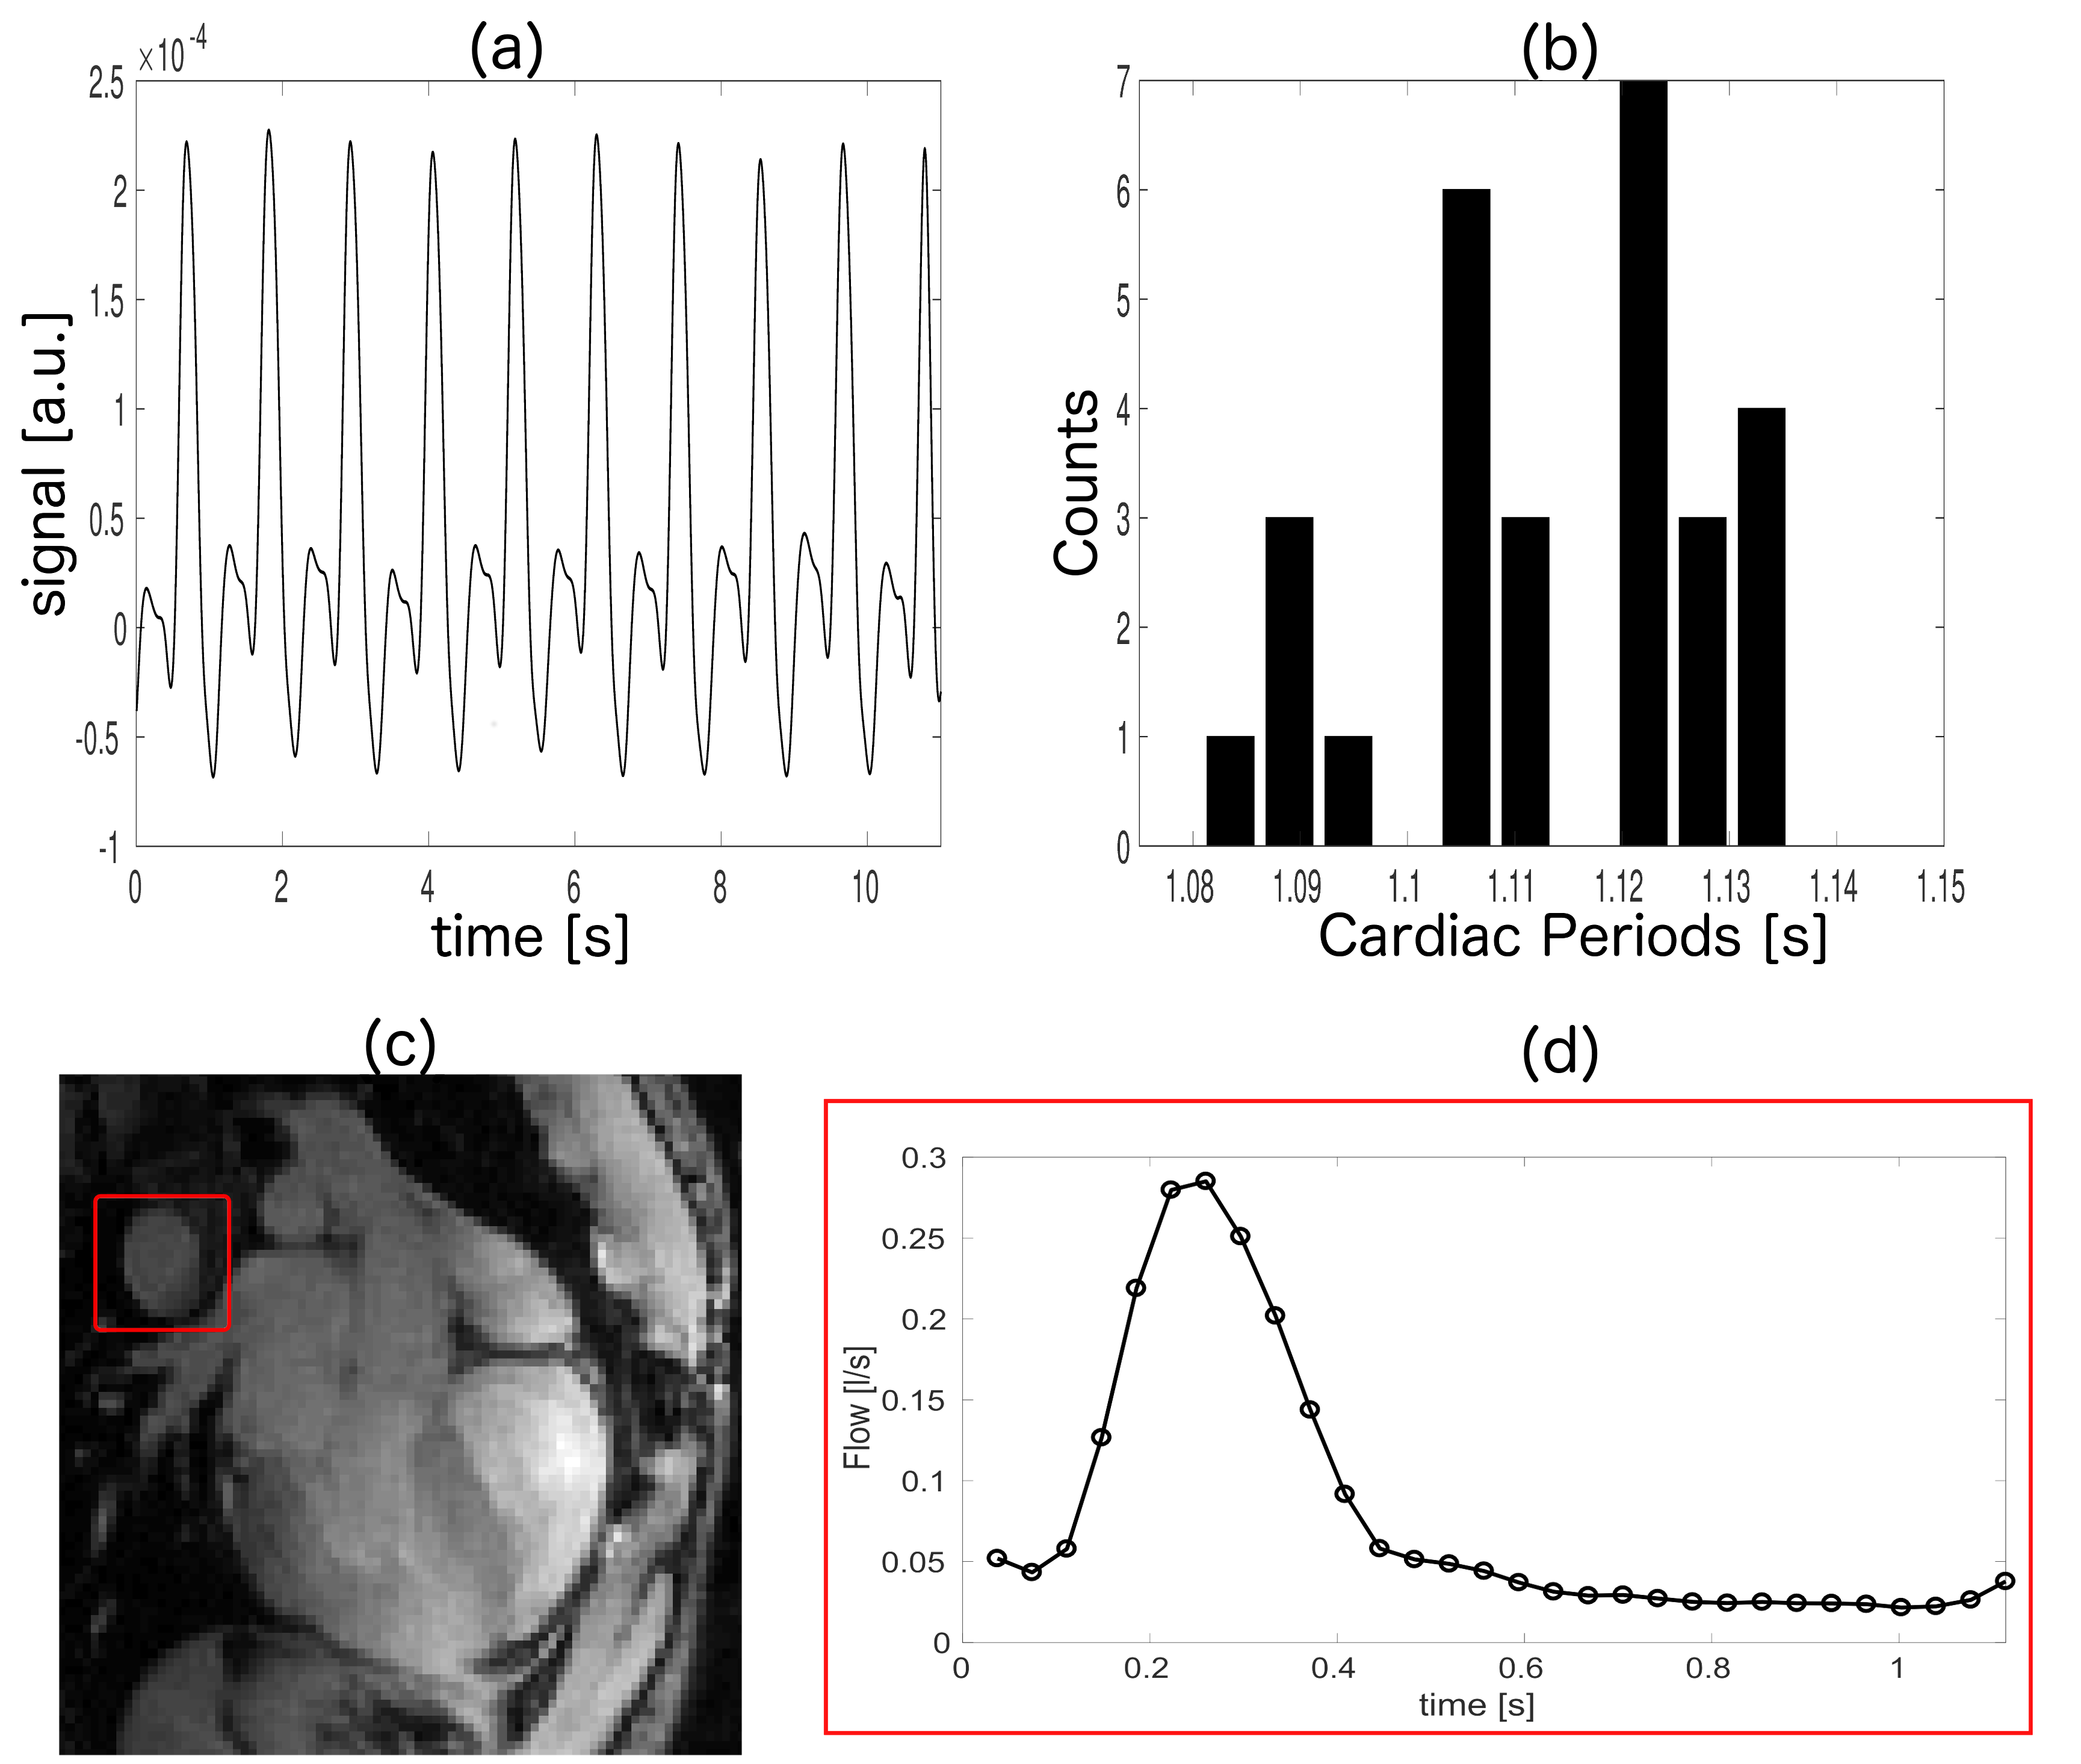
(a) Exemplary SG signal of a healthy volunteer
(b) Histogram of the cardiac periods determined with the SG signal
(c) Exemplary frame of the reconstructed cardiac cine (long axis view)
(d) Measured volume flow (l/s) through the pulmonary artery (red square in (c))