3206
Quantitative characterization of disease progression in a mouse model of non-alcoholic steatohepatitis using molecular MR and non-contrast MR imaging1A.A. Martinos Center for Biomedical Imaging, Charlestown, MA, United States, 2Division of Surgery, Massachusetts General Hospital, Boston, MA, United States
Synopsis
To deliver a non-invasive quantitative measure of patients with nonalcoholic fatty liver disease (NAFLD) who are likely to develop a fibrotic pathology, we characterized the natural history of a nonalcoholic steatohepatitis (NASH) mouse model using MRI. Characterization included fat quantification and MR relaxometry measurements by imaging at 4 time points and comparing with histology and biochemical markers. Fibrogenesis was assessed using the novel Gd-based MR probe, Gd-Hyd which was previously shown to detect fibrogenesis in a mouse CCl4 model of liver fibrosis
Introduction
Nonalcoholic steatohepatitis (NASH), characterized by the presence of inflammation and fibrosis, is a growing epidemic with 2–5 % of the US population afflicted. If left unchecked, fibrosis will progress to cirrhosis, leading to impaired liver function and increased mortality. As such there exists a major unmet clinical challenge to detect disease at an early stage, to identify disease progression and monitor responses to anti-fibrotic therapies.Purpose
The purpose of this study was to a) characterize the natural history of NASH by fat quantification and MR relaxometry measurements as a way to accurately describe disease progression and b) determine whether Gd-Hyd could quantify fibrogenesis in a mouse model of NASH liver fibrosis.Methods
We synthesized a small molecule Gd-based MRI probe (Gd-Hyd) that targets allysine1 from DOTAGA2 in three steps. Male C57BL/6 were fed either normal chow as control (n=24) or a choline-deficient, L-amino acid-defined, high-fat diet consisting of 60 kcal% fat and 0.1% methionine by weight (CDAHFD) for 2-14 weeks to induce NASH (n=24). Mice were imaged at 2, 6, 10 and 14 weeks (n=6 per group). All mice were imaged on a 9.4T MR scanner, first with a Dixon sequence to quantify fat content, then a inversion recovery RARE sequence to map T1 baseline and a multiecho gradient echo sequence to map T2* baseline. T1-weighted gradient echo imaging was performed prior to and following intravenous injection of Gd-Hyd (200 nmol/g) and repeated for 30 minutes. Following MRI, the liver was collected and assessed for hydroxyproline content and histology.Results
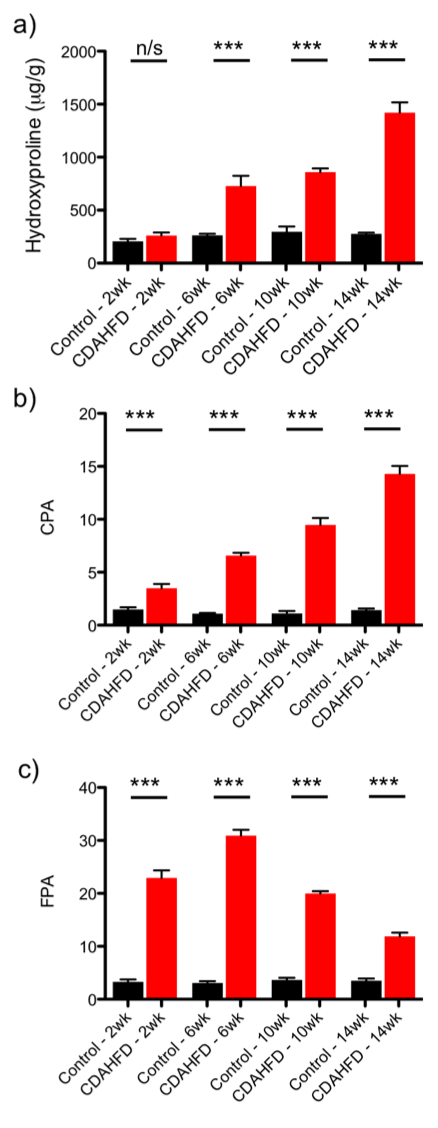
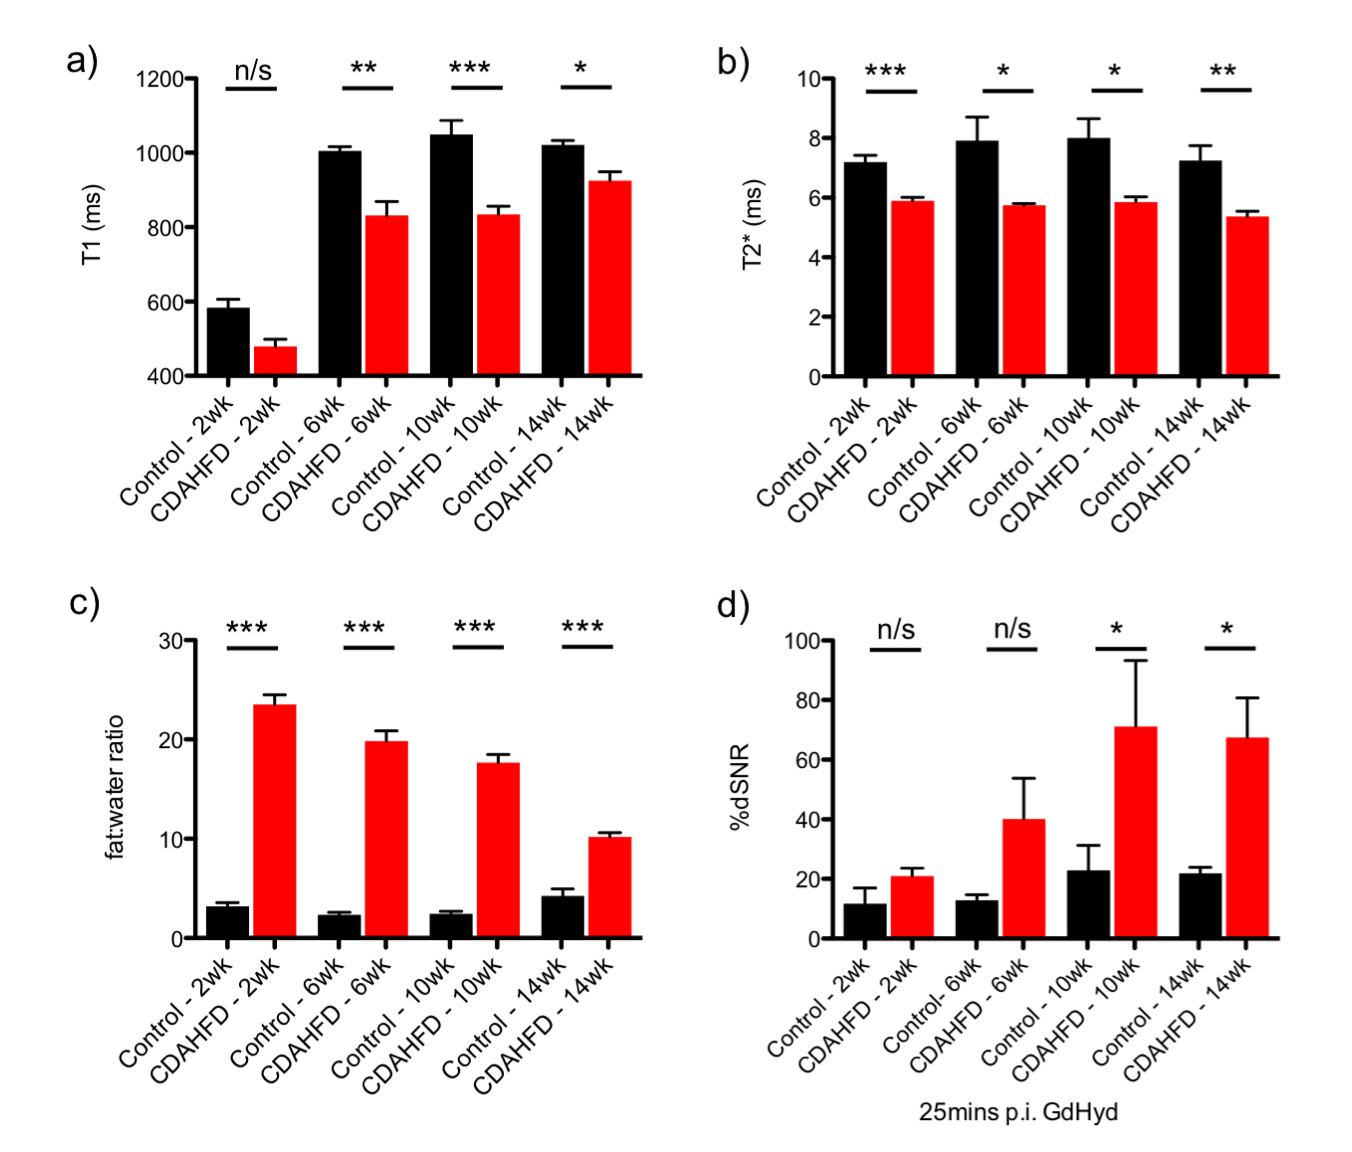
Ex-vivo tissue analysis of CDAHFD model show that hydroxyproline levels were not significantly elevated in the CDAHFD group compared to control animals at 2 weeks but from 6-14 weeks of diet the collagen burden, i.e fibrosis, in the CDAHFD model was significantly enhanced compared to control animals (Figure 1a). Morphometric assessment of stained liver sections revealed that the collagen proportional area (CPA) was in agreement with the hydroxyproline measurements, confirming the presence of fibrosis starting after 2 weeks of diet (Figure 1b). The fat proportional area (FPA) assessed by histology showed levels of fat increasing up to week 6 on the CDAHFD before decreasing steadily up to 14 weeks (Figure 1c). In vivo relaxometry assessment of the CDAHFD model shows T1 and T2* relaxation times are consistently lower in the CDAHFD groups compared to the control mice across the 14 weeks of diet (Figure 2a,b). The fat:water ratio as assessed by Dixon sequence showed elevated steatosis in the CDAHFD mice at 2 weeks compared to controls, decreasing steadily over the 14 weeks (Figure 2c).
No significant difference in signal enhancement was seen between control mice and CDAHFD mice after Gd-Hyd injection at 2 and 6 weeks of diet, but at 10 and 14 weeks, a significant signal enhancement is seen in the CDAHFD mice. Figure 2d shows the percent SNR increase in liver after Gd-Hyd injection measured at 25 min post injection for all 8 groups of mice.
Discussion
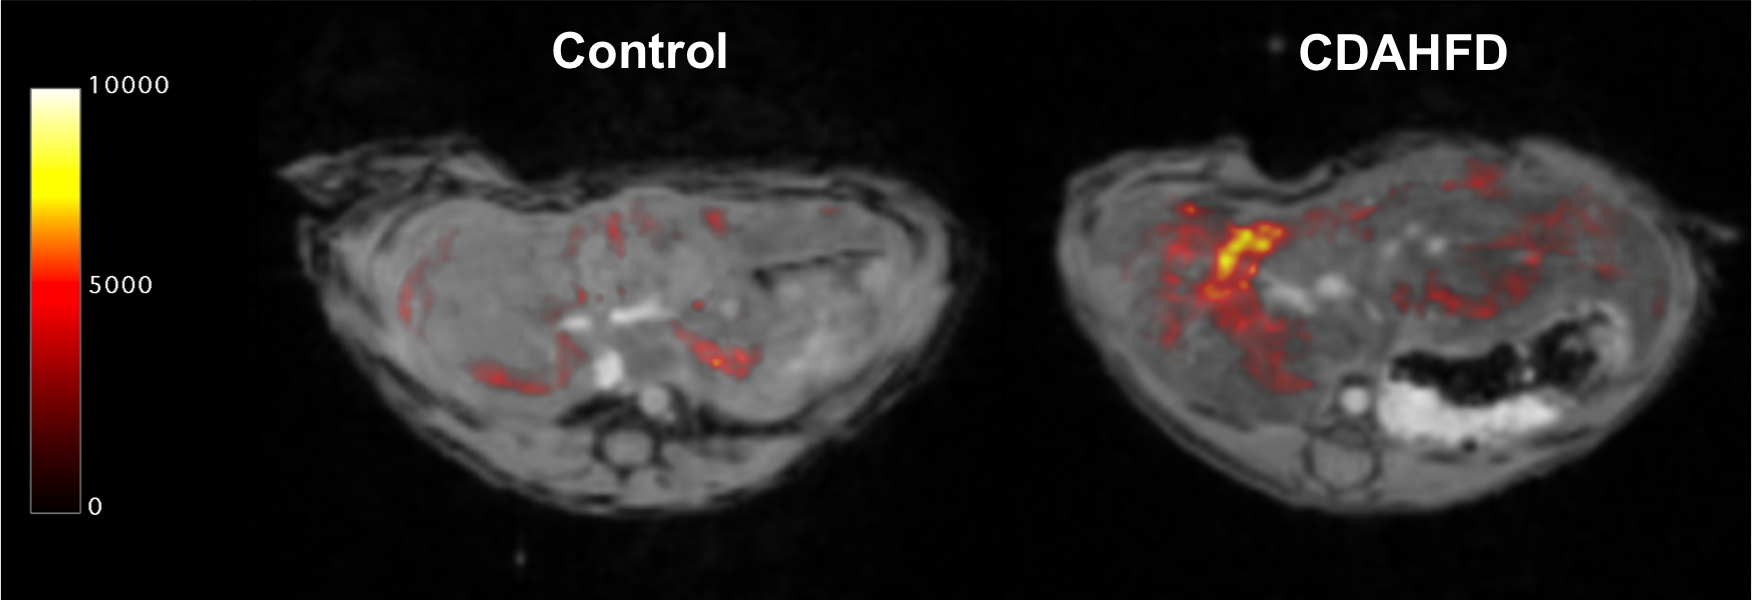
The CDAHFD model recapitulates the disease progression from NAFLD to NASH with an early infiltration of fat in the liver hepatocytes leading to macrovesicular steatosis. As the diet persists, inflammation and fibrosis increase, and continued hepatocyte injury leads to a subsequent reduction in steatosis. Relaxometry consistently showed differences between control and CDAHFD groups at all time points. However neither T1 nor T2* was reflective of the increasing severity of disease progression. Gd-Hyd is a hydrazide derivative of GdDOTA designed for targeted binding to oxidized collagen as a marker of fibrogenesis. Gd-Hyd exhibits minimal off-target accumulation and rapid renal excretion. In a previous study Gd-Hyd was shown to detect fibrogenesis in a CCl4 model of liver fibrosis.1 Imaging with Gd-Hyd in the CDAHFD model showed no signal enhancement at early time points when steatosis levels are high and fibrosis is minimal. As fibrosis levels become elevated, the Gd-Hyd signal enhancement becomes significantly greater in the CDAHFD group compared to the control group, suggesting that Gd-Hyd uptake tracks with increasing fibrotic severity (Figure 3).Conclusion
Molecular MRI combined with Dixon fat imaging can assess liver fibrogenesis and fat content throughout the entire liver in mice with NAFLD/NASH. The Gd-Hyd probe raises new possibilities for clinical imaging of NASH in combination with other advanced MR techniques to accurately stage disease and monitor treatment response.Acknowledgements
This work was supported by NIDDK (DK104302, DK104956), NIBIB (EB009062), and the Athinoula A. Martinos Center for Biomedical ImagingReferences
1.Chen HC, et. al. Quantitative molecular magnetic resonance imaging (MRI) of lysyl oxidase-mediated collagen crosslinking during liver fibrosis, Hepatology, 2014; 60: 205A
2.Levy SG, et. al. Development of a multigram asymmetric synthesis of 2-(R)-2-(4,7,10-Tris tert- Butylcarboxymethyl-1,4,7,10-tetraazacyclododec-1-yl)-pentanedioic Acid, 1-tert-Butyl Ester, (R)-tert-Bu4-DOTAGA. Org Process Res Dev. 2009;13:535-542.
Figures