3205
Assessment of magnetic resonance imaging markers in the event of drug induced liver toxicity1Molecular and Clinical Pharmacology, University of Liverpool, Liverpool, United Kingdom, 2Centre for Pre-Clinical Imaging, University of Liverpool, Liverpool, United Kingdom, 3Institute for Veterinary Pathology, University of Zurich, Zurich, Switzerland
Synopsis
Challenges faced in diagnosis and treatment of drug induced liver injury (DILI) have formed the aim of this project to quantify non-invasive MRI and MRS markers to aide research into future therapeutics of DILI. Using an acetaminophen overdose model, we have managed to quantify 4 different MRI biomarkers: liver volume, T2 mapping, ADC and water/fat ratio. Significant changes were observed with an increase in liver volume and T2 relaxation and water/fat ratio, with a decrease in diffusion coefficient. Some degree of normalization in T2 and ADC values was noted after NAC treatment indicating that MRI and MRS can play an important role in the diagnosis of DILI.
Introduction
Drug induced liver injury (DILI) has been a major clinical problem to date with an estimated annual hospital admittance of between 10- 15 per 10,000 cases. DILI accounts for approximately 10 percent of all cases of acute hepatitis and it is the most common cause of acute liver failure in the United States and United Kingdom1. Linked to nearly 1000 drugs, it is also the main reason for removal of approved drugs from the market 2. Considering the nature and complexity of DILI, clinical screening methods are challenging and there is now a growing need for new robust diagnostic methods for these toxic conditions3. The primary objective of this study was to validate the use of MRI methods in characterising changes in liver morphology that surpasses the need for liver biopsies in assessing the degree and severity of the injury itself. Advanced imaging tools could provide an alternative platform in testing potential future therapeutics. We hereby aim to correlate MRI derived biomarkers with serum biomarkers of liver injury such as alanine amino transferase (ALT), total bilirubin, and high-mobility group box protein 1 (HMGB1) alongside histological evaluation to potentially assess the pathophysiology and damage of the liver due to acetaminophen (APAP) toxicity as well as recovery with the N-acetylcysteine therapy (NAC), which increases GSH detoxification after its depletion in the event of APAP overdose4.Methods
Adopting the toxic APAP model 5, 20 mice were scanned in a BioSpec 94/20 USR 9.4T scanner with a 4-channel receiver array coil pre and post 24 hours intravenous injection APAP (300mg/kg). Mice were grouped into controls (0.9% saline), NAC (10 mg/kg), APAP and a treated group which received NAC (10 mg/kg) an hour post APAP dosing (n=5 in each group). T2 mapping and diffusion mapping were performed using multi-echo spin echo and echo-planar diffusion weighted spin echo sequence with 4 b values. Imaging parameters for T2 mapping were: TR/TE=6000/9ms, imaging matrix=128×64, slice thickness=1mm, in-plane resolution=250×250mm2. Imaging parameters for diffusion mapping were: TR/TE=3200/22.46ms, imaging matrix=86x74, slice thickness=1mm, in-plane resolution=372×216mm2. Water/fat ratio was estimated using non-suppressed single voxel 2x2x2mm3 1H MR spectroscopy (PRESS) whilst liver volume was measured using a T2 RARE sequence. Post imaging, serum were collected for ALT, total bilirubin and HMGB1 biomarker analysis. Sections of the liver were then imbedded in PFA for further histology assessment. T2 mapping, diffusion and spectroscopy data analysis was conducted using the paravision 0.1 whilst liver segmentation was conducted on Amira 6.0.1. GraphPad Prism 5 was used for all statistical analysis.Results
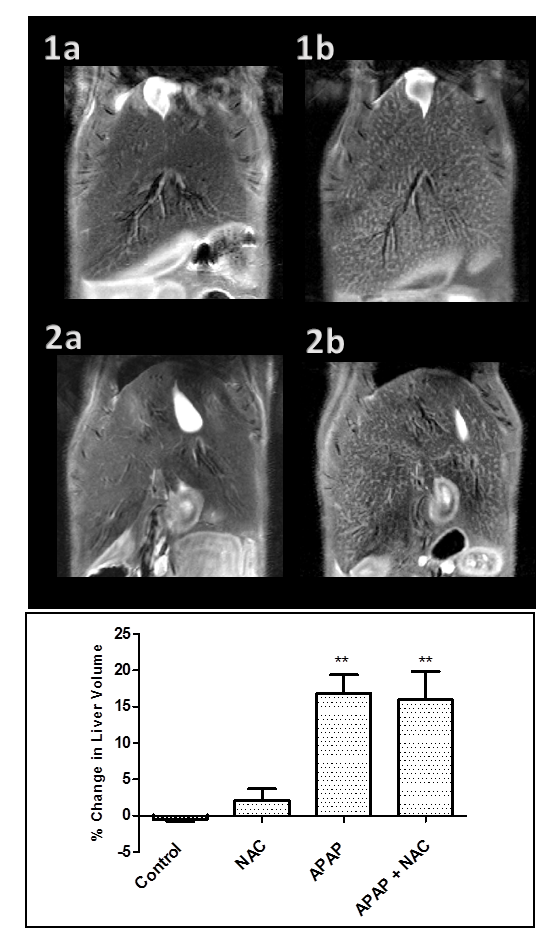
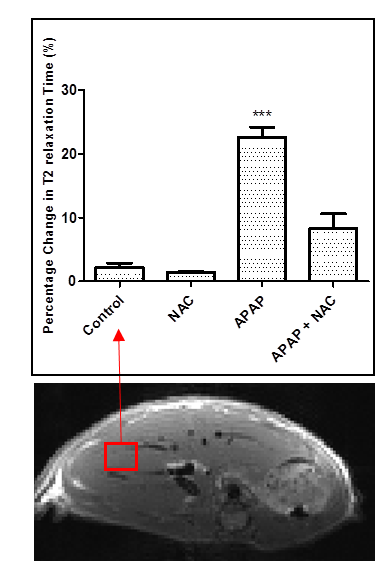
An increase of 10-23% in the liver volume was noted in the APAP group and a subsequent 8-28% increase in the APAP + NAC treated group, whilst both the control and NAC group stayed at an average of 0.8% from the initial values (figure 1). Histological analysis for necrosis scoring indicated cell death due to drug toxicity. T2 relaxation time increased by 17-27% in the APAP group which decreased to 6.16% of the baseline value after NAC treatment. An opposite pattern was observed in the ADC results whereby an average decrease of 28.25% was observed in the APAP overdose group which increased to a 4.72% when treated with NAC. Interestingly, the water/fat ratio remained high in the APAP and NAC treated group with an average of 40% and 30% respectively, suggesting cell swelling due to cytotoxic oedema, which may still be present after NAC treatment at the 24 hour time point. Strongest correlations were observed between ALT and T2 relaxation and bilirubin with liver volume (r20.69 and r20.68 respectively). HMGB1, a necrosis marker had the weakest correlation overall with the MRI biomarkers (average r20.23).Discussion
These results that MRI parameters can detect drug induced toxicity in the liver. Although T2 relaxation and ADC show a slight return to normality in the liver state after NAC treatment, liver volume and water/fat remained significantly high. This could inform us that at the 24 hour time point, only partial recovery of the liver occurred and thus longer time point studies are necessitated to confirm our findings.Conclusion
This study indicates the sensitivity and efficacy of MRI in assessing the changes in liver morphology and metabolism after APAP induced toxicity as well as potential recovery after NAC treatmentAcknowledgements
I would like to thank the Medical Research Council for the funding for my project, and the Center of Drug Safety Science at the University of Liverpool where I am undertaking my PhD. A special thank you goes out to Dr Harish Poptani and the Pre-Clinical Imaging Centre for helping me set up this project and driving me in the right direction.References
1Abboud G, & Kaplowitz N (2007). Drug-induced liver injury. Drug Safety 30: 277-294.
2 Fisher K, Vuppalanchi R, & Saxena R (2015). Drug-induced liver injury. Archives of Pathology and Laboratory Medicine 139: 876-887.
3Balaban.R.S et al 2001. Challenges in small animal non- invasive imaging. ILAR Journal 42:248-262
4 Zafarullah M, Li W, Sylvester J, & Ahmad M (2003). Molecular mechanisms of N-acetylcysteine actions. Cellular and Molecular Life Sciences CMLS 60: 6-20.
5Antoine DJ, Williams DP, Kipar A, Laverty H, & Park BK (2010). Diet Restriction Inhibits Apoptosis and HMGB1 Oxidation and Promotes Inflammatory Cell Recruitment during Acetaminophen Hepatotoxicity. Molecular Medicine 16: 479-490.
Figures