3204
Liver R2 Quantification at 3 Tesla in Patients with Iron Overload - Interim Validation Result1Radiology, University of Texas Southwestern Medical Center, Dallas, TX, United States, 2Radiology, Medical Physics, University of Wisconsin, Madison, WI, United States, 3Radiology, Medical Physics, Biomedical Engineering, Medicine, Emergency Medicine, University of Wisconsin, Madison, WI, United States, 4Radiology, Advanced Imaging Research Center, University of Texas Southwestern Medical Center, TX, United States
Synopsis
Determination of liver iron concentration (LIC) by R2-relaxometry has been extensively validated at 1.5T but feasibility of translating this technology to 3T remains uncertain. The purpose of this study was to assess the feasibility of a R2 quantification at 3T against the standard 1.5T R2 in subjects with known or suspected iron overload. In 13 subjects enrolled thus far, we found that liver R2 at 3T linearly correlated with R2 at 1.5T over observed LIC range of 0.3-32.3 mg iron/g liver. We conclude that noninvasive liver LIC determination may be feasible by R2-relaxometry at 3T.
Introduction
Determination of liver iron concentration (LIC) by magnetic resonance imaging (MRI) R2-relaxometry (R2-LIC) has been extensively validated at 1.5T. The R2-LIC method has regulatory clearance from the United States Food and Drug Administration (FDA) and is commercially available and known as the FerriScan® test (Resonance Health Ltd., Claremont WA, Australia). However, FerriScan® has only been validated for the 1.5T platform. As 3T MRI scanners have become more prevalent in clinical practices worldwide, it is important to understand the feasibility of translating this technology to the 3T platform. To this end, a preliminary animal study provided a proof of concept for R2 iron quantification at 3T [1]. While a subsequent human study suggested the feasibility of R2 iron quantification on a 3T platform, it only evaluated a limited number of subjects (n=6) [2]. The purpose of this study is to assess the feasibility of a noninvasive R2-LIC quantification at 3T against the standard 1.5T in subjects with known or suspected iron overload.Methods
Patient Population
Institutional Review Board approval was obtained and all patient data were handled in compliance with the United States Health Insurance Portability and Accountability Act. All participants signed an informed consent prior to imaging. In this prospective, single-center study, adult subjects at risk for iron overload were recruited based on referral from the hepatology and hematology clinics at our institution.
Imaging Acquisition Parameters
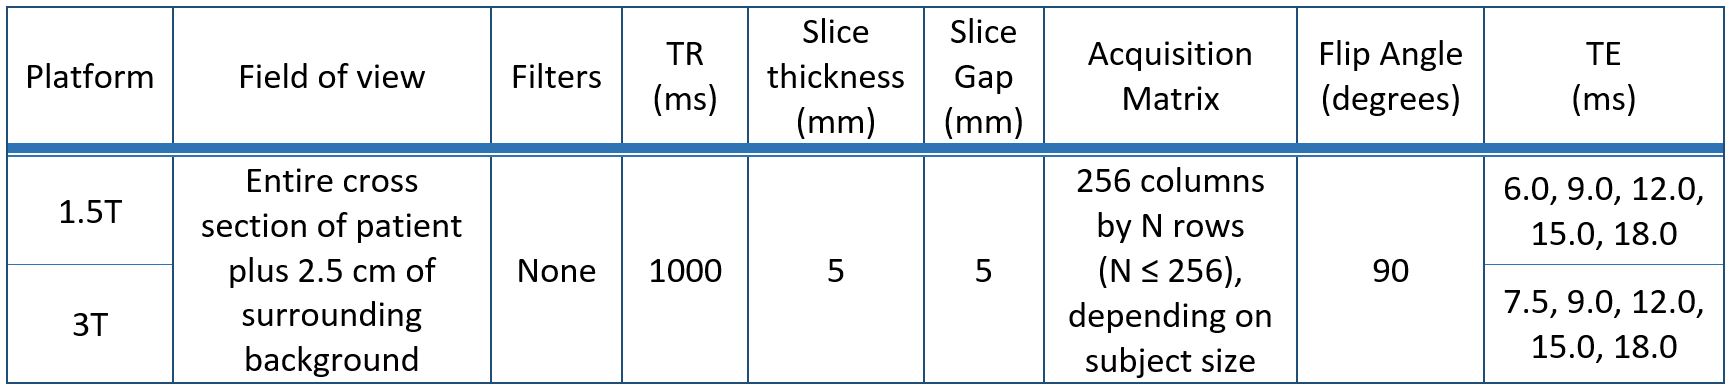
All recruited subjects underwent same-day MRI examinations on both 1.5T and 3T platforms (Philips Ingenia, Philips Healthcare, Eindhoven, The Netherlands). An axial, free-breathing, multi-slice, single spin-echo acquisition was performed through the liver without parallel imaging as per FerriScan® protocol as summarized in Table 1.
Image and Data Analysis
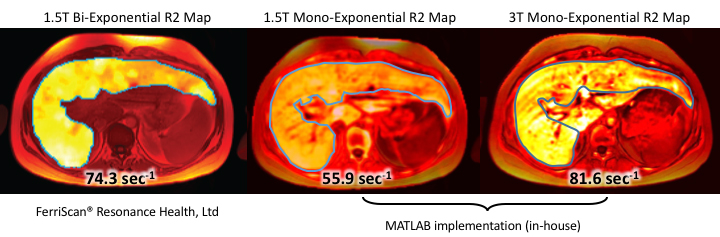
Imaging data from the 1.5T platform were transferred to Resonance Health for off-site analysis. Bi-exponential R2 fit within segmented liver [3] and estimated LIC (in mg iron/g dry weight) [4] were extracted from the FerriScan® reports. Based on the FerriScan® report, the matching axial slice from the 1.5T data and the best-matching slice from the 3T data were selected. The liver was manually segmented in a manner similar to that provided on the FerriScan® report (Blue contour, Figure 1). Both 1.5T and 3T multi-TE spin-echo data were re-analyzed on-site using MATLAB® (Mathworks, Natick, MA). An analysis of the data identical to the procedure previously described [3] was followed, except that a mono-exponential R2 model was used for curve fitting. Fitted R2 values with coefficient of determination > 0.9 were averaged across the segmented liver area. The bi-exponential R2 at 1.5T (the reference standard used in FerriScan®), and mono-exponential R2 data (at 1.5T and 3T) were compared using linear regression; 95% confidence intervals were calculated for slope and intercept estimates.
Results
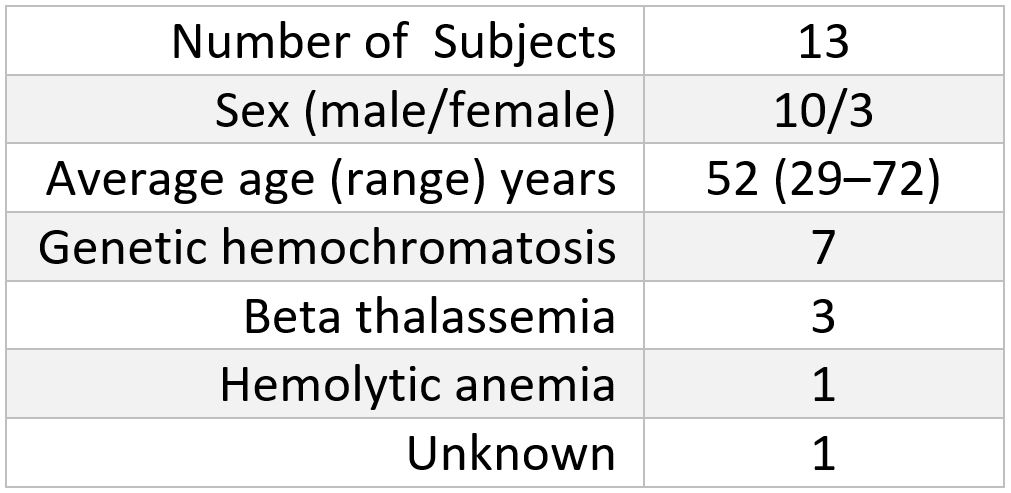
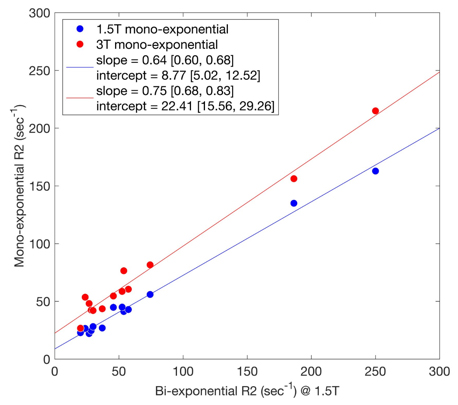
A total of 13 study subjects at risk of iron overload have been recruited thus far. The study population characteristics are summarized in Table 2. The range of bi-exponential R2 observed at 1.5T in our population was 20-250 sec-1, respectively, and corresponding to a LIC of 0.3-32.3 mg iron/g based on the FerriScan® reports. Figure 2 demonstrates excellent linearity of the mono-exponential R2 fitting at both 1.5T and 3T across the entire range of observed bi-exponential R2 at 1.5T, with coefficient of determination statistics (i.e. linear goodness of fit) of 0.991 and 0.979, respectively. The regression slopes deviated from unity by -0.37 and -0.25, and the regression intercepts deviated from 0 by 8.77 and 22.4 for the 1.5T and 3T platforms, respectively.Discussion/Conclusion
Mono-exponential R2 at both 1.5T and 3T were linearly correlated with bi-exponential R2 measured at 1.5T in the range of LIC seen in our patient population. Since the calculation of LIC based on bi-exponential R2 at 1.5T has been extensively validated in multi-center studies [5], simple linear transformations may allow LIC calculation based on mono-exponential R2 at 1.5T and 3.0T. A limitation of this study was that we did not compare bi-exponential R2 between 1.5T and 3T, because we were unable to implement computationally stable R2 estimation algorithm utilizing a bi-exponential model. However, given this promising result with mono-exponential R2 at 3T, future studies with larger sample sizes may confirm and refine the new R2-LIC calibration curve for 3T.Acknowledgements
No acknowledgement found.References
1. Peng, P., et al., Liver iron quantification by 3 tesla MRI: calibration on a rabbit model. J Magn Reson Imaging, 2013. 38(6): p. 1585-90.
2. Ghugre, N.R., et al., Relaxivity-iron calibration in hepatic iron overload: Predictions of a Monte Carlo model. Magn Reson Med, 2015. 74(3): p. 879-83.
3. Clark, P.R., W. Chua-anusorn, and T.G. St Pierre, Bi-exponential proton transverse relaxation rate (R2) image analysis using RF field intensity-weighted spin density projection: potential for R2 measurement of iron-loaded liver. Magn Reson Imaging, 2003. 21(5): p. 519-30.
4. St Pierre, T.G., et al., Noninvasive measurement and imaging of liver iron concentrations using proton magnetic resonance. Blood, 2005. 105(2): p. 855-61.
5. St Pierre, T.G., et al., Multicenter validation of spin-density projection-assisted R2-MRI for the noninvasive measurement of liver iron concentration. Magn Reson Med, 2014. 71(6): p. 2215-23.
Figures