3202
Assessment of early stage of liver fibrosis using MRI T1rho1Tianjin First Center Hospital, Tianjin, People's Republic of China, 2Tianjin First Center Hospital, People's Republic of China, 3Philips healthcare, Beijing, People's Republic of China
Synopsis
This study assessed the potential of MR T1rho for early liver fibrosis. Ten normal contrast (N), twelve patients with liver fibrosis stage F1 and seven with F2 took the MR T1rho scan. With the stage of liver fibrosis raising, T1rho value increased. And T1rho value of N vs. F1, N vs. F2 and N vs. F1-2 showed significant difference. And the AUC of N vs. F1, N vs. F2 and N vs. F1-2 were 0.858, 0.810, and 0.838. We conclude that MR T1rho has potential to diagnose the early stage of liver fibrosis.
Purpose
Liver fibrosis is an abnormal accumulation of collagen, proteoglycans, and other macromolecules in the extracellular matrix. Early and accurate diagnosis of liver fibrosis is critical because preemptive treatment of liver fibrosis can prevent or delay the development of cirrhosis and liver cancer1-2. Studies estimating liver fibrosis and cirrhosis using magnetic resonance imaging (MRI) T1rho in animal model and in human have been reported3-5. The purpose of this study was to assess the early stage of liver fibrosis using MRI T1rho.Materials and Methods
Twelve healthy control subjects (mean age=36.0±9.3 years; F/M=4/8) , ten patients with liver fibrosis stage F1 according to histopathologic examination (mean age=35.6±9.6 years; F/M=3/7) and ten patients with liver fibrosis stage F2 or F3 according to histopathologic examination (mean age=33.6±5.9 years; F/M=2/5) were recruited in this study and scanned with a 3.0T MR scanner (Ingenia, Philips, Healthcare, Best, the Netherlands) using a multi-transmit RF system and a 32 channel phased-array receiver coil. For T1rho measurement, a rotary echo spin-lock pulse was implemented in a 3D balanced turbo field echo (b-TFE) sequence (TR/TE=3.8/1.82 ms, FOV=300×360 mm, resolution=2.5×2.81×6.00 mm, slice thickness=6 mm, slice number=8, NSA=2, B1max=11.5μT, TFE factor=64 ). The spin lock frequency was set to 500Hz and the TSLs (time of spin lock) were 1, 10, 20, 30, 40 and 50 ms. The T1rho map was generated on a pixel-by-pixel basis on Philips Research Integrated Development Environment (PRIDE) software written in Interactive Data Language using a mono-exponential decay model: M(TSL)=M0*exp(-TSL/T1rho). The student’s t test was used to compare the T1rho value of normal controls and different patient groups according to the fibrosis stage. Receiver operating characteristic (ROC) curves and the area under the ROC curve (AUC) were used to evaluate the usefulness of T1tho value for diagnosing early stage of liver fibrosis. A P-value <0.05 was considered statistically significant.Result
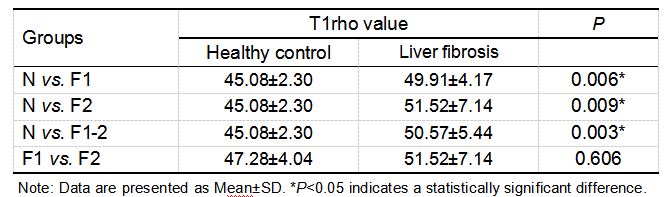
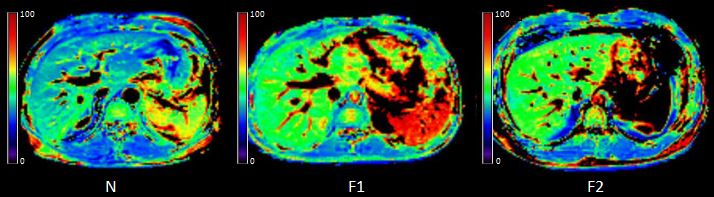
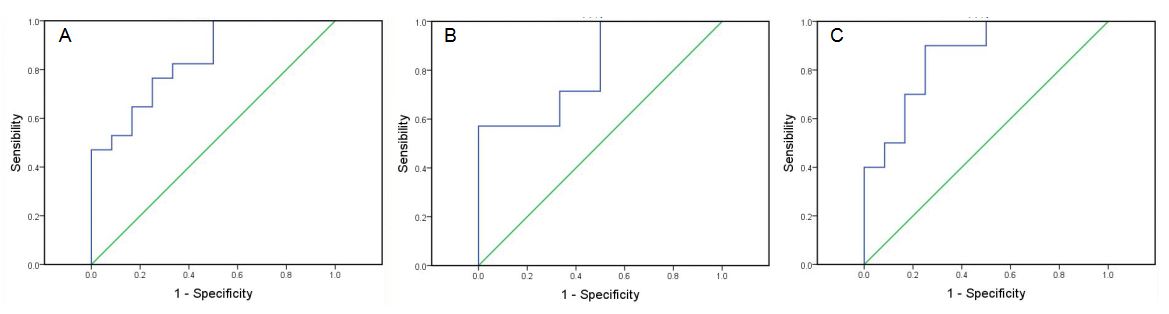
The statistical results of T1rho value between different groups are summarized in Table 1. Typical MR T1rho maps are demonstrated in Figure 1. ROC curves for differentiating fibrosis stages with T1rho value are shown in Figure 2. With the level of liver fibrosis stage raising, T1rho value increased. And T1rho values of N vs. F1, N vs. F2 and N vs. F1-2 were significantly different. But T1rho values of F1 vs. F2 showed no significant difference. The AUC of N vs. F1, N vs. F2 and N vs. F1-2 were 0.858, 0.810, and 0.838.Discussion
In this study, the increase of T1rho value was observed according to the results of N vs. F1, N vs. F2 and N vs. F1-2, which may have close relationship with the excessive deposition of collagen and proteoglycans in the extracellular matrix. And there are significant differences between the above groups, which indicated that MR T1rho has a potential ability to differentiate the early stage of liver fibrosis from healthy subjects. However, T1rho value of F1 vs. F2 had no significant difference. Thus, the clinical value of MR T1rho in differentiating early and late stage of fibrosis and liver cirrhosis still need further exploration.Conclusion
MR T1rho is an effective and reliable technique to evaluate the early stage of liver fibrosis.Acknowledgements
No acknowledgement found.References
1. Marcellin P, Gane E, Buti M, et al. Regression of cirrhosis during treatment with tenofovir disoproxil fumarate for chronic hepatitis B: a 5-year open-label follow-up study. Lancet 2013;381:468-475.
2. Chang TT, Liaw YF, Wu SS, et al. Long-term entecavir therapy results in the reversal of fibrosis/cirrhosis and continued histological improvement in patients with chronic hepatitis B. Hepatology. 2010; 52(3): 886-893.
3. Zhao F, Wang YX, Yuan J, et al. MR T1rho as an imaging biomarker for monitoring liver injury progression and regression: an experimental study in rats with carbon tetrachloride intoxication. Eur Radiol. 2012; 22(8): 1709-1716.
4. Rauscher I, Eiber M, Ganter C, et al. Evaluation of T1rho as a potential MR biomarker for liver cirrhosis: comparison of healthy control subjects and patients with liver cirrhosis. Eur J Radiol. 2014; 83(6): 900-904.
5. Singh A, Reddy D, Haris M, et al. T1rho MRI of healthy and fibrotic human livers at 1.5 T. J Transl Med. 2015;13:292.
Figures