3199
Water-fat separated T1 mapping in the liver and correlation to hepatic fat fraction1Institute of Radiology, University Hospital Regensburg, Regensburg, Germany, 2MR Application Predevelopment, Siemens Healthcare, Erlangen, Germany
Synopsis
Fat signal fraction (FF) and R2* mapping as well as MRS of the liver were performed in 201 patients. Results for FF from imaging and MRS were compared to a newly defined parameter T1_FF. T1_FF was calculated from a variable flip angle 3D GRE technique with 2 echo times. Based on the Dixon method, T1 maps from in-phase and from water signal were calculated and T1_FF was deduced. T1_FF correlated well with FF and might be used as a novel estimation of fat fraction. Relevant discrepancies were seen in cases with high R2*.
Purpose
Hepatic fat fraction and iron content are important parameters to characterize liver tissue, and both can be assessed by modern MR techniques 1-3. Increasing evidence has emerged to suggest that T1 mapping can be applied as a non-invasive method to determine fibrosis grade or liver funtion 4-7. One method in use for T1 mapping is the variable flip angle technique based on a 3D gradient echo sequence with 2 or 3 flip angles. Combining this technique with a 2-point Dixon method, calculation of T1 maps from in phase and from water signal is possible. The aim of this study was to evaluate this method for liver fat quantification.Methods
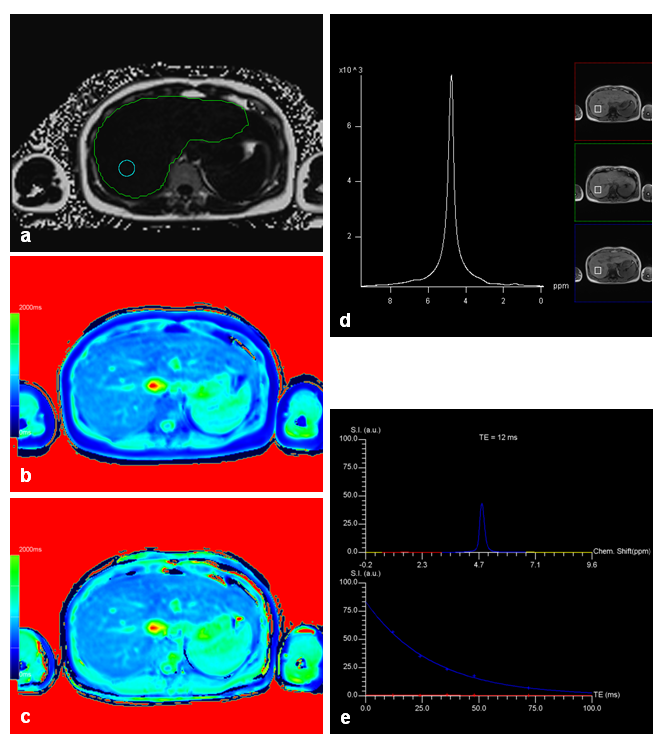
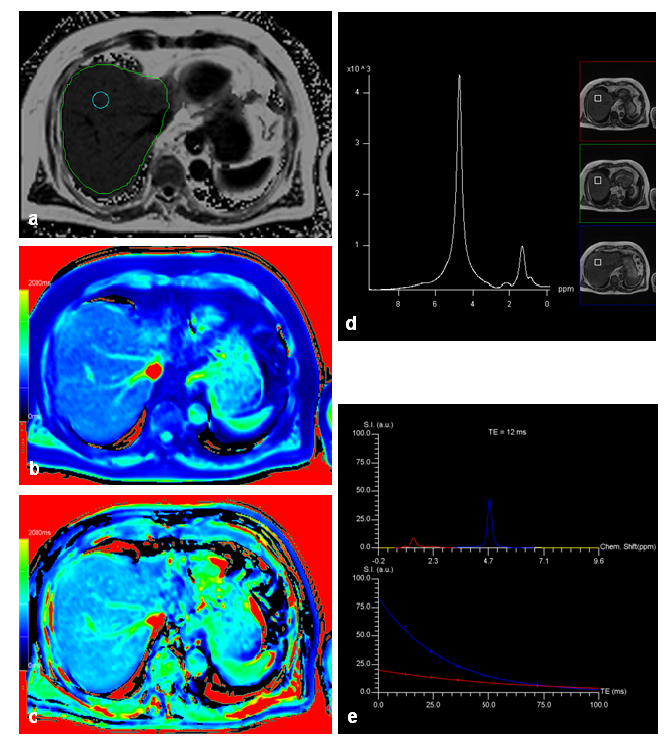
218 patients underwent MRI to assess suspected liver lesions or for follow-up examination in case of known liver disease at 3T (MAGNETOM Skyra, Siemens Healthcare, Erlangen, Germany). In addition to routine MRI protocol, T1 mapping, mapping of fat and R2*, as well as MRS, were applied to all patients: T1 mapping of the whole liver was performed with a variable flip angle prototype 3D gradient echo sequence (VIBE) (TR 5.79ms; TE 2.46, 3.69ms; α 1°, 7°, 14°; acceleration (PAT) factor 4, measured voxel size 3.6mmx2.5mmx4.8mm interpolated to 1.3mmx1.3mmx3.0mm; acquisition time (TA) 17s), combined with a preceding B1-map for an inline correction of B1 inhomogeneities. Based on a 2-point Dixon method, T1 maps from in-phase (T1_in) and from water (T1_W) signal were calculated inline. Mapping of fat signal fraction (FF) and R2* was done with a 6-echo prototype 3D VIBE sequence (TR 9.2ms; TE 1.23-7.38ms; α 4°, PAT 4; measured voxel size 2.9mmx2.6mmx6.4mm interpolated to 2.6mmx2.6mmx4.0mm; TA 15s). MRS for fat quantification (MRS_FF) was performed with an SVS STEAM sequence using 5 echos (TR 3000ms; TE 12-72ms; voxel size (30mm)3; TA 15s). FF and R2* from multi-echo VIBE were evaluated automatically in a user-defined ROI; the position of the ROI was transferred automatically to the voxel position for MRS. A corresponding ROI was drawn manually in both T1 maps from variable-flip-angle VIBE and mean T1 values were used to calculate a novel parameter T1_FF with
T1_FF = 100 (T1_W - T1_in) / T1_W.
This parameters determines the variation of T1_in relative to T1_W and is motivated by the low and constant T1 of fat. Pearson correlation coefficient R was calculated for fat signal fraction based on different methods; furthermore, a multivariate analysis was performed for T1_FF and R2* on MRS_FF.
Results
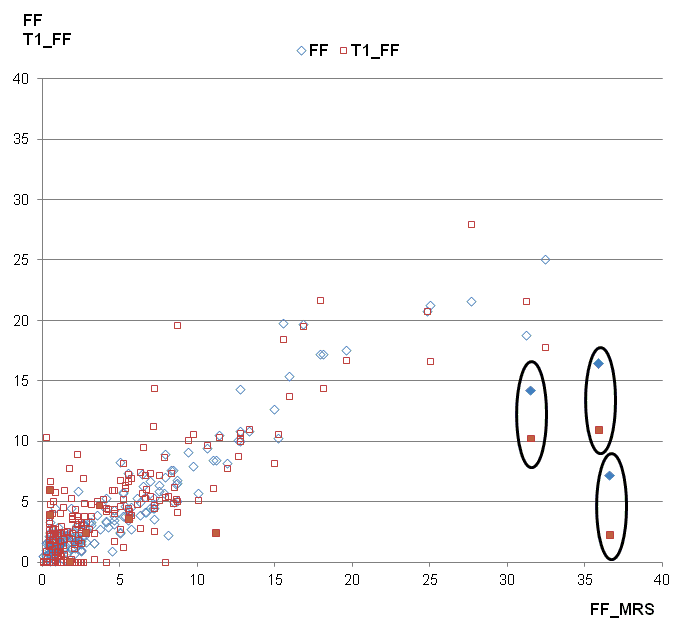
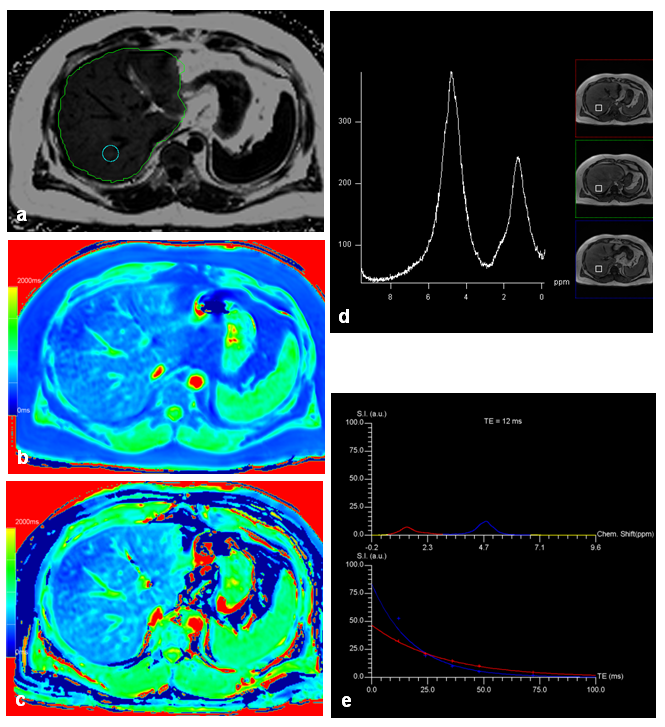
17 patients had to be excluded for further evaluation due to global fat-water swaps in fat and/or T1 mapping. For the remaining 201 patients (145 men, 56 women, mean age: 58 years) there were highly significant correlations between MRS_FF and FF (R=0.89), between MRS_FF and T1_FF (R=0.74), and between FF and T1_FF (R=0.83). Patients with very low FF could be identified visually by quite similar T1 values in T1_in and T1_W maps (Fig. 1) whereas higher T1 values were seen in T1_W in patients with increased FF (Fig. 2). Remarkable discrepancies between MRS_FF and T1_FF were found in 3 patients (Figs. 3, 4) which also showed very high R2* (>300 1/s). Multivariate analysis for T1_FF and R2* on MRS_FF resulted in R=0.88.Discussion
Considering fat and iron we were able to show a high correlation between FF and MRS_FF as it has been published by others before 1-3. T1 mapping based on a 2-point Dixon technique with in phase and water information for T1 can be used to calculate a parameter “T1_FF” which correlates quite well with FF and MRS_FF. Relevant deviations were seen for 3 patients with large iron content in the liver (R2*>300 1/s); this result can be explained by the fact that R2* has not been incorporated into the calculation of T1 maps so far. This context was confirmed by multivariate analysis including T1_FF, R2*, and MRS_FF. Furthermore, FF was clearly lower in those 3 patients than MRS_FF: as it can be seen from the spectrum, signal was quite low and, therefore, fitting and calculation of fat fraction might be impaired. Another aspect of calculating T1_in and T1_W might yield further insights into characterization of liver tissue with interpretation of the liver as a 2-compartment system of fat and water.Conclusion
A variable flip angle technique for T1 mapping with 2-point Dixon technique might serve as an estimation of hepatic fat fraction. The results for T1_FF correlated well with both FF and MRS_FF, relevant deviations occurred in cases of increased liver iron content. Furthermore, T1_in and T1_W might become another interesting parameter in multiparametric characterization of the liver.Acknowledgements
noneReferences
1. Kramer H, Pickhardt PJ, Kliewer MA et al. Accuracy of liver fat quantification with advanced CT, MRI, and ultrasound techniques: Prospective comparison with MR Spectroscopy. AJR 2017; 208:1–9 2. Kukuk GM, Hittatiya K, Sprinkart AM et al. Comparison between modified Dixon MRI techniques, MR spectroscopic relaxometry, and different histologic quantification methods in the assessment of hepatic steatosis. Eur Radiol 2015; 25: 2869-2879. 3. Horng DE, Hernando D, Reeder SB. Quantification of liver fat in the presence of iron overload. J Magn Reson Imaging 2016 (epub ahead of print). 4. Haimerl M, Schlabeck M, Verloh N et al. Volume-assisted estimation of liver function based on Gd-EOB-DTPA-enhanced MR relaxometry. Eur Radiol 2016; 26:1125-1133. 5. Yoon JH, Lee JM; Kim E et al. Quantitative liver function analysis: Volumetric T1 mapping with fast multisection B1 inhomogeneity correction in hepatocyte-specific contrast-enhanced liver MR imaging. Radiology 2016 [epub ahead of print]. 6. Verloh N, Utpatel K, Haimerl M et al. Liver fibrosis and Gd-EOB-DTPA-enhanced MRI: A histopathologic correlation. Sci Rep. 2015 Oct 19;5. 7. Hoad CL, Palaniyappan N, Kaye P et al. A study of T1 relaxation time as a measure of liver fibrosis and the influence of confounding histological factors. NMR Biomed. 2015; 28(6):706-714.Figures