3198
Estimation of Lobar Liver Function using Gadoxetic Acid-Enhanced MR Imaging: Comparison with 99mTc-GSA SPECT Imaging1Radiology, Kobe University Graduate School of Medicine, Kobe, Japan, 2Center for Endovascular Therapy, Kobe University Hospital, 3Radiology, Kinki University Faculty of Medicine, 4Nuclear Medicine and PET Center, Hyogo College of Medicine
Synopsis
Hepatobiliary phase image on gadoxetic acid-enhanced magnetic resonance (MR) imaging has been described as a way to quantify liver function and potential to estimate regional liver function. The purpose of this study was to investigate whether gadoxetic acid-enhanced MR imaging can estimate lobar liver function by comparing with 99mTc-GSA SPECT imaging.
The results of this study showed that hepatic lobar function significantly differs according to the presence of biliary obstruction. Combined volumetric and functional assessment calculated by hepatobiliary phase images on gadoxetic acid-enhanced MR images can estimate lobar liver function.
PURPOSE:
Postoperative liver failure is usually estimated by volumetric assessment or serum liver function tests, but their reliabilities are assured only when liver function is assumed to be homogeneous throughout the whole liver1. Liver single photon emission computed tomography (SPECT) with technetium-99m (99mTc) galactosyl human serum albumin (GSA) has shown to be able to evaluate regional liver function2,3. Hepatobiliary phase image on gadoxetic acid-enhanced magnetic resonance (MR) imaging has been described as a way to quantify liver function and potential to estimate regional liver function4,5. The purpose of this study was to investigate whether gadoxetic acid-enhanced MR imaging can estimate lobar liver function by comparing with 99mTc-GSA SPECT imaging.METHODS:
Eighty-seven patients (59 men and 28 women, mean age 67.5 ± 9.8 years) who underwent both gadoxetic acid-enhanced MRI and 99mTc-GSA SPECT imaging for the preoperative assessment of hepatectomy were analysed. The population included 41 patients with cholangiocarcinoma, 43 patients with colorectal liver metastases, and three patients with gallbladder carcinoma. Patients were classified into three groups according to the extent of biliary obstruction: right lobe obstruction group (n=16), no obstruction group (n=49), and left lobe obstruction group (n=22). Hepatobiliary phase MR images using T1-weighted three-dimensional spoiled gradient-echo sequence were obtained 20 minutes after intravenous injection of gadoxetic acid at a dose of 0.025 mmol/kg of body weight. 99mTc-GSA SPECT imaging was acquired 15 minutes after intravenous injection of 3 mg (185 MBq) of 99mTc-GSA.
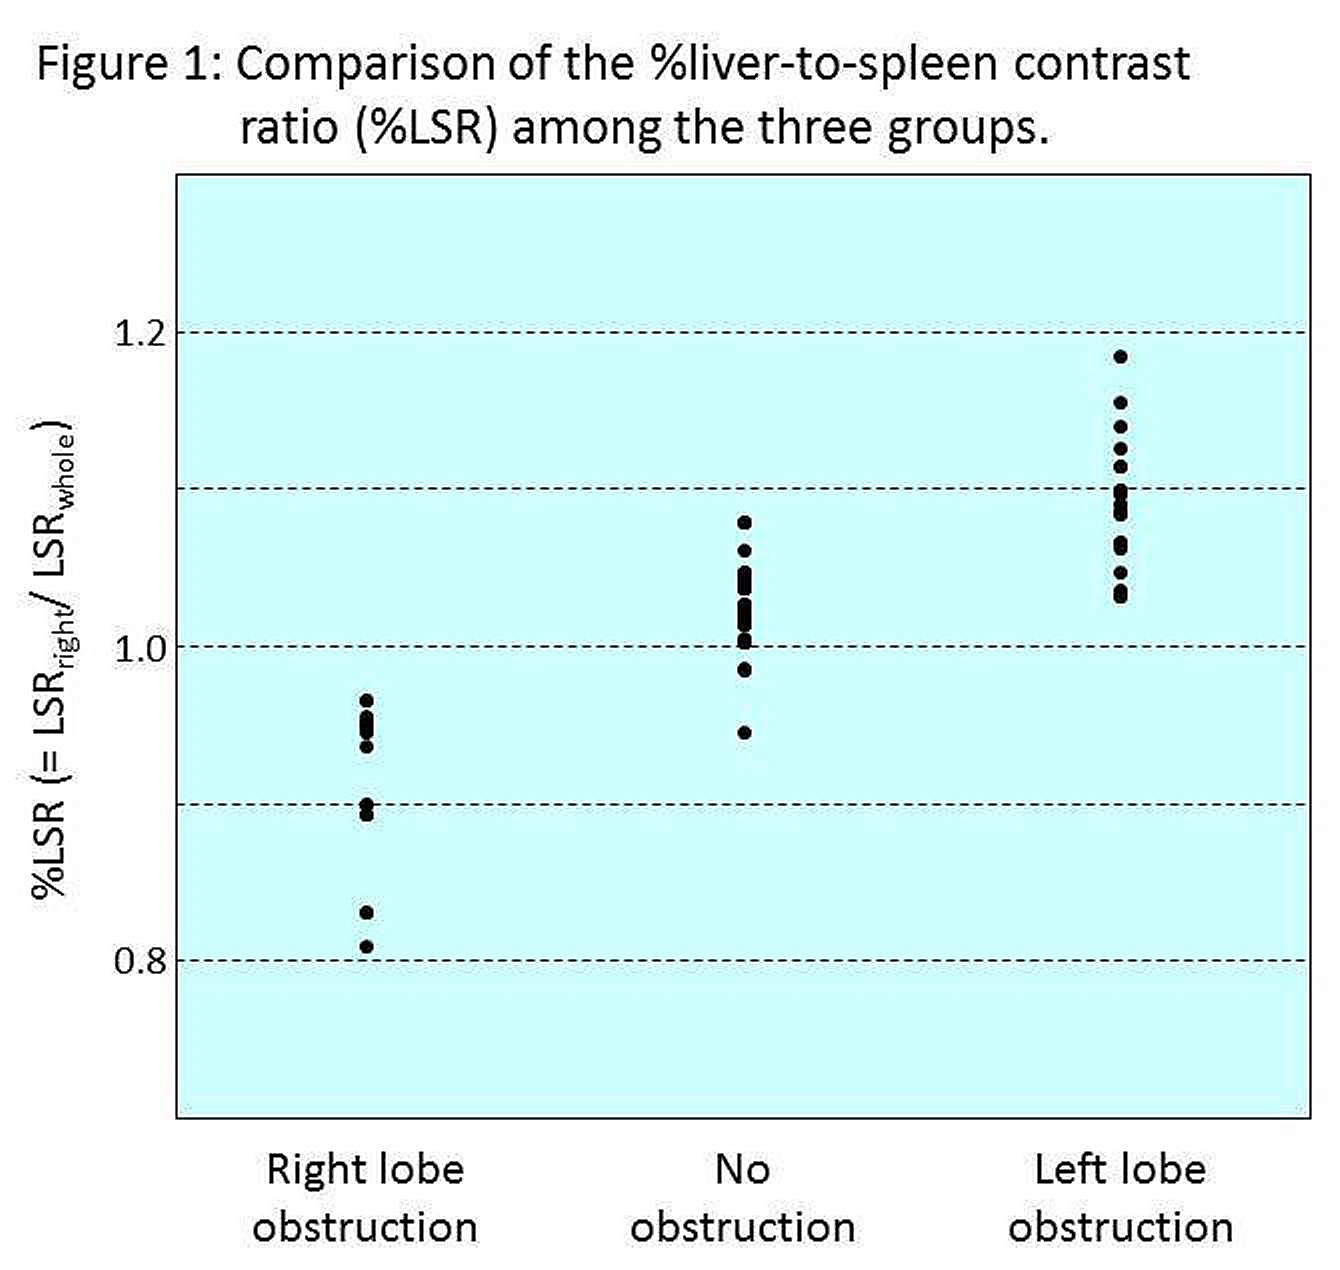
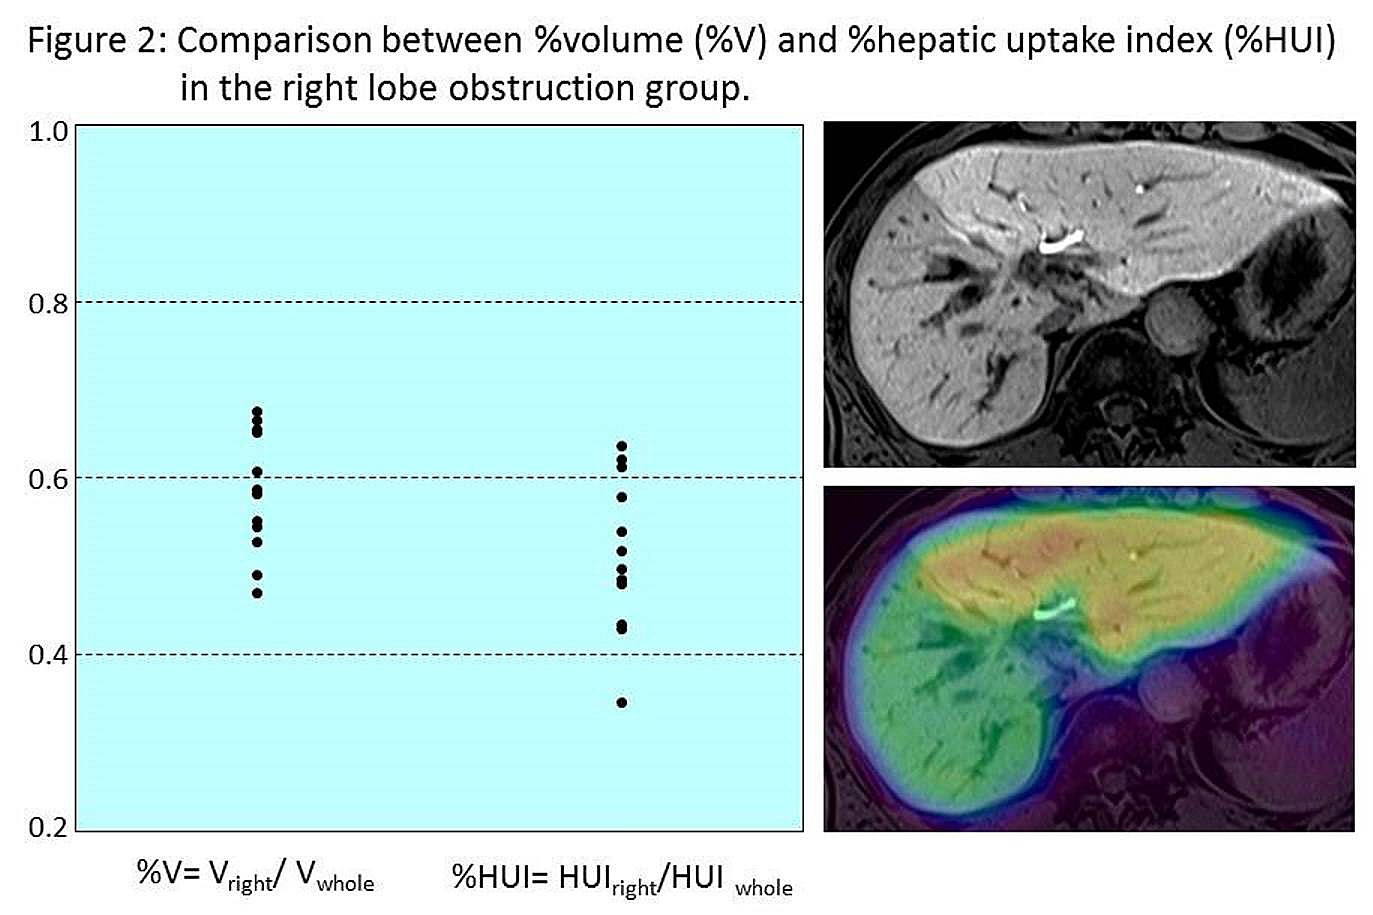
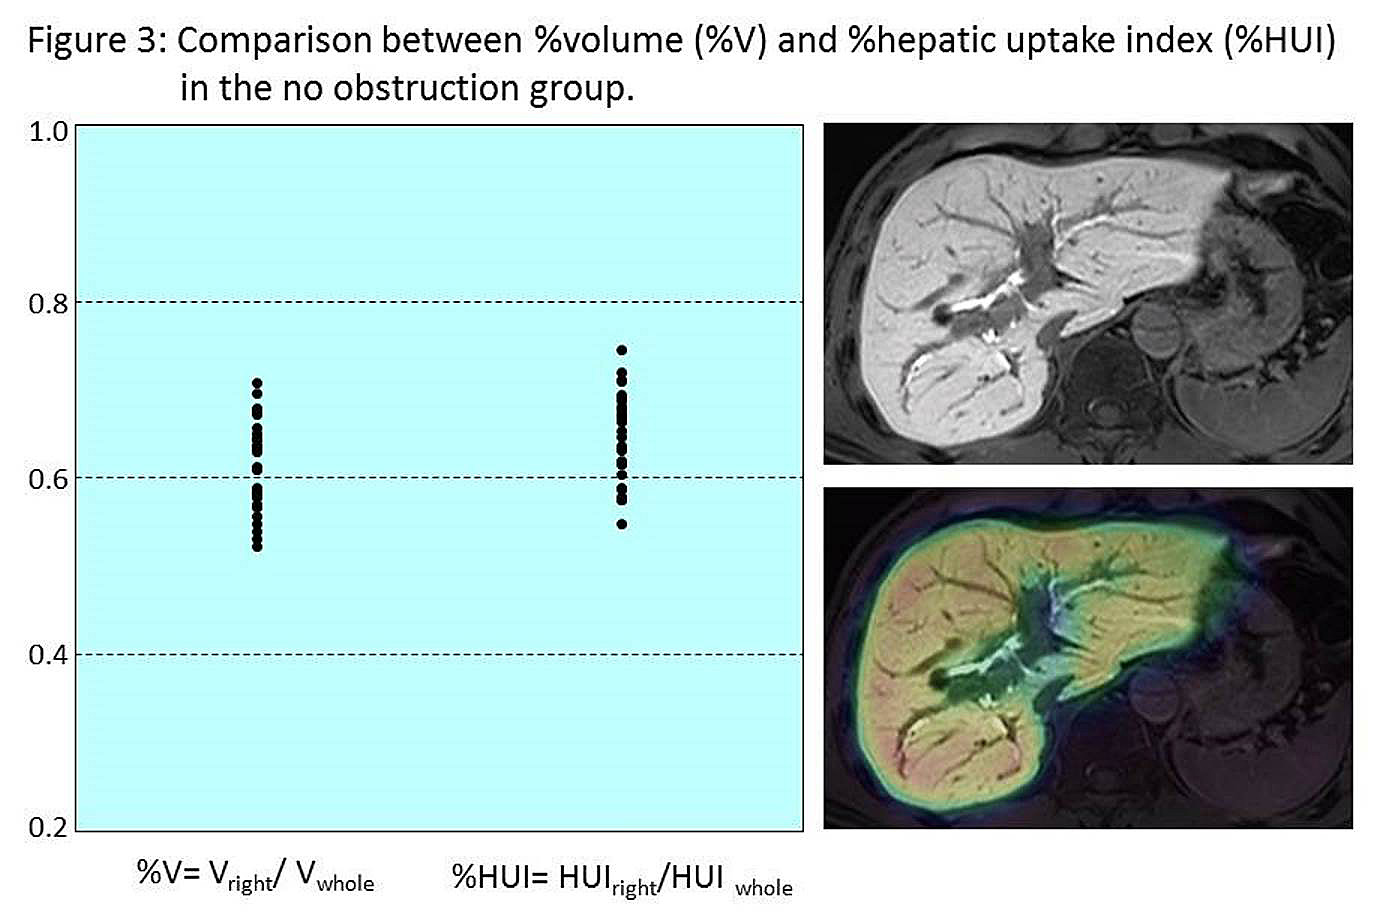
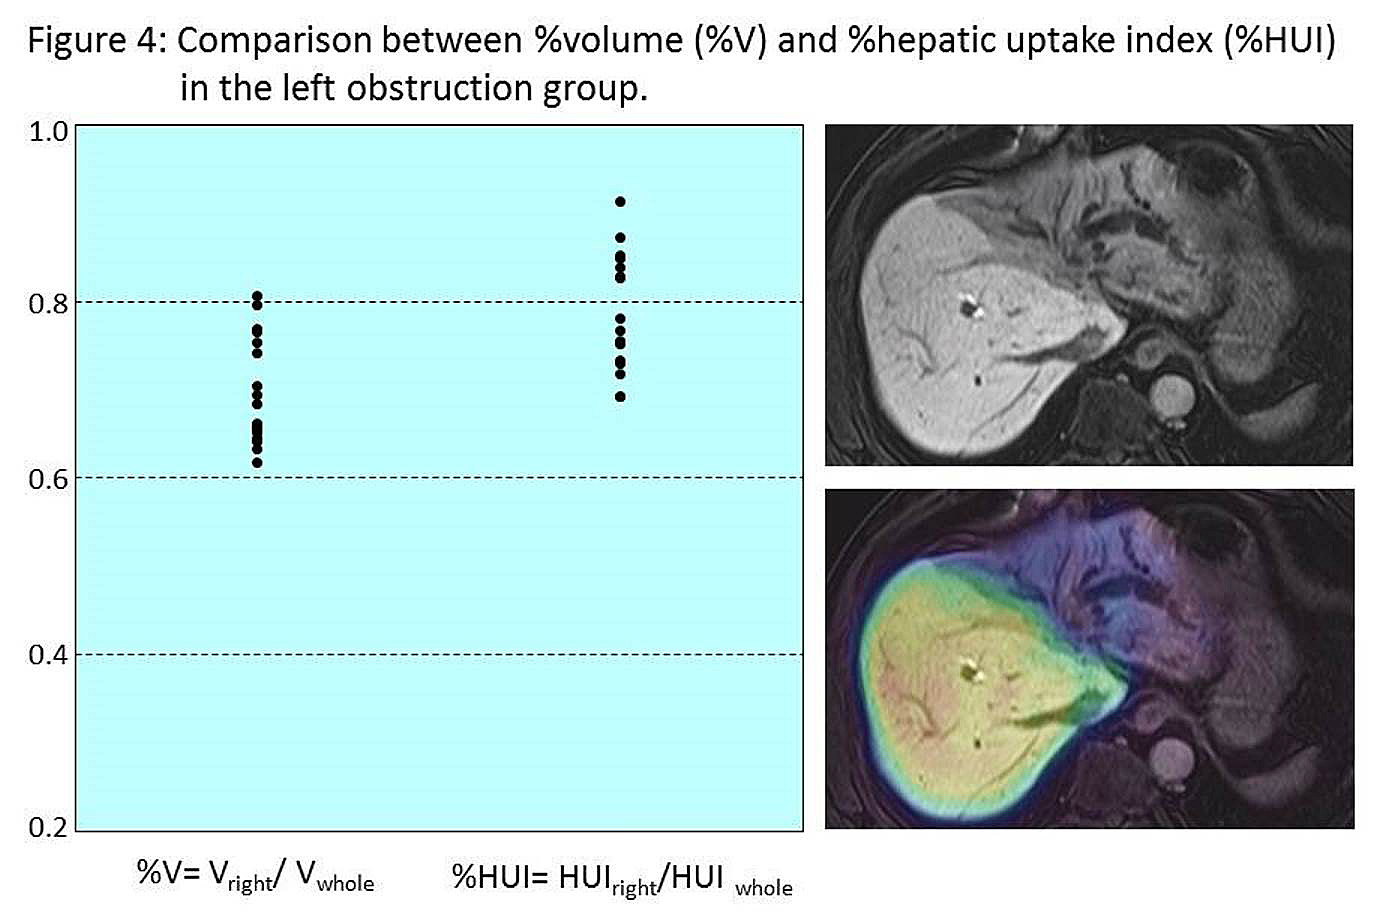
Signal intensities (SIs) of the liver in each eight Couinaud segment and the spleen were measured on hepatobiliary phase images. Mean SI of the liver was calculated over the whole liver, left lobe, and right lobe. In order to estimate the hepatocyte uptake of gadoxetic acid, liver-to-spleen contrast ratio (LSR) was calculated using following formula: LSR= SI of the liver/ SI of the spleen. Liver volumes (V) of the whole liver, left lobe, and right lobe, were also measured. Then, we calculated hepatic uptake index (HUI), which has been shown to be an index for the amount of gadoxetic acid uptake into the hepatocytes, by multiplying LSR and V as follows: HUI= V× (LSR‒ 1)6. Based on hepatobiliary phase images, six values were recorded for the whole liver and right lobe with LSR (LSRwhole and LSRright), for the whole liver and right lobe, each with liver volume (Vwhole and Vright), and HUI (HUIwhole and HUIright). The scintillation counts (SC) of 99mTc-GSA were generated and recorded in the whole liver and right lobe (SCwhole and SCright), on which the extent of each lobe was manually delineated in the fusion images with 99mTc-GSA SPECT and hepatobiliary phase images to correctly demarcate the boundary between the right and left liver lobes. Finally, differential liver Vs, HUIs, and SCs were calculated per right lobe for each patient following formula: %LSR= LSRright/ LSRwhole; %V= Vright/ Vwhole; %HUI= HUIright/ HUIwhole; %SC= SCright/ SCwhole.
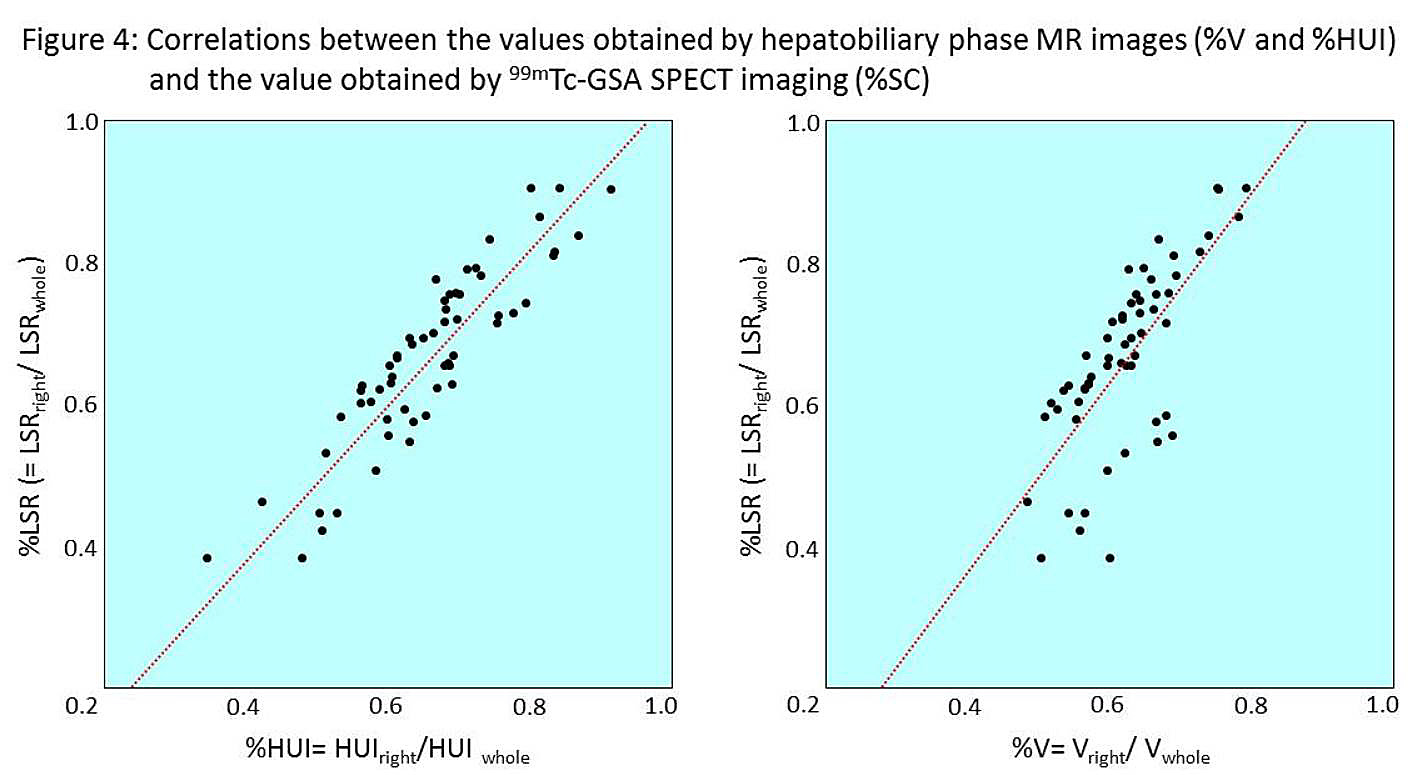
The %LSR in each lobe was compared with the Kruskal-Wallis test among the three groups. Then, %V and %HUI in each group were compared by using the Wilcoxon signed rank test. Finally, the correlations between the values obtained from MR imaging (%V and %HUI) and the value obtained by 99mTc-GSA SPECT imaging (%SC) in all patients were assessed by using Pearson correlation coefficient and compared using Fisher’s z transformation.
RESULTS:
The mean %LSRs showed significant differences (P<0.001) in the right obstruction group (mean, 0.89 ± 0.05), no obstruction group (mean, 1.03 ± 0.02), and left lobe obstruction group (mean, 1.09 ± 0.04) (Fig.1). In the right obstruction group, %HUI (mean, 0.44 ± 0.09) was significantly lower than the mean %V (mean, 0.54 ± 0.07) (P<0.0001) (Fig.2). In the no obstruction group, %HUI (mean, 0.64 ± 0.05) was significantly higher than the mean %V (mean, 0.61 ± 0.05) (P=0.012) (Fig.3). In the left lobe obstruction group, the mean %HUI (mean, 0.79 ± 0.07) was significantly higher than the mean %V (mean, 0.70 ± 0.06) (P<0.0001) (Fig.4). The %SC and %HUI showed excellent correlation (ρ=0.87, P<0.0001) and significantly well correlated (P=0.014) compared with the correlation between the %SC and %V (ρ=0.74, P<0.0001) (Fig.5).DISCUSSION:
Hepatocyte uptake of gadoxetic acid in hepatobiliary phase MR images differed remarkably according to the extent of the biliary obstruction. Additionally, combined volumetric and functional assessment using hepatobiliary phase MR images (HUI) significantly differed with volumetric assessment and showed excellent correlation with 99mTc-GSA SPECT imaging.CONCLUSION:
Hepatic lobar function significantly differs according to the presence of biliary obstruction. Combined volumetric and functional assessment calculated by hepatobiliary phase images on gadoxetic acid-enhanced MR images can estimate lobar liver function.Acknowledgements
No acknowledgement found.References
1. Schindl MJ, Redhead DN, Fearon KC, et al. The value of residual liver volume as a predictor of hepatic dysfunction and infection after major liver resection. Gut. 2005;54(2):289-296.
2. Sumiyoshi T, Shima Y, Okabayashi T, et al. Functional discrepancy between two liver lobes after hemilobe biliary drainage in patients with jaundice and bile duct cancer: an appraisal using (99m)Tc-GSA SPECT/CT fusion imaging. Radiology. 2014;273(2):444-451.
3. Saito K, Ledsam J, Sourbron S, et al. Measuring hepatic functional reserve using low temporal resolution Gd-EOB-DTPA dynamic contrast-enhanced MRI: a preliminary study comparing galactosyl human serum albumin scintigraphy with indocyanine green retention. Eur Radiol. 2014;24(1):112-119.
4. Nilsson H, Blomqvist L, Douglas L, et al. Dynamic gadoxetate-enhanced MRI for the assessment of total and segmental liver function and volume in primary sclerosing cholangitis. J Magn Reson Imaging. 2014;39(4):879-886.
5. Kamimura K, Fukukura Y, Yoneyama T, et al. Quantitative evaluation of liver function with T1 relaxation time index on Gd-EOB-DTPA-enhanced MRI: comparison with signal intensity-based indices. J Magn Reson Imaging. 2014;40(4):884-889.
6. Yamada A, Hara T, Li F, et al. Quantitative evaluation of liver function with use of gadoxetate disodium-enhanced MR imaging. Radiology. 2011;260(3):727-733.
Figures