3197
Quantitative Estimation of Liver Function using Gadoxetic Acid-Enhanced MR Imaging: in Vitro and in Vivo Comparison between R1 and R2* Relaxometry1Radiology, Kobe University Graduate School of Medicine, Kobe, Japan, 2Center for Endovascular Therapy, Kobe University Hospital, Kobe, Japan, 3Radiology, Kinki University Faculty of Medicine, 4Division of Radiology, Kobe University Hospital, Kobe, Japan, 5Philips Electronics Japan, 6Philips Healthcare, 7Radiology, Duke University Medical Center, Durham, NC, United States, 8Center for Advanced Magnetic Resonance Development, Duke University Medical Center
Synopsis
R2* relaxometry that is simultaneously obtained on proton density fat fraction map in gadxetic acid-enhanced MRI can quantitatively estimate liver function. PDFF sequence can potentially quantify steatosis, iron overload, and liver function simultaneously.
Purpose
The assessment of liver function is essential for estimation of postoperative liver failure and prediction of prognosis in patients who undergo hepatic resection or patients with chronic liver disease. The Model for End-stage Liver Disease (MELD) score and indocyanine green (ICG) clearance tests are the primary tools for the assessment of liver function. Gadoxetic acid is a hepatocyte-specific magnetic resonance (MR) contrast agent that causes lengthening of R1 and R2* relaxation rates in the liver. Hepatobiliary phase imaging on gadoxetic acid-enhanced MRI has been described as a way to quantify liver function, and investigators have shown the utility of T1 mapping for the quantitative estimation of liver function1, 2. Proton density fat fraction (PDFF) mapping is a broadly available chemical-shift based MR technique for the quantification of liver fat content, and simultaneously provides PDFF-corrected R2* maps3, 4. We hypothesize that these R2* maps can be an alternative method to quantitatively estimate liver function5,6.
The purpose of this study was to evaluate whether R2* relaxometry obtained from PDFF mapping in gadoxetic acid-enhanced MRI correlates with R1 relaxometry and can provide an estimate of liver function.
Materials and Methods
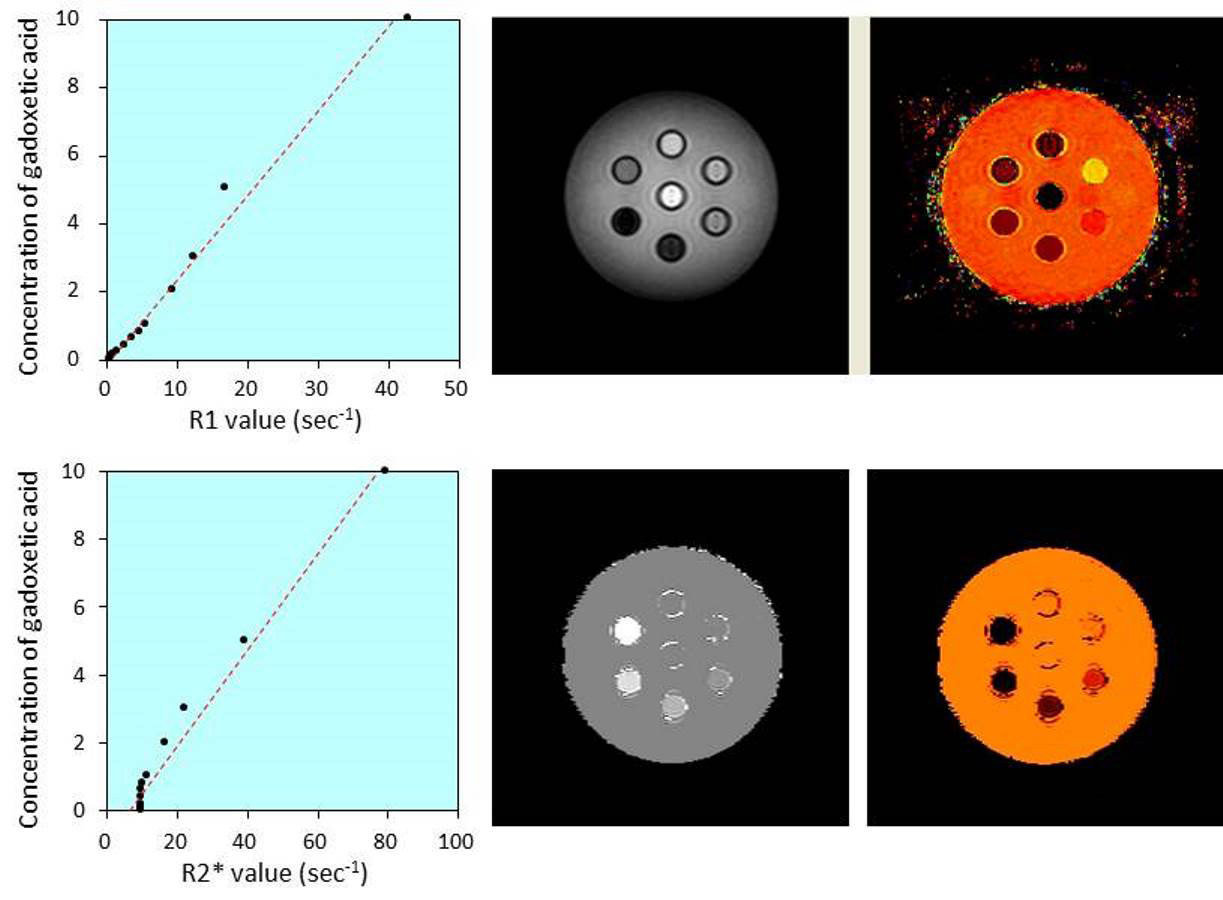
Twelve plastic syringe phantoms were filled with mixtures of saline and a range of 0-10 mmol gadoxetic acid. The phantoms were imaged with a 3.0T MR system (Ingenia 3.0T, Philips Healthcare, Best, Netherlands), obtaining an R1 map (Look-Locker sequence: single slice multiphase imaging using GRE sequence with inversion recovery pulse) and R2* map (mDixon quant sequence: six-echo 3D GRE sequence with uniform echo spacing of 0.8 msec [first TE=0.97 msec]). The R2* map was obtained along with a PDFF map. R1 and R2* values were measured in each phantom, and R1 and R2* values were correlated with gadoxetic acid concentrations using Spearman’s rank correlation.
In addition, 32 patients (22 men and 10 women; mean age, 67.8 ± 8.4 years) underwent gadoxetic acid-enhanced MRI including a single-slice R1 map in the liver and multi-slice R2* map with whole liver coverage using a PDFF reconstruction. The population included 10 patients with normal liver function evaluated for focal liver lesions and 22 patients with chronic liver disease secondary to hepatitis C virus infection (n=7); non-alcoholic steatohepatitis (n=5); hepatitis B virus infection (n=4); alcoholic hepatitis (n=4); cryptogenic liver disease (n=2). Both R1 and R2* maps were obtained prior to and 20 minutes after intravenous administration of gadoxetic acid at a dose of 0.025 mmol/kg of body weight. R1 and R2* values were measured by placing regions of interest (ROIs) in the anterior or posterior right hepatic lobe that were colocalized on precontrast and postcontrast images, avoiding focal lesions, areas of focal changes in parenchymal signal intensity, large vessels, and prominent artifacts. Changes in R1 and R2* values between precontrast and postcontrast images was calculated as follows: ΔR1= postcontrast R1 - precontrast R1; ΔR2*= postcontrast R2* - precontrast R2*. Precontrast R1 and R2* values were compared with postcontrast R1 and R2* by using Wilcoxon signed-rank test. The relations between MELD scores and ICG retention rates at 15 minutes (ICG-R15) and ΔR1 and ΔR2* were assessed by using Spearman’s rank correlation.
Results
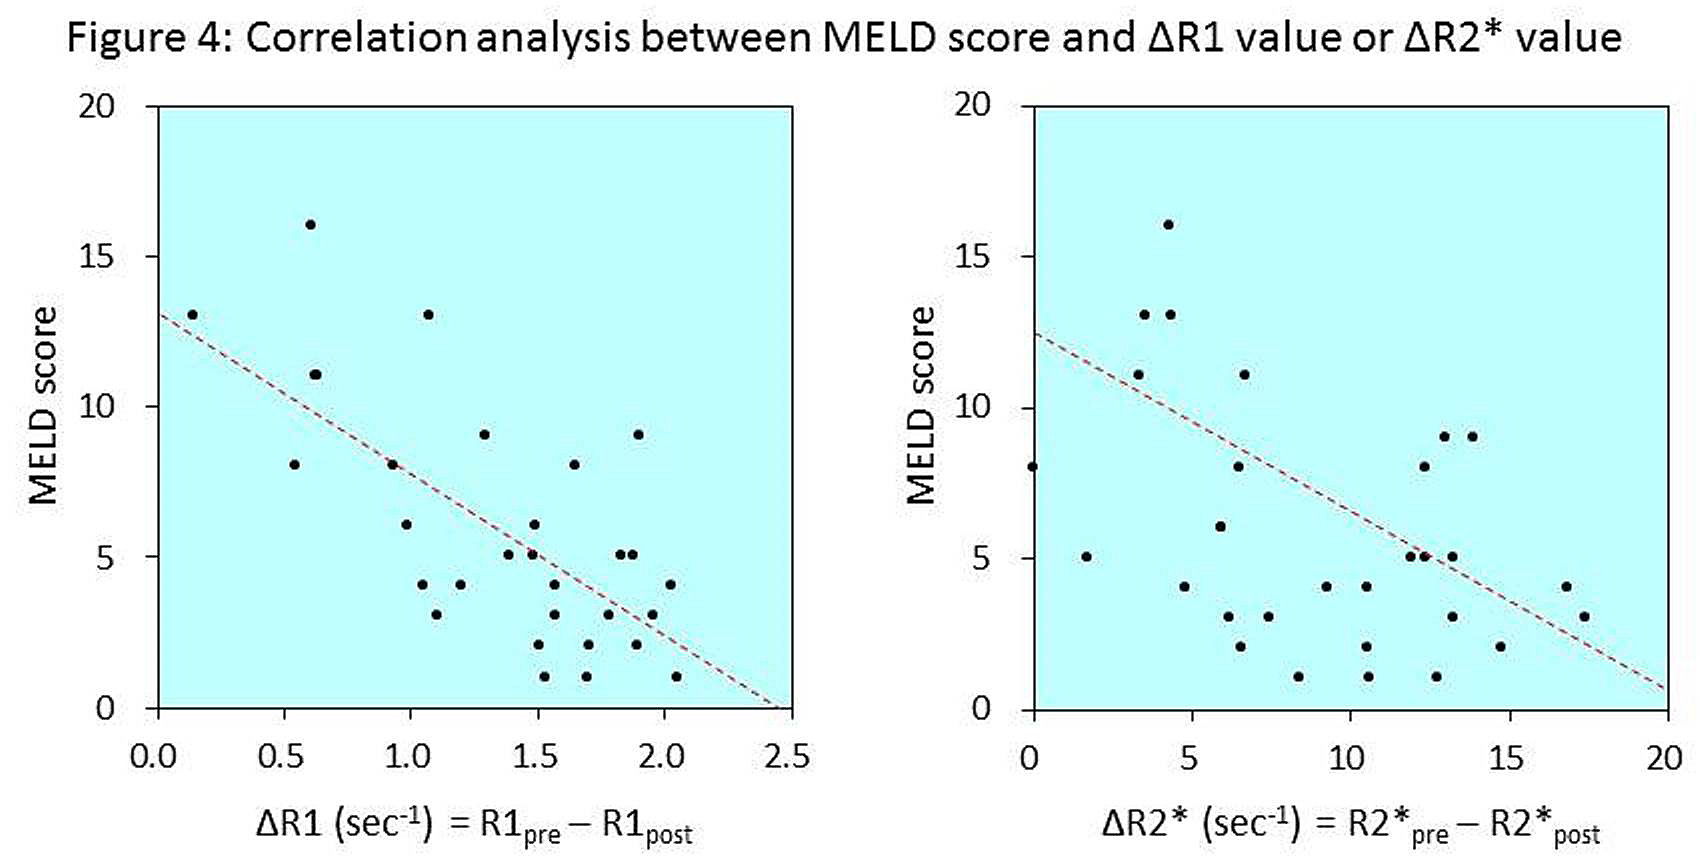
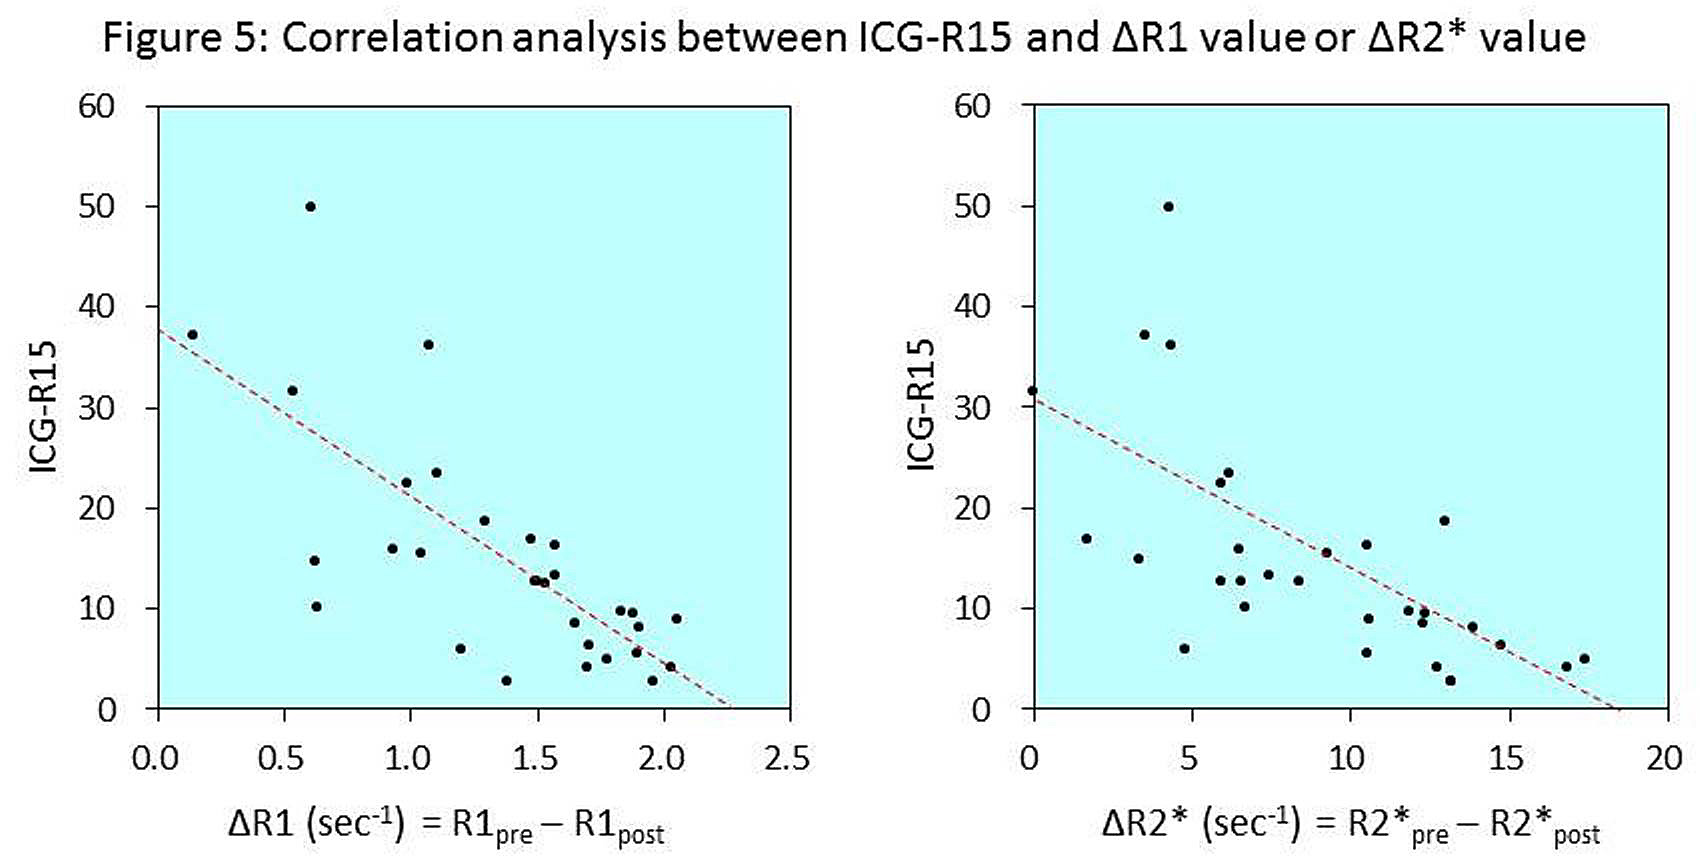
In the phantom experiment, R1 and R2* values showed excellent correlation with the concentrations of gadoxetic acid (ρ=0.993; P<0.0001 and ρ=0.979; P<0.0001, respectively), and excellent correlation was achieved between R1 and R2* values (ρ=0.964; P<0.0001) (Figure 1).In the clinical study, postcontrast R1 (2.97 ± 0.53 sec-1) significantly increased compared with precontrast R1 (1.59 ± 0.13 sec-1) (P<0.0001), and mean ΔR1 was calculated as 1.37 ± 0.51 sec-1 (Figure 2). Postcontrast R2* (72.48 ± 39.07 sec-1) also significantly increased compared with precontrast R2* (63.39 ± 40.35 sec-1) (P<0.0001), and mean ΔR2* was calculated as 8.91 ± 4.42 sec-1 (Figure 3). The ΔR1 and ΔR2* values correlated excellently (ρ=0.778, P<0.0001). The correlation with MELD score was strong for ΔR1 (ρ=-0.639, P<0.0001) and moderate for ΔR2* (ρ=-0.523, P=0.0021) (Figure 4). Strong negative correlations were also observed between ICG-R15 and ΔR1 (ρ=-0.709, P<0.0001) and ΔR2* (ρ=-0.736, P<0.0001) (Figure 5).
Discussion
The correlation between changes in R2* value and MELD score and ICG-R15 suggests that R2* map, which is easily obtained along with PDFF map, is useful for the quantitative estimation of liver function and is robust to vender/platform and field strength with whole liver coverage.Conclusion
R2* relaxometry obtained from PDFF mapping in gadoxetic acid-enhanced MRI can provide an estimate of liver function and can be alternative method to R1 relaxometry.Acknowledgements
No acknowledgement found.References
1. Kamimura K, Fukukura Y, Yoneyama T, et al. Quantitative evaluation of liver function with T1 relaxation time index on Gd-EOB-DTPA-enhanced MRI: comparison with signal intensity-based indices. J Magn Reson Imaging. 2014;40(4):884-889.
2. Besa C, Bane O, Jajamovich G, Marchione J, Taouli B. 3D T1 relaxometry pre and post gadoxetic acid injection for the assessment of liver cirrhosis and liver function. Magn Reson Imaging. 2015;33(9):1075-1082.
3. Hernando D, Sharma SD, Aliyari Ghasabeh M, et al. Multisite, multivendor validation of the accuracy and reproducibility of proton-density fat-fraction quantification at 1.5T and 3T using a fat-water phantom. Magn Reson Med. 2016 [Epub ahead of print]
4. Horng DE, Hernando D, Reeder SB. Quantification of liver fat in the presence of iron overload. J Magn Reson Imaging. 2016 [Epub ahead of print]
5. Hernando D, Wells SA, Vigen KK, Reeder SB. Effect of hepatocyte-specific gadolinium-based contrast agents on hepatic fat-fraction and R2*. Magn Reson Imaging. 2015;33(1):43-50.
6. Sofue K, Zhong X, Nickel MD, Dale BM, Bashir MR. Stability of liver proton density fat fraction and changes in R2* measurements induced by administering gadoxetic acid at 3T MRI. Abdom Radiol (NY). 2016;41(8):1555-1564.
Figures
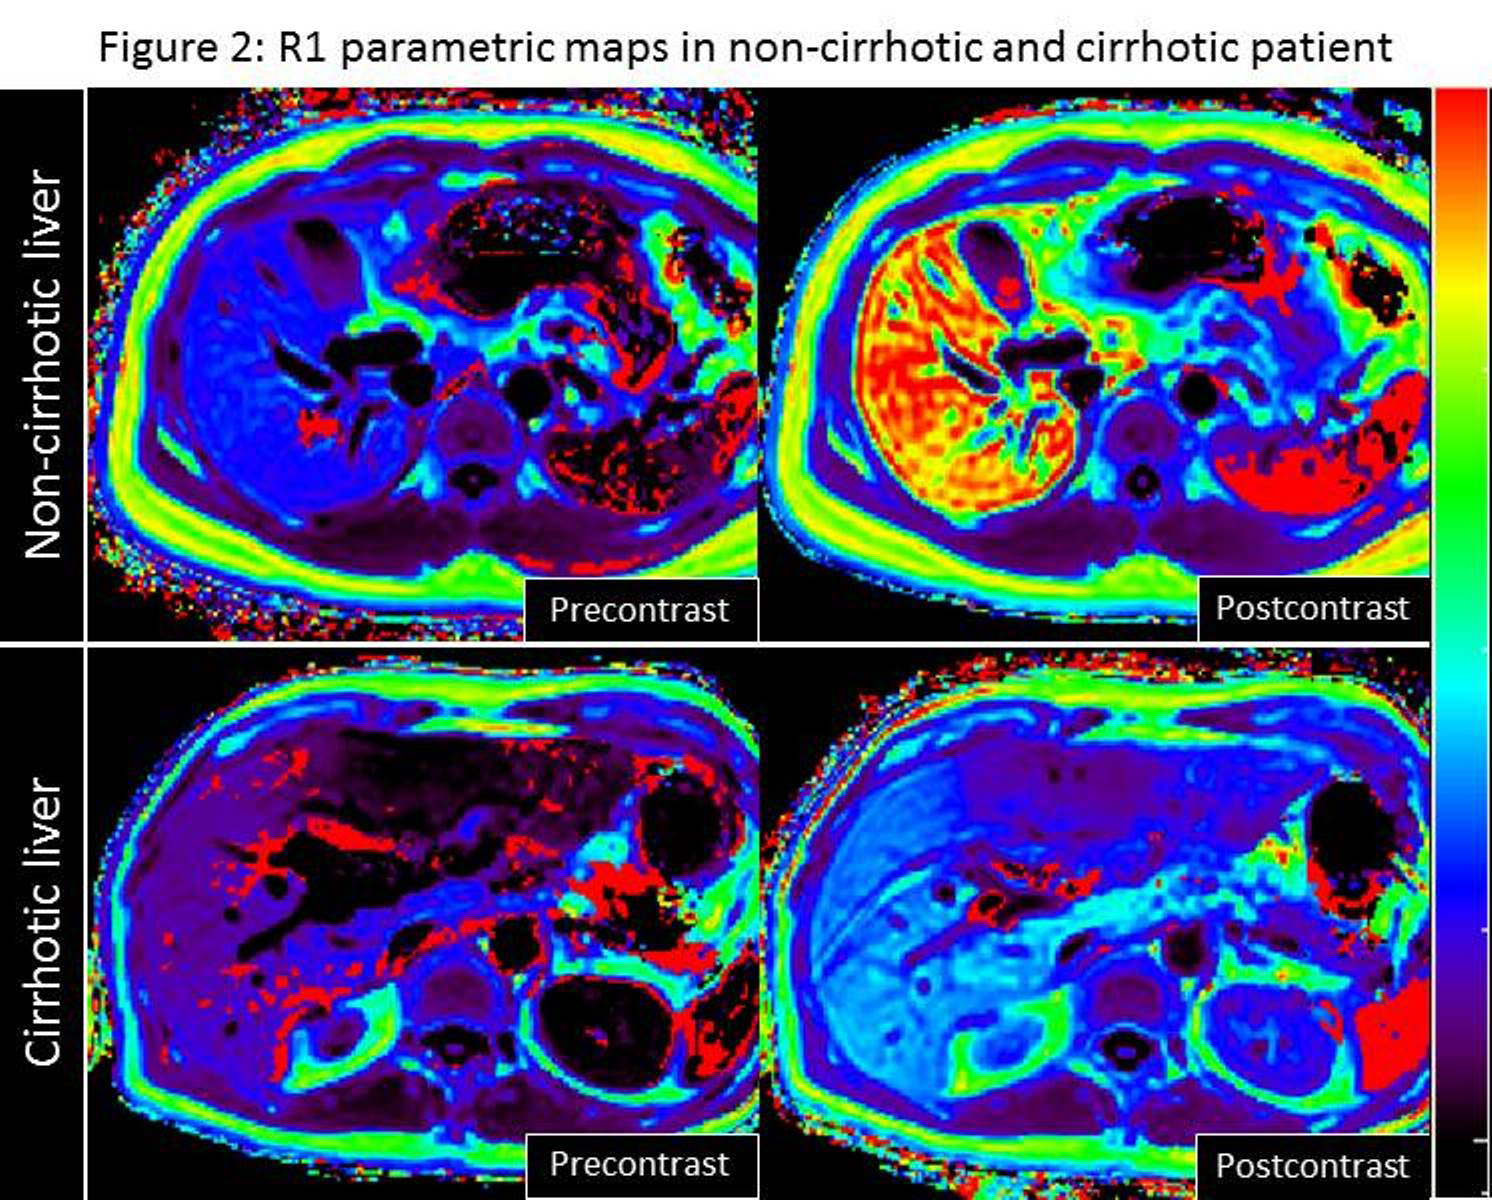
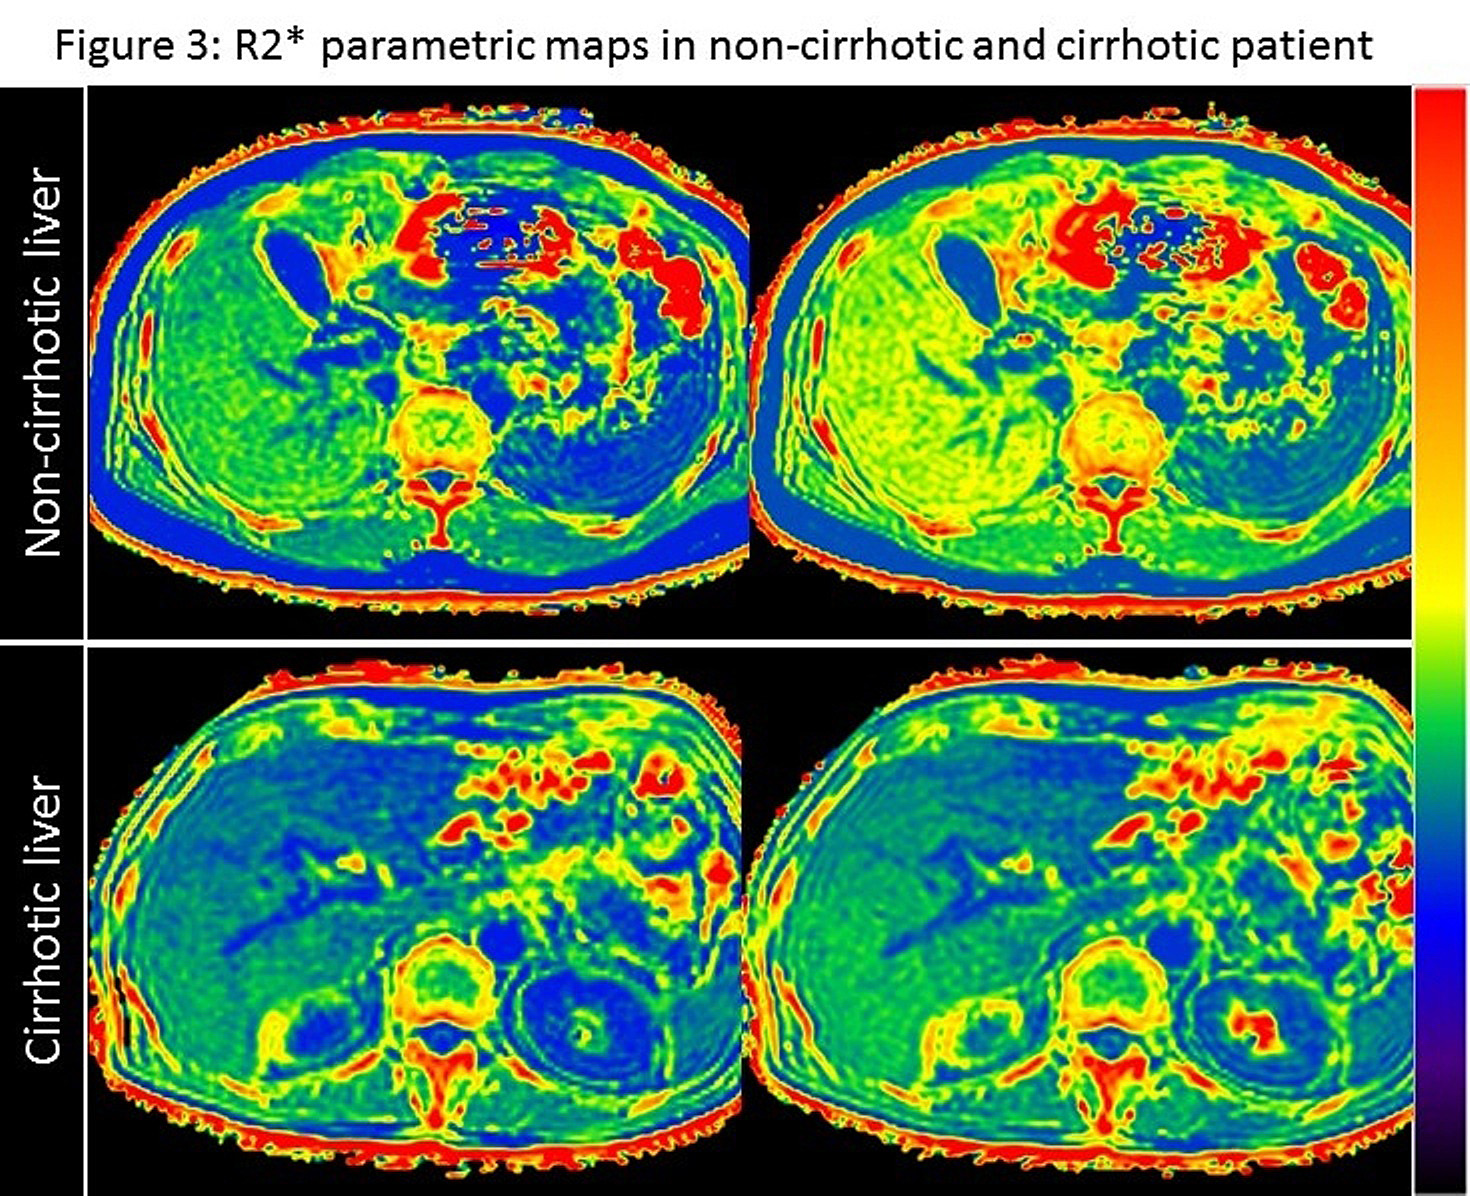
Postcontrast R2* maps demonstrate that R2* values increase compared with precontrast R2* maps both in patients with non-cirrhotic liver and with cirrhotic liver. ΔR2* value in the cirrhotic liver (3.34 sec-1) is lower than that in the non-cirrhotic liver (10.56 sec-1), indicating poorer gadoxetic acid uptake in the cirrhotic liver.
Note that these cases are identical to the cases in Figure 2.