3196
Accurate hepatic MRI proton density fat fraction assessment can be achieved with four regions-of-interest1Liver Imaging Group, Department of Radiology, University of California, San Diego, San Diego, CA, United States, 2Computational and Applied Statistics Laboratory, University of California, San Diego, San Diego, CA, United States, 3Departments of Radiology, Medical Physics, Biomedical Engineering, Medicine, and Emergency Medicine, University of Wisconsin, Madison, Madison, WI, United States, 4NAFLD Research Center, Division of Gastroenterology, Department of Medicine, University of California, San Diego, San Diego, CA, United States
Synopsis
A common approach to estimating a composite proton density fat fraction (PDFF) on MRI-PDFF maps is to draw a region-of-interest (ROI) in each of the nine Couinaud segments. This is laborious and technically challenging, however. In this secondary analysis of 398 patients, we demonstrate that 4-ROI sampling strategies that sample 2 ROIs in each hepatic lobe achieve close agreement with the 9-ROI composite. With further validation, a simple 4-ROI sampling strategy may become the new standard for measuring PDFF in clinical trials.
Introduction
Proton density fat fraction (PDFF) is the leading magnetic resonance imaging (MRI)-based biomarker for non-invasively quantifying hepatic steatosis 1–4. To date, clinical trials utilizing MRI-PDFF have used a variety of region-of-interest (ROI) sampling strategies to estimate composite PDFF values based on whole liver fat fraction maps 5. Due to regional heterogeneity in hepatic fat deposition, differences in ROI sampling methods can lead to variability in fat quantification 6–8. A common approach is to draw one ROI in each of the nine Couinaud segments 9. This is laborious and technically challenging, however 2,10. The primary aim of this study was to identify the minimum number of ROIs necessary to achieve close agreement with composite PDFF estimated by the comprehensive 9-ROI strategy.Methods
This study was a secondary analysis of adults with known or suspected NAFLD enrolled at our institution in prospective clinical studies from 2012 to 2016. Patients underwent confounder-corrected chemical-shift-encoded 3T MRI with magnitude-based PDFF quantification. Demographical information was collected for all patients. An ROI with a 1-cm radius was drawn in each of the nine Couinaud liver segments, and the PDFF values in all 9-ROIs were averaged to obtain the 9-ROI composite PDFF. For each subject, PDFF was recalculated 511 times by averaging the segmental PDFFs using every combination of 1, 2, 3 … 8 segments. The PDFFs estimated using each combination was informally compared to the 9-ROI composite PDFF using intra-class correlation coefficients (ICC) and Bland-Altman analyses. This allowed the determination of the minimum number of ROIs required to achieve close agreement with the 9-ROI composite PDFF. We defined close agreement as an ICC greater than 0.995 and the absolute value of both bounds of the limits of agreement (LOA) being less than 1.5 percentage points. Within the sampling strategies that achieved close agreement, the frequency of inclusion of each hepatic segment was counted. The accuracy of each sampling strategy for diagnosis of hepatic steatosis was assessed, with steatosis defined as PDFF greater than a 5% threshold by the 9-ROI composite 11.Results
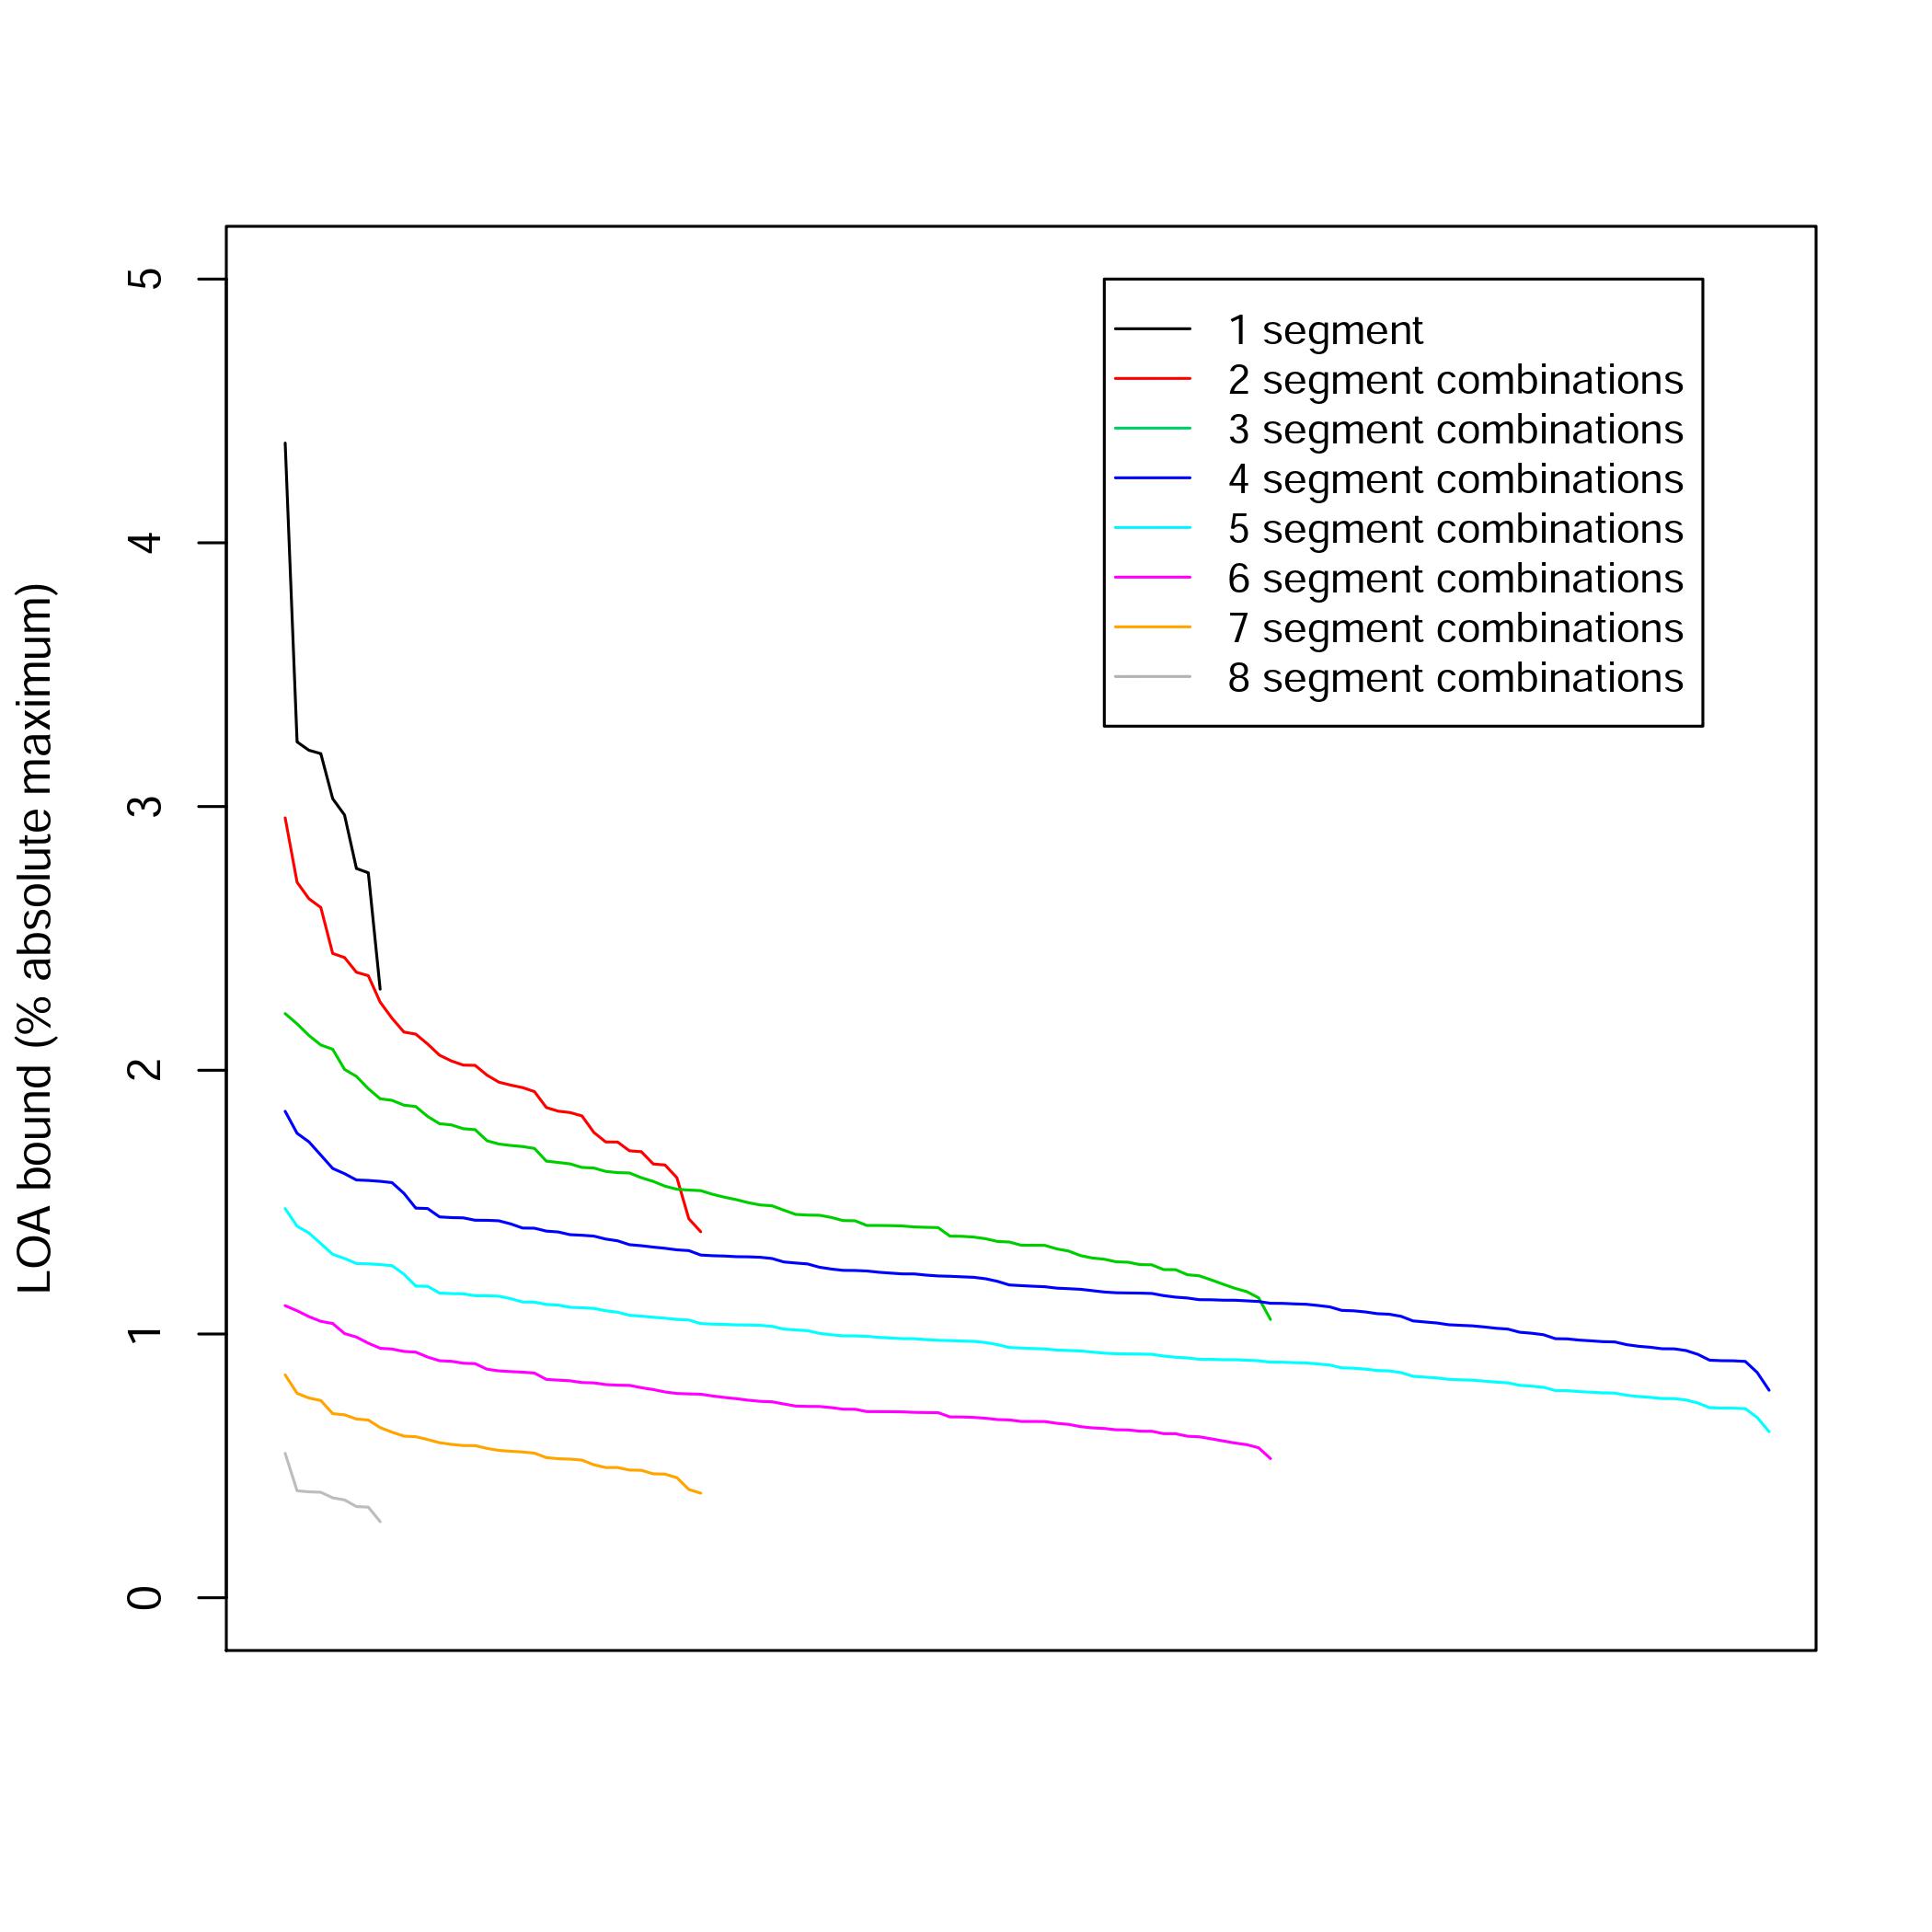
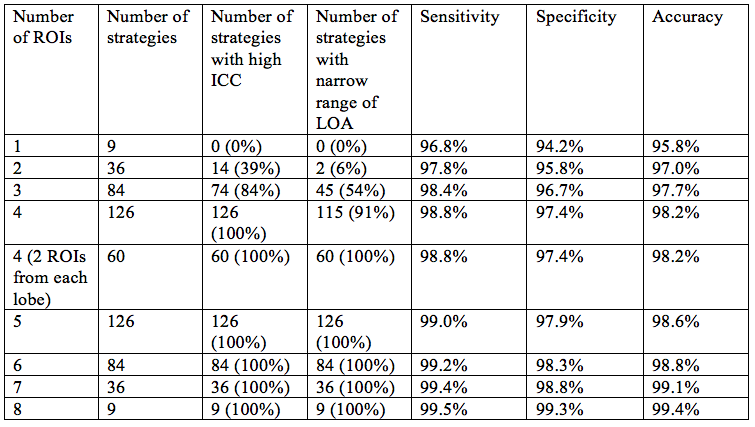
398 patients (175 men, 223 women) were included, with mean age 50 years (range: 18 – 95). As expected, ICCs increased with the number of ROIs used (Figure 1), and LOAs decreased with the number of ROIs used (Figure 2). All single-ROI strategies had ICC less than 0.995 and LOA > 1.5% (Table 1). 14/36 (39%) of 2-ROI strategies and 74/84 (88%) of 3-ROI strategies had ICC > 0.995. Only 2/36 (6%) of 2-ROI strategies and 45/84 (54%) of 3-ROI strategies had LOA < 1.5%. Any strategy with 4 or more ROIs had ICC > 0.995. 115 of 126 4-ROI strategies (91%) had LOA < 1.5%. Among 4-ROI strategies, one strategy involved all four right-lobe segments, 20 involved three right- and one left-lobe segments, 60 two right- and two left-lobe segments, 40 one right- and three left-lobe segments, and 5 only left-lobe segments. LOAs were < 1.5% in 0/1 (0%), 16/20 (80%), 60/60 (100%), 38/40 (95%), 1/5 (20%) strategies, respectively. Considering the 115 4-ROI sampling strategies that achieved close agreement with the 9-ROI composite PDFF, all hepatic segments were represented equally. 4-ROI strategies with 2 ROIs from each lobe achieved 98.2% aggregate accuracy (sensitivity: 98.8%, specificity: 97.4%) for the diagnosis of hepatic steatosis, as defined above.Discussion
These results suggest that 4-ROI sampling strategies can achieve excellent agreement and diagnostic accuracy compared to the 9-ROI composite PDFF. Limitations of this study include the use of the 9-ROI sampling method as the gold standard for comparison. Although it has been used as an accepted biomarker in multiple clinical studies, it has not been formally qualified as a biomarker for clinical trials by the FDA. Also, the large number of comparisons precluded statistical testing of individual sampling strategies. Based on our observations, 2 ROIs should be drawn in each hepatic lobe to ensure representative sampling. The agreement for all 60 of these 4-ROI strategies with 2 ROIs from each lobe was high, and all hepatic segments were represented equally among the strategies that achieved close agreement. This suggests that the specific choice of ROIs can be made based on other considerations such as the need to avoid imaging artifacts and ease of visualization. With further validation, a simple 4-ROI sampling strategy may become the new standard for measuring PDFF in clinical trials.Conclusion
4-ROI sampling strategies can achieve excellent agreement and diagnostic accuracy that approximates the agreement and accuracy achieved by the prior conventional 9-ROI composite PDFF. 2 ROIs should be drawn in each hepatic lobe to ensure representative sampling.Acknowledgements
No acknowledgement found.References
1. Yokoo T, Shiehmorteza M, Hamilton G, et al. Estimation of hepatic proton-density fat fraction by using MR imaging at 3.0 T. Radiology 2011;258(3):749–59.
2. Tang A, Tan J, Sun M, et al. Nonalcoholic fatty liver disease: MR imaging of liver proton density fat fraction to assess hepatic steatosis. Radiology 2013;267(2):422–31.
3. Reeder SB, Sirlin CB. Quantification of liver fat with magnetic resonance imaging. Magn Reson Imaging Clin N Am 2010;18(3):337–57, ix.
4. Reeder SB, Cruite I, Hamilton G, Sirlin CB. Quantitative assessment of liver fat with magnetic resonance imaging and spectroscopy. J Magn Reson Imaging 2011;34(4):729–49.
5. Vu K-N, Gilbert G, Chalut M, Chagnon M, Chartrand G, Tang A. MRI-determined liver proton density fat fraction, with MRS validation: Comparison of regions of interest sampling methods in patients with type 2 diabetes. J Magn Reson Imaging 2016;43(5):1090–9.
6. Larson SP, Bowers SP, Palekar NA, Ward JA, Pulcini JP, Harrison SA. Histopathologic variability between the right and left lobes of the liver in morbidly obese patients undergoing Roux-en-Y bypass. Clin Gastroenterol Hepatol 2007;5(11):1329–32.
7. Bonekamp S, Tang A, Mashhood A, et al. Spatial distribution of MRI-Determined hepatic proton density fat fraction in adults with nonalcoholic fatty liver disease. J Magn Reson Imaging 2014;39(6):1525–32.
8. Merriman RB, Ferrell LD, Patti MG, et al. Correlation of paired liver biopsies in morbidly obese patients with suspected nonalcoholic fatty liver disease. Hepatology 2006;44(4):874–80.
9. Hines CDG, Frydrychowicz A, Hamilton G, et al. T(1) independent, T(2) (*) corrected chemical shift based fat-water separation with multi-peak fat spectral modeling is an accurate and precise measure of hepatic steatosis. J Magn Reson Imaging 2011;33(4):873–81.
10. Bastati N, Feier D, Wibmer A, et al. Noninvasive differentiation of simple steatosis and steatohepatitis by using gadoxetic acid-enhanced MR imaging in patients with nonalcoholic fatty liver disease: a proof-of-concept study. Radiology 2014;271(3):739–47.
11. Rinella ME, McCarthy R, Thakrar K, et al. Dual-echo, chemical shift gradient-echo magnetic resonance imaging to quantify hepatic steatosis: Implications for living liver donation. Liver Transpl 2003;9(8):851–6.
Figures